Abstract
PURPOSE
The purposes of this study were to assess the presence of cam and pincer morphology in asymptomatic individuals with a negative femoroacetabular impingement test, and to determine and compare the ranges of alpha angle using two measurement methods.
MATERIALS AND METHODS
In total, 68 consecutive patients who underwent abdominopelvic computed tomography (CT) for reasons other than hip problems were the patient population. Patients who had a positive femoroacetabular impingement test were excluded. Alpha angle measurements from axial oblique (AN) and radial reformat-based images (AR) from the anterior through the superior portion of the femoral head-neck junction, as well as femoral head-neck offset, center-edge angle, acetabular version angle measurements, and acetabular crossover sign assessment, were made.
RESULTS
Overall prevalences of cam (increased alpha angle, decreased femoral head-neck offset) and pincer morphology (increased center-edge angle, decreased acetabular version) were 20.0%, 26.8%, 25.8%, and 10.2% of the hips, respectively. The mean AR ranged from 41.64°±4.23° to 48.13°±4.63°, whereas AN was 41.10°±4.44°. The values of AR were higher than AN, and the difference was statistically significant (P < 0.001). The highest AR values were measured on images from the anterosuperior section of femoral head-neck junction.
CONCLUSION
In asymptomatic subjects, higher alpha angle values were obtained from radial reformatted images, specifically from the anterosuperior portion of the femoral head-neck junction compared with the axial oblique CT images. Other measurements used for the assessment of cam and pincer morphology can also be beyond the ranges that are considered normal in the general population.
Femoroacetabular impingement (FAI) is a recognized risk factor for the development of osteoarthritis (1, 2). Morphological abnormalities of the proximal femur and/or acetabulum result in abnormal contact between the femur and acetabulum during hip motion, especially during flexion and internal rotation. The resulting abnormal stress on the acetabular labrum and articular cartilage can cause degeneration and tearing of the labrum, damage the adjacent acetabular cartilage, and eventually lead to osteoarthritis (1).
Morphological variations and measurements demonstrating such alterations in the proximal femoral head and acetabulum that might be responsible for the development of FAI have become a research focus (2–7). The alpha angle (AA) is a parameter that demonstrates the degree of focal femoral epiphyseal overgrowth and reflects insufficiency of the anterolateral femoral head-neck offset and asphericity of the femoral head (5, 7). Since the concept of FAI was proposed, the AA measurement has become a widely used method to quantify osseous deformity at the femoral head-neck junction (5). However, there has been some controversy regarding its validity in clinical use, because of the substantial overlap in AA measurements between volunteers and symptomatic patients with cam-type deformity (8, 9).
Our purposes in this prospective study were to determine the range of AA values in radial reformatted computed tomography (CT) images, to assess the prevalence of cam and pincer morphology in asymptomatic patients with a negative hip impingement test, and to compare the AA values using two measurement methods.
Materials and methods
Patient population
The local ethics committee approved our study, and we obtained written consent from all subjects prior to radiological examinations. In total, 68 consecutive patients aged 18–46 years (mean age, 32.9 years) who underwent abdominopelvic CT over a five-month period for reasons other than hip problems and who agreed to participate in this study constituted the patient population. Patients who claimed to have had hip and/or vertebral disorders, including pain and previous surgery, and who had a positive FAI test were excluded. Eventually, 131 hips were available for assessment.
CT examination and image reconstruction
All CT examinations were performed using three different multidetector CT units with 4, 16, or 64 channels (Somatom Volume Zoom, n=2; Somatom Sensation, n=0; and Somatom Definition, n=16; respectively; Siemens Healthcare Solutions, Erlangen, Germany). Starting from the superior iliac wing, axial 2 mm reconstructions were obtained through the femoral neck from source images, 5 mm in thickness. These images were then transferred to workstations. One radiologist (S.V.) (other than the eventual readers) reformatted the images for two different approaches to AA measurements: a) axial oblique AA (AN), as described originally by Nötzli et al. (5) (Fig. 1), and b) radial AA (AR), from the anterior to superior section of the femoral head-neck junction (Fig. 2) (A1 through A7; A1, anterior-most and A7, superior-most section). Additionally, the femoral head-neck offset (FHNO), center-edge angle (CEA), and acetabular version angle (AV) measurements, and acetabular crossover sign assessments were performed.
Figure 1.
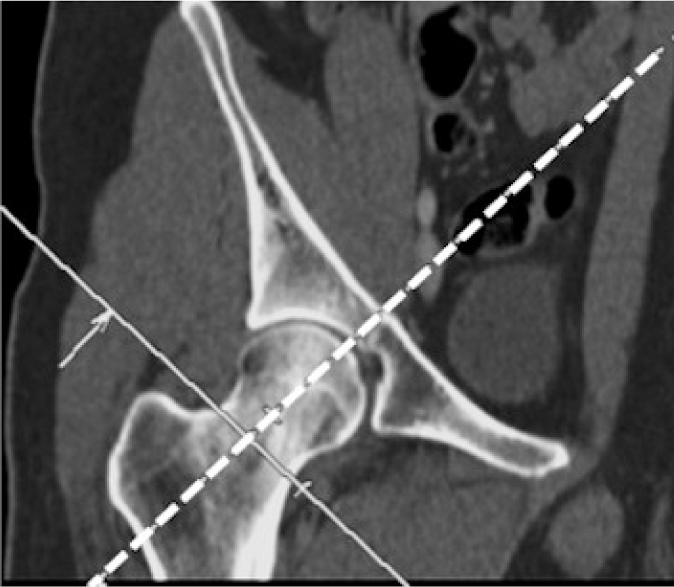
Coronal reformatted CT image showing the reference plane (dashed line) for axial oblique alpha angle (AN) measurements.
Figure 2. a–c.

Coronal reformatted CT (a) image showing the reference plane (solid line) for radial alpha angle (AR) reconstruction. Axial CT image (b) used for the formation of radial reformatted images demonstrates superimposed radial reference lines at 15° intervals. Sagittal thick slab multiplanar reformation image (c) shows planes of radial reformats passing through the anterior, anterosuperior, and superior portions of the femoral head-neck junction.
For AN, an axial oblique image through the mid-femoral neck was used. For AR measurements, multiplanar reformatting (MPR) was conducted to generate 2 mm thick axial oblique images perpendicular to the long axis of the femoral neck, using the center of the femoral neck as the axis of rotation (Fig. 2a, 2b); seven radial images were generated at 15° intervals. As such, all radial MPR images were oriented perpendicular to the femoral head-neck junction at the anterior, anterosuperior, and superior segments (Fig. 2c; A1–A7, A1 being the anterior-most and A7 the superior-most sections of the femoral head-neck junction). The reason for choosing the anterior through the superior portion of the femoral head-neck junction for radial reformatted sections was that previous studies involving radial magnetic resonance imaging (MRI) of the hip have found that the greatest degree of contour deformity, and thus the highest AA value, occurs anterosuperiorly rather than at other locations (6, 10). All reformatted images were transferred to a picture archiving and communication system (PACS) workstation (Centricity PACS-IW 3.7.3, GE Healthcare, Milwaukee, Wisconsin, USA) and all measurements were made in this system. Prereformatted images were used for AA measurements, to enable two readers to make AA measurements on the same set of images.
Image evaluation
Alpha angle measurements
All AA measurements were performed by two experienced radiologists (F.B.E., E.Ş.). To assess the intraand interobserver observer variability of AA measurements, 10 randomly selected patients (20 hips) were re-examined after a two-week period by the same two readers. Before performing AA measurements, the two radiologists worked together on five other patients not included in the study, using previously described AA measurement methods (5). On every image, the AA was measured at the center of the femoral head between the axis through the femoral neck and the center of the femoral head and the point where the distance from the center of the femoral head to the peripheral contour of the femoral head exceeded the radius of the femoral head (5). The center of the femoral head was identified by placing a PACS-generated circle over the contours of the femoral head. The axis of the femoral neck was defined as a line that passes through the center of the femoral head and the center of the femoral neck at its narrowest point (Fig. 3).
Figure 3.
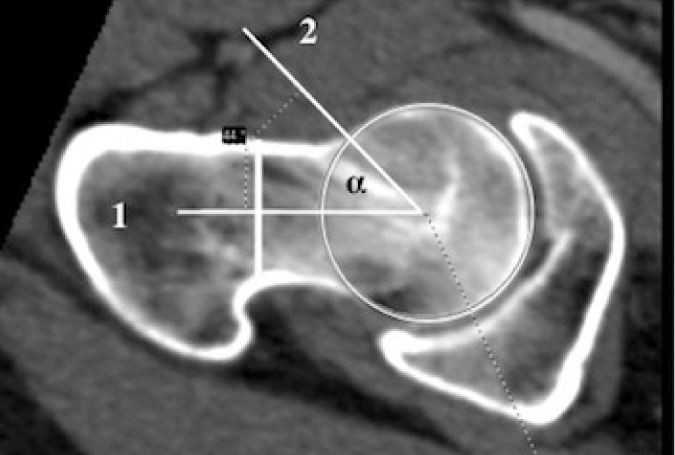
Measurement of the alpha angle. The alpha angle is formed between lines 1 and 2. Line 1 passes from the center of the femoral neck axis and the center of the femoral head, and line 2 from the center of the femoral head and the point where the radius of femoral head exceeds the circle that fits the femoral head size.
Other measurements
Other measurements/observations including FHNO, CEA, AV, and the crossover sign were made on each hip joint by a single radiologist (F.B.E.). The FHNO was measured on the image that was used for the AN measurement. Decreased femoral head-neck offset was defined as <8 mm (11) (Fig. 4). The CEA was measured in the transparent three-dimensional pelvis model (Fig. 5). Coxa profunda was defined as CEA being >40° (11). The AV was measured on the orthogonal axial reformatted image at the level where the acetabular fossa was the deepest; this plane was determined by cross-referencing on the coronal plane (Fig. 6). Acetabular retroversion was defined as AV being <15° (12). The presence or absence of the acetabular crossover sign was determined on the transparent three-dimensional pelvis model; while making this observation, care was taken to ensure that the tip of the coccyx was on the midline and at about 1 cm above the superior border of the pubic symphysis (Fig. 7) (12).
Figure 4.
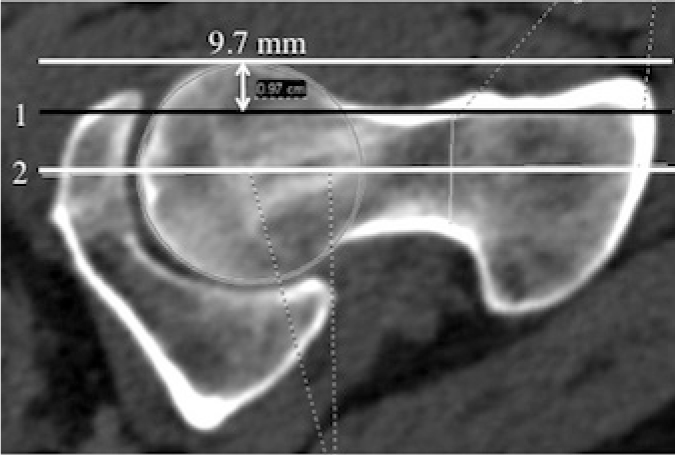
Femoral head-neck offset (FHNO) measurement. On an axial oblique CT image, the thickness of the femoral head that lies anterior to the line passing through the anterior wall of the femoral neck (line 1) and parallel to the line crossing the center of the femoral head and neck (line 2) reveals the FHNO.
Figure 5.
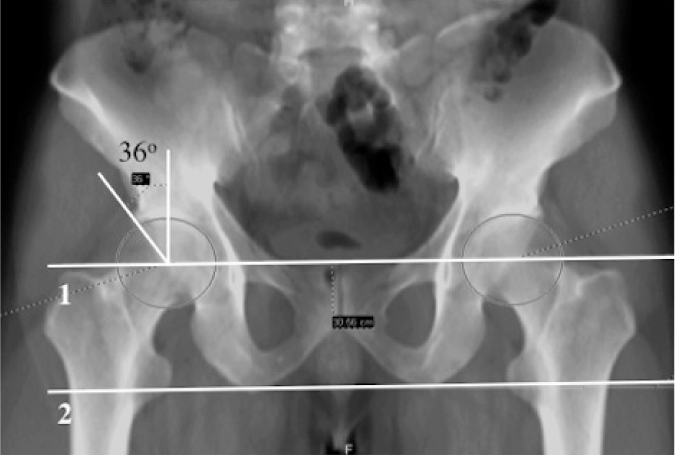
Center-edge angle measurement. Coronal transparent three-dimensional pelvis model obtained by CT is used for measuring the angle between the line joining the lateral edge of the acetabulum and the center of the femoral head (line 1) and the vertical line that is perpendicular to the horizontal line joining the ischial tuberosities (line 2).
Figure 6.
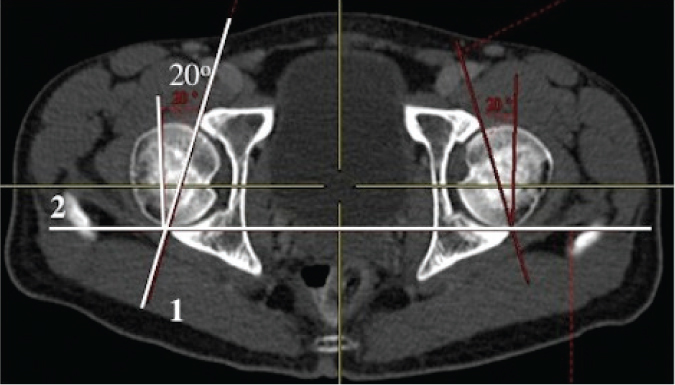
Acetabular version angle measurement. The acetabular version angle is measured from an axial source image by measuring the angle between the line joining the anterior and posterior edges of the acetabulum (line 1) and the line perpendicular to the line joining the posterior edges of the acetabula (line 2) on both sides.
Figure 7. a, b.

The acetabular crossover sign was assessed on the coronal transparent three dimensional pelvis model obtained from CT. The anterior acetabular margin (dashed line) does not cross the posterior margin and is medial to it (negative acetabular crossover sign) (a). The anterior acetabular margin (dashed line) crosses the posterior margin (positive acetabular crossover sign) (b).
Data analysis
The paired sample t test and Pearson’s correlation coefficient were used for comparisons of mean AN and AR, and for intra- and interobserver variability of AN and AR measurements, respectively. For the assessment of gender difference for AA, FHNO, CEA, and AV, independent sample t tests were used. The Statistical Package for the Social Sciences (SPSS) software (version 17.0 for Windows, SPSS Inc., Chicago, Illinois, USA) was used for all calculations.
Results
The mean age of the 68 patients (38 males, 30 females) was 32.9±7.70 years (range, 19–46 years). Five joints in five patients were excluded because the impingement test was positive on that side. In total, 131 hips were evaluated; none showed evidence of established degenerative changes, such as joint space narrowing, osteophytes, subchondral cysts, and/or sclerosis.
Alpha-angle measurements
The mean of AR (A1–A7) ranged between 41.64°±4.23° and 48.13°±4.63° whereas AN was 41.10°±4.44°. There was a statistically significant difference between AR (A2–A7) and AN (P < 0.001), and AR values were higher than AN. The maximal AR values were measured from the A4–A6 locations (corresponding to the anterosuperior segment of the femoral head-neck junction) (Table 1; Fig. 8). The mean values of A5 and A6 were 48.78°±5.0° and 49.22°±4.7° for males, and 46.69°±4.0° and 46.95°±4.0° for females, respectively; the difference was statistically significant at both locations (P < 0.01). For other locations, no statistically significant gender difference was found.
Table 1.
Descriptive values of AR and AN
| Segments | AR (°) | AN (°)a | P b |
|---|---|---|---|
| A1 | 41.64±4.23 (33–54) | 0.005 | |
| A2 | 41.92±4.42 (33–57) | 0.001 | |
| A3 | 44.25±4.74 (36–58) | < 0.001 | |
| A4 | 46.18±5.00 (37–62) | 41.10±4.44 (32–55) | < 0.001 |
| A5 | 47.97±4.52 (39–66) | < 0.001 | |
| A6 | 48.13±4.63 (38–62) | 0.001 | |
| A7 | 46.51±4.09 (37–59) | < 0.001 |
AN is a measurement that is made from anterior portion of femoral head-neck juction, so there is only one measurement for AN for all segments.
P < 0.001 was considered statistically significant difference. Statistically significant difference was detected between AR and AN measurements in all segments except A1.
AN, alpha angle measurement from axial oblique images; AR, alpha angle measurement from radial reformat-based images.
Data are presented as mean±standard deviation (range).
Figure 8. a–c.

An asymptomatic 45-year-old male with negative impingement test. Alpha angles from A6 (anterosuperior segment of the femoral head-neck junction) (a), A2 (anterior segment of femoral head-neck junction) (b), and AN (c). Note that AA at A6 is higher than that at A2 and AN.
In 21 subjects (31 hips), AR values were equal to or higher than 55° in 46 locations (Table 2). Of these 21 patients, 14 (66%) were males and 7 (34%) were females. AR values in these patients were ≥55° in two or more locations in 12 subjects, and in only one location in nine patients. In one patient, while AN was 55°, AR was increased in more than one location.
Table 2.
Distribution of AR ≥55° relative to radial image location in 21 subjects (31/131 hips)
| A1 | A2 | A3 | A4 | A5 | A6 | A7 | Totala |
|---|---|---|---|---|---|---|---|
| 0 | 2 | 5 | 10 | 12 | 12 | 5 | 46 |
AR was ≥55° at 46 segments in 31 hips of 21 subjects.
For AR and AN measurements, the intraobserver correlation was moderate to very strong (r=0.65–0.92) and the interobserver correlation was moderate to high (r=0.53–0.87); both were statistically significant (P < 0.001).
Other measurements
The mean FHNO was 9.01±1.77 mm (range, 5–13 mm). No statistically significant gender difference was detected for FHNO (P > 0.05). In 37 subjects (26.8%, 37 hips), FHNO was <8 mm.
The mean CEA was 37.28°±6.12° (range, 25°–56°). No statistically significant gender difference was detected for CEA (P > 0.05). In 33 patients (25.8%, 33 hips), CEA was >40°.
The mean AV angle was 21.52°±4.98° (range, 12°–39°). There was a statistically significant gender difference in terms of AV; higher values were observed in females. In 13 patients (10.2%, 13 hips), the AV angle was <15°. In 15 patients (15 hips, 11.7%), there was an acetabular crossover sign.
Overall prevalences of cam morphology (increased radial AA, decreased FHNO) and pincer morphology (increased CEA, decreased AV, and presence of acetabular crossover sign) were 20.0%, 26.8%, 25.8%, 10.2%, and 11.7% of the hips, respectively.
Discussion
In this prospective study performed in an asymptomatic patient population with negative impingement tests, we found that the prevalence of increased AR value (≥55°) was 20%; for AR measurements, maximum values were in the anterosuperior (A4–A6) portions of the femoral head-neck junction and for those locations, increased values were predominantly seen in males versus females. The prevalences of cam and pincer morphology varied between 20% and 26.8% and 10.2% and 25.8%, respectively (ranges are due to the use of various parameters, as mentioned above).
The AA measurements were used initially to quantify cam-type deformities only at the anterior aspect of the femoral head and neck (5). Later, radial plane images were introduced to assess the AA around the whole femoral circumference (6, 10). In prior studies, a variety of threshold values were used for distinguishing normal and abnormal AAs. More recently, however, the use of AA for assessing cam-type deformities has become controversial. Sutter et al. (8) demonstrated that increasing the AA threshold value from 55° to 60° reduced false-positive results in a study that was performed to develop threshold values of AA in volunteers and patients with FAI. They also found that 38%–62% of volunteers had an AA value greater than 55°. In our study, 20% of the asymptomatic subjects had AAs greater than 55° in at least one radial plane. Our finding that the maximum AA values were obtained at the A4–A6 locations (i.e., the anterior-superior segment of the femoral head-neck junction) is consistent with the findings of Sutter et al. (8) and Reichenbach et al. (13).
In our patient population, most (14/21) of the patients with AA greater than 55° were males; this is also in accordance with previous reports. We found a statistically significant difference between males and females in terms of AA values at the A5 and A6 locations. In the literature, AA values were higher in the anterosuperior portion of the femoral neck not only in patients with suspected cam-type impingement but also in asymptomatic individuals (3, 8, 9, 14). In a study of 50 patients, some degree of cam-type deformity was found in 74% of asymptomatic patients in at least one plane of the reconstructed CT data set with a nonquantitative assessment (3). Reichenbach et al. (9) in a population of 244 young asymptomatic male individuals who underwent magnetic resonance imaging (MRI) with radial reconstructions, definite cam-type deformities were detected in 24%. They also demonstrated that a mild decrease of the femoral head-neck offset was seen in 74% of the population, mostly at the anterosuperior position.
For intra- and interobserver variability/agreement in AA measurement, various results have been published. While Nötzli et al. (5) reported low intraobserver variability (2% intraobserver difference), Lohan et al. (4) found up to 30% intraobserver difference for AA measurements. In a study by Nouh et al. (15) for the validation of AA measurements, moderate reproducibility was found after repeated assessments by the same reader (15). In some studies, interobserver agreement and reproducibility for AA measurements were reported to be moderate-to-good with intraclass coefficient constant values ranging from 0.50 to 0.79 (8, 9, 14). In our study, however, we found moderate-to-very-strong (r=0.65–0.94) and moderate-to-high (r=0.53–0.87) correlations for intra- and interobserver agreement, respectively. Measurement of AA from the same set of images (already reformatted by a third radiologist) and initial work-up of AA measurement techniques by the readers on five other subjects not included in the study before performing the measurements might explain the higher correlation levels in our study.
In a study by Kang et al. (3), the prevalence of bony abnormalities predisposing to femoroacetabular impingement—in addition to AA measurements on the axial oblique images—were evaluated in asymptomatic individuals. They found that 33% of females and 52% of males had at least one predisposing factor (increased AA, decreased FHNO, increased CEA, decreased AV angle) for FAI in one or both hip joints. The prevalences of increased AA, decreased FHNO, increased CEA, decreased AV, and the crossover sign in their study were 10%, 12%, 16%, 15%, and 25%, respectively.
A few other reported studies (8, 9, 14) have assessed the ranges of AA values in asymptomatic subjects; however, our study is unique in several aspects. In three of these previous studies, asymptomatic volunteers were recruited to undergo MRI examinations (3, 8, 9, 14) for data collection. In our study, we included patients who underwent abdominopelvic CT for an indication other than hip problems, so none was required to undergo an additional examination. In one of these previous studies, only male subjects were included (9), whereas in our study we included patients of both genders. Furthermore, unlike other studies, we measured seven different AAs, passing from the quadrants at the anterior through the superior segments of the femoral head-neck junction. In other studies, authors used AAs passing from anterior and anterosuperior segments (two AA measurements) (14) or from anterior, anterosuperior, superior, anteroinferior, and posterosuperior segments (five AA measurements) (8). In one of the studies that used MRI data; the authors used a semiquantitative method to determine the presence of a cam-type deformity rather than measuring AA quantitatively (9). There is only one other study (3) in which CT data derived from abdominopelvic CT examination of patients without a hip problem was used for AA measurement. In that study, however, the authors used only the axial oblique technique (Nötzli’s method) for AA measurements, not the radial technique that is considered the gold standard for AA measurements.
Our study had several limitations. First, our patient population was limited and larger studies are required to further validate the findings. Second, we did not perform radial AA measurements through the entire circumference of the femoral head and neck, limiting our measurements instead to the anterior, anterosuperior, and superior segments. Considering that the majority of cam deformities are found in these segments, this limitation would not seem to have much clinical impact. Third, we did not look for the more recently described “noncam, nonpincer” FAI morphology of the so-called “subspine” impingement and femoral antetorsion variations (16, 17).
In conclusion, higher AA values in the anterosuperior portion of the femoral head-neck junction on radial reformatted CT images—compared with the axial oblique—is a not infrequent finding in an asymptomatic population, especially in males. Radiologists should also be aware that, not infrequently, the other measurements (FHNO, CEA, AV, acetabular crossover sign) used for the assessment of cam and pincer morphology can also be beyond the range considered normal in the general population.
Footnotes
Conflict of interest disclosure
The authors declared no conflicts of interest.
References
- 1.Ganz R, Parvizi J, Beck M, Leunig M, Notzli H, Siebenrock KA. Femoroacetabular impingement: a cause for osteoarthritis of the hip. Clin Orthop Relat Res. 2003;417:112–120. doi: 10.1097/01.blo.0000096804.78689.c2. [DOI] [PubMed] [Google Scholar]
- 2.Ecker TM, Tannast M, Puls M, Siebenrock KA, Murphy SB. Pathomorphologic alterations predict presence or absence of hip osteoarthrosis. Clin Orthop Relat Res. 2007;465:46–52. doi: 10.1097/BLO.0b013e318159a998. [DOI] [PubMed] [Google Scholar]
- 3.Kang AC, Gooding AJ, Coates MH, Goh TD, Armour P, Rietveld J. Computed tomography assessment of hip joints in asymptomatic individuals in relation to femoroacetabular impingement. Am J Sports Med. 2010;38:1160–1165. doi: 10.1177/0363546509358320. [DOI] [PubMed] [Google Scholar]
- 4.Lohan DG, Seeger LL, Motamedi K, Hame S, Sayre J. Cam-type femoral-acetabular impingement: is the alpha angle the best MR arthrography has to offer? Skeletal Radiol. 2009;38:855–862. doi: 10.1007/s00256-009-0745-3. [DOI] [PubMed] [Google Scholar]
- 5.Notzli HP, Wyss TF, Stoecklin CH, Schmid MR, Treiber K, Hodler J. The contour of the femoral head-neck junction as a predictor for the risk of anterior impingement. J Bone Joint Surg Br. 2002;84:556–560. doi: 10.1302/0301-620x.84b4.12014. [DOI] [PubMed] [Google Scholar]
- 6.Rakhra KS, Sheikh AM, Allen D, Beaule PE. Comparison of MRI alpha angle measurement planes in femoroacetabular impingement. Clin Orthop Relat Res. 2009;467:660–665. doi: 10.1007/s11999-008-0627-3. [DOI] [PMC free article] [PubMed] [Google Scholar]
- 7.Kassarjian A, Yoon LS, Belzile E, Connolly SA, Millis MB, Palmer WE. Triad of MR arthrographic findings in patients with cam-type femoroacetabular impingement. Radiology. 2005;236:588–592. doi: 10.1148/radiol.2362041987. [DOI] [PubMed] [Google Scholar]
- 8.Sutter R, Dietrich TJ, Zingg PO, Pfirrmann CW. How useful is the alpha angle for discriminating between symptomatic patients with cam-type femoroacetabular impingement and asymptomatic volunteers? Radiology. 2012;264:514–521. doi: 10.1148/radiol.12112479. [DOI] [PubMed] [Google Scholar]
- 9.Reichenbach S, Juni P, Werlen S, et al. Prevalence of cam-type deformity on hip magnetic resonance imaging in young males: a cross-sectional study. Arthritis Care Res (Hoboken) 2010;62:1319–1327. doi: 10.1002/acr.20198. [DOI] [PubMed] [Google Scholar]
- 10.Pfirrmann CW, Mengiardi B, Dora C, Kalberer F, Zanetti M, Hodler J. Cam and pincer femoroacetabular impingement: characteristic MR arthrographic findings in 50 patients. Radiology. 2006;240:778–785. doi: 10.1148/radiol.2403050767. [DOI] [PubMed] [Google Scholar]
- 11.Wenger DE, Kendell KR, Miner MR, Trousdale RT. Acetabular labral tears rarely occur in the absence of bony abnormalities. Clin Orthop Relat Res. 2004;426:145–150. doi: 10.1097/01.blo.0000136903.01368.20. [DOI] [PubMed] [Google Scholar]
- 12.Ito K, Minka MA, 2nd, Leunig M, Werlen S, Ganz R. Femoroacetabular impingement and the cam-effect. A MRI-based quantitative anatomical study of the femoral head-neck offset. J Bone Joint Surg Br. 2001;83:171–176. doi: 10.1302/0301-620x.83b2.11092. [DOI] [PubMed] [Google Scholar]
- 13.Reichenbach S, Leunig M, Werlen S, et al. Association between cam-type deformities and magnetic resonance imaging-detected structural hip damage: a cross-sectional study in young men. Arthritis Rheum. 2011;63:4023–4030. doi: 10.1002/art.30589. [DOI] [PubMed] [Google Scholar]
- 14.Hack K, Di Primio G, Rakhra K, Beaule PE. Prevalence of cam-type femoroacetabular impingement morphology in asymptomatic volunteers. J Bone Joint Surg Am. 2010;92:2436–2444. doi: 10.2106/JBJS.J.01280. [DOI] [PubMed] [Google Scholar]
- 15.Nouh MR, Schweitzer ME, Rybak L, Cohen J. Femoroacetabular impingement: can the alpha angle be estimated? AJR Am J Roentgenol. 2008;190:1260–1262. doi: 10.2214/AJR.07.3258. [DOI] [PubMed] [Google Scholar]
- 16.Larson CM, Kelly BT, Stone RM. Making a case for anterior inferior iliac spine/sub-spine hip impingement: three representative case reports and proposed concept. Arthroscopy. 2011;27:1732–1737. doi: 10.1016/j.arthro.2011.10.004. [DOI] [PubMed] [Google Scholar]
- 17.Sutter R, Dietrich TJ, Zingg PO, Pfirrmann CW. Femoral antetorsion: comparing asymptomatic volunteers and patients with femoroacetabular impingement. Radiology. 2012;263:475–483. doi: 10.1148/radiol.12111903. [DOI] [PubMed] [Google Scholar]


