Abstract
Benign prostatic hyperplasia (BPH) is a nonmalignant pathological enlargement of the prostate, which occurs primarily in the transitional zone. BPH is highly prevalent and is a major cause of lower urinary tract symptoms in aging males, although there is no direct relationship between prostate volume and symptom severity. The progression of BPH can be quantified by measuring the volumes of the whole prostate and its zones, based on image segmentation on magnetic resonance imaging. Prostate volume determination via segmentation is a useful measure for patients undergoing therapy for BPH. However, prostate segmentation is not widely used due to the excessive time required for even experts to manually map the margins of the prostate. Here, we review and compare new methods of prostate volume segmentation using both manual and automated methods, including the ellipsoid formula, manual planimetry, and semiautomated and fully automated segmentation approaches. We highlight the utility of prostate segmentation in the clinical context of assessing BPH.
Benign prostatic hyperplasia (BPH) can result in lower urinary tract symptoms, and is one of the most common diseases affecting aging men. BPH can compromise quality of life and is a major healthcare cost. Despite the high prevalence of BPH, few methods of accurately assessing prostate volume are actually used in clinical practice. While patient assessment of urinary symptoms dictates the need for treatment, it is highly subjective, whereas prostate volume change is a more objective measure of treatment response. The most common clinical model for approximating the prostate gland size is the ellipsoid model from transrectal ultrasonography (TRUS) imaging, which has been shown to underestimate prostate volume for prostates larger than 50 mL and to overestimate prostate volume for glands smaller than 30 mL (1). Despite its limitations, the TRUS method of prostate volume assessment is preferred in current clinical practice due to its availability and cost and time efficiency (2). More accurate prostate volume measurement with magnetic resonance (MR) planimetry is time-intensive and, thus, rarely performed.
Prostate segmentation is an accurate technique for prostate volume determination that can be used in coregistration with various imaging modalities, such as magnetic resonance imaging (MRI) with positron emission tomography and MRI with ultrasonography. Segmentation can be used for both diagnostic and interventional procedures, including guided biopsies and focal ablation. Newly developed methods of automated prostate segmentation allow for efficient prostate volume determination, thereby enhancing decision support systems and computer-aided diagnosis tools.
This article reviews the major methods of prostate volume determination currently in use, including the ellipsoid formula, manual planimetry, and semiautomated and fully automated segmentation. A clinical overview of BPH is also provided to highlight the utility of prostate segmentation in the clinical management of this disease.
Benign prostatic hyperplasia
Overview
BPH is a pathological process, characterized by the nonmalignant enlargement of the periurethral transition zone of the prostate (3). BPH involves a net increase in the number of stromal and epithelial cells in the prostate because of an imbalance between apoptosis and cell proliferation (4). BPH can lead to constriction of the urethra and subsequent obstruction of urinary flow, inducing detrusor dysfunction. BPH is the most common cause of lower urinary tract symptoms in aging males, which include urinary frequency issues, urgency, nocturia, and dysuria. The prevalence of BPH increases with age. In the USA, BPH affects approximately 70% of men 60–69 years old, 80% of those 70 years and older, and almost 90% by age 90 (5, 6).
Role of prostatic volume determination in BPH management
There are several subjective and objective clinical parameters to assess the presence and magnitude of BPH and lower urinary tract symptoms. The most common subjective assessment of lower urinary tract symptoms severity is the international prostatic symptom score index, a questionnaire consisting of seven questions designed to estimate the severity of irritative and obstructive voiding symptoms. Objective parameters include measurement of prostate volume, urinary flow rate, and postvoid residual bladder volume. While the correlation between prostate volume and lower urinary tract symptoms severity is imperfect, studies have shown that low peak urine flow rate and high postvoid residual volume are associated with prostate volumes above 30 mL (7). Similarly, a study found that males with prostate volumes over 50 mL were 3.5-fold more likely to have moderate-to-severe urinary symptoms (8). More importantly, it has been shown that prostates larger than 30 mL are significantly associated with acute urinary retention requiring catheterization, suggesting that prostate volume may be a predictor of more serious complications, such as renal injury and hydronephrosis, which can occur with untreated BPH (7).
In addition to assessing symptom severity and predicting complications, prostate volume is a useful factor in selecting appropriate treatments. BPH and lower urinary tract symptoms are commonly treated with two classes of medication, α-adrenergic receptor blockers and 5α-reductase inhibitors (5ARIs), or with surgical intervention. α-Adrenergic receptor blockers, such as doxazosin and tamsulosin, provide rapid symptom relief by reducing smooth muscle tension along the bladder neck, prostate, and urethra (9). The 5ARIs, which include finasteride and dutasteride, are antiandrogenic drugs that target the underlying disease process to reduce prostate size (9). Patients with larger prostates may benefit more from 5ARIs, whereas those with lower urinary tract symptoms and prostates <30 mL may benefit from α-adrenergic receptor blockers alone. When surgical options are considered, knowledge of prostate volume and configuration on imaging can assist clinicians in choosing transurethral prostate resection, minimally invasive surgery, or open prostatectomy.
In addition to total prostate volume, prostate zonal volumes are useful both in the clinical management and investigative studies of BPH. Studies using TRUS found that 5ARIs reduce total prostate volume by 17%–46% and transition zone volume by 7%–25% within the first year of therapy (10–12). While total prostate volume and transition zone volume dynamics in response to 5ARIs are widely accepted, there have been conflicting reports regarding the effects of 5ARIs on peripheral zone volume. Some studies demonstrated that 5ARIs selectively affect the transition zone, while sparing the peripheral zone of the prostate (13, 14). Tempany et al. (14) used 1.5 Tesla (T) MRI and found a larger reduction in the peripheral zone, although it was not statistically significant. Other longitudinal, double-blinded studies using volumetric assessment with TRUS found decreases in both peripheral zone volume and transition zone volume (10, 15, 16). Furthermore, one of these studies detected a significant positive correlation between transition zone index (i.e., the transition zone volume as a percentage of the whole prostate gland) and the change in prostate volume for patients on dutasteride (10). Thus, prostate segmentation not only allows clinicians to assess the apparent change in prostate volumes on medical therapy, it may also allow clinicians to predict which patients will respond to the medication, thus avoiding unsatisfactory outcomes and side effects.
Hand-held TRUS requires compression of the prostate to ensure adequate acoustic coupling between the probe and the prostate. To some extent this can be obviated with automated stepper devices that advance the probe in stepwise increments in the same plane. However, the degree of prostate distortion is highly operator-dependent. Indeed, a major problem with TRUS is its high intraobserver variability, estimated at −21% to +30% of total prostate volume and −18% to +18% of transition zone volume (17).
MRI has been shown to be more reliable in determining prostate volumes than TRUS. Furthermore, MRI allows more accurate differentiation and segmentation of the transition zone and peripheral zone (18–21). Our group had validated total prostate volume derived from image segmentation of prostate images obtained on a 3.0 T MRI with the weights of human radical prostatectomy specimens (22). The use of prostate imaging segmentation with high-resolution MRI allows the accurate assessment of drug-induced zonal prostate volume changes.
Prostate segmentation and volume measurement techniques
Ellipsoid formula
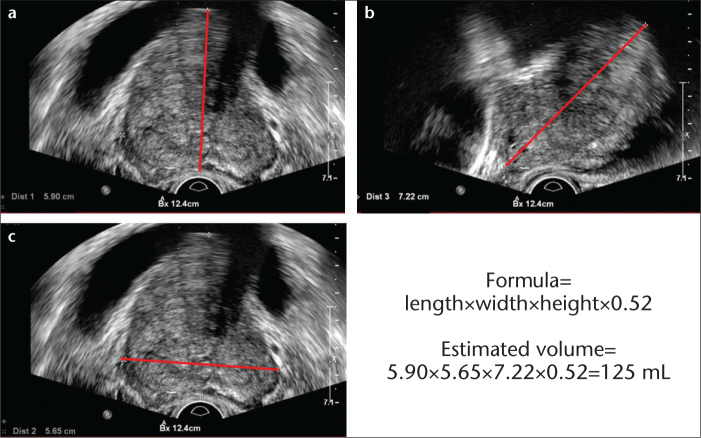
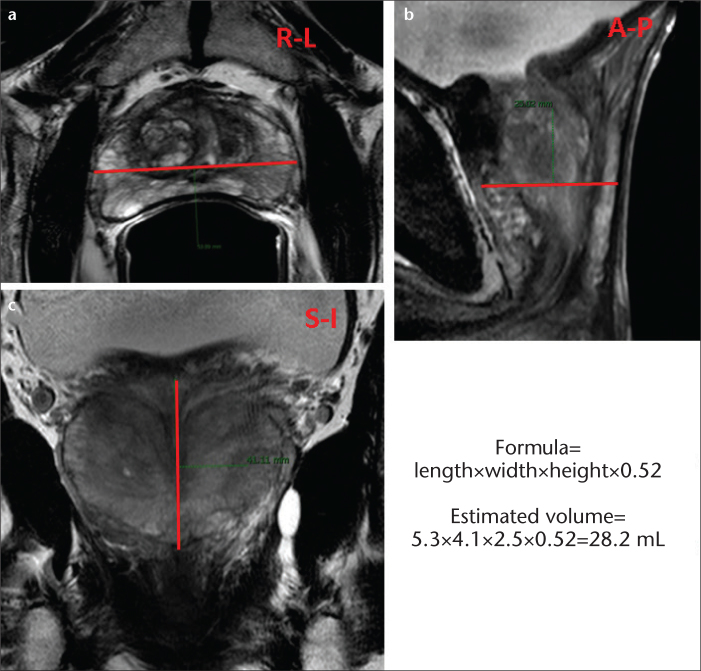
Accurate prostate volume measurement relies heavily on imaging. Estimates based on digital rectal examination are notoriously inaccurate. Currently, the two most common modalities for prostate imaging and volume measurement are TRUS and MRI (23). The ellipsoid model, which is the original and de facto standard method of calculating prostate volume, uses the formula: transverse diamete×antero-posterior diamete×length×0.52 and assumes that the prostate has a regular ellipsoid shape (24, 25). This relatively quick and simple technique can be applied to both ultrasonography and MRI (Figs. 1, 2). Lee and Chung (23) reported a correlation coefficient of 0.93 for prostate volume measurements by the ellipsoid method on MRI, compared with specimen volumes obtained from radical prostatectomy, and MacMahon et al. (26) reported a correlation coefficient of 0.87 for ultrasonography versus planimetry. However, the highly variable shape of the prostate, which is not typically a regular shape in most males, results in widely variable or outlier estimates of volume in individual cases that are not reflected in Pearson coefficient scores. Moreover, these eccentric volumes can be difficult to reproduce on serial imaging.
Figure 1. a–c.
Axial (a, c) and sagittal (b) transrectal US images. Ellipsoid prostate volume measurement on transrectal US image using the formula length×width×height×0.52.
Figure 2. a–c.
Ellipsoid prostate volume measurement on triplane axial (a), sagittal (b), coronal (c) T2-weighted MR images using the formula right-to-left (R–L) diamete×anterior-posterior (A–P) diamete×superior-inferior (S–I) diamete×0.52.
Manual planimetry
Planimetry of the prostate includes a subjective assessment of the prostate margin based on serial segmentation of planar images with dedicated image-processing software (26). This method produces more accurate results than the ellipsoid method, with a correlation coefficient of 0.93 reported on ultrasonography by Terris and Stamey (27). It can also be used with MRI. However, planimetry is much more time-consuming than the ellipsoid method, because it requires manual outlining of the prostate on each consecutive image and is rarely performed routinely (28, 29).
Semiautomated segmentation
To overcome the inefficiency and subjectivity of planimetry, semiautomated methods of prostate volume calculation have been developed. Automatic segmentation algorithms overcome the limitations imposed by the complexity of shapes and images through the use of shape and appearance models that serve to automatically detect the margin of the prostate (30). Automated procedures relieve radiologists of time-consuming manual segmentation, while maintaining high levels of accuracy and reproducibility, equal to or even greater than those of the manual method (31).
Until recently, however, no fully automated segmentation tool was available. The first automated algorithms were semiautomated and employed a priori knowledge of prostate location to generate a final prostate contour. In many instances, the segmentation can be initiated by contouring of the prostate on one or more of the MR images. This serves as a basis for estimating the contour(s) on additional slices. Other semiautomated methods make use of region-intensity based approaches in which the user “teaches” the algorithm what a prostate looks like and the algorithm finds tissue of similar intensity. Jia et al. (32) reported prostate volumes obtained with a semiautomated tool using necropsy volumes as the gold standard. Their method included a first step of manually circling inside the prostate as an initial “estimate” of the prostate boundary on each T1-weighted axial slice without a need for precision. Then, these circles were automatically evolved to the actual border of the prostate with a two-dimensional “boundary evolve” algorithm, in which a gradient magnitude filter was applied to determine the structure’s boundary. After copying the evolved contour to the axial T2-weighted MR data set, minor border adjustments and segmentation of the prostate from the rectum, which is difficult for most algorithms, were performed manually. They reported a correlation coefficient of 0.98 for prostate volume measured by this semiautomated method (32). Similarly, Vikal et al. (33) used a semiautomated approach that included manual initial selection of the approximate center of the prostate in the middle slice. This information was integrated with a priori knowledge of prostate shape and the contour was used as the initial estimate for the neighboring slices where the same steps were repeated. They reported Dice similarity coefficients (DSC, a measure of the similarity between manual and automatic segmentations) of 0.93, 0.80, and 0.86 for the method in the midsection, apex, and base of the gland, respectively. Although much more rapid than planimetry, semiautomated programs still require some manual user input for expert evaluation and editing of the algorithm’s contour estimates (33).
Fully automated segmentation
Fully automated prostate segmentation algorithms have been developed recently and they can be summarized as contour shape-based, region-based, and supervised and unsupervised classification techniques (34). Contour- and shape-based models use prostate boundary information for segmentation, whereas region based models use local intensity or statistics for segmentation and supervised and unsupervised models use features such as signal intensity on images or additional features, like filters, to separately classify the prostate and background regions (34). Technical details of these methods have been described extensively elsewhere and are beyond the scope of this review (34).
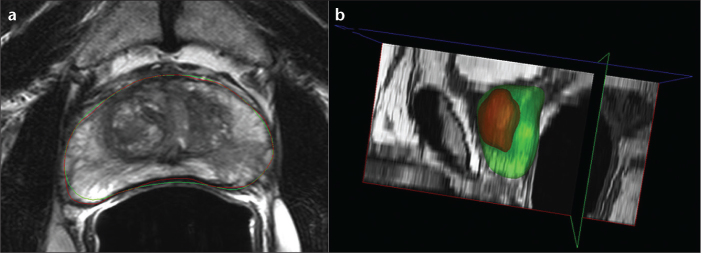
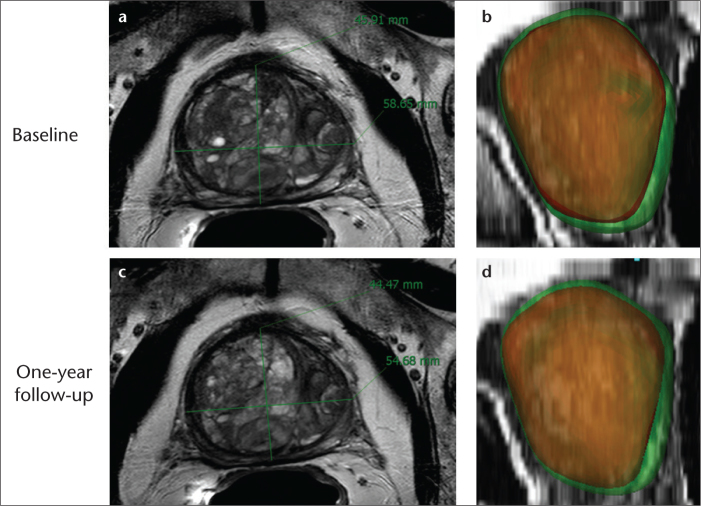
Automated prostate segmentation algorithms are under development. Makni et al. (35) combined a deformable model and a probabilistic framework to develop an automated prostate segmentation tool for MRI. Their technique included a statistical shape model as an a priori starting point, and gray-level distribution was modeled by fitting histogram modes with a Gaussian mixture. Then, Markov fields were used to introduce contextual information regarding voxels’ neighborhoods. Final labeling optimization was based on Bayesian a posteriori classification, estimated with an iterative conditional-mode algorithm. Their technique generated satisfactory results, with an overlap ratio of 0.83, and was both computationally feasible and efficient (35). Klein et al. (36) used a technique in which non-rigid registration of a set of prelabeled atlas images were used. In their model, each atlas image was nonrigidly registered with the target patient image and, subsequently, the deformed atlas-labeled images were fused to yield a single segmentation of the patient image. They reported a median DSC of 0.85 in 50 patients (36). Recently, Fotin et al. (37) used a normalized gradient field crosscorrelation method for automated prostate localization from T2-weighted MRI. This three-dimensional segmentation technique was validated on a dataset of over 500 T2-weighted prostate MR images, derived from two independent sets of cases of different origins. The method achieved mean localization errors of 4.06±0.33 mm on the first and 3.10±0.43 mm on the second test dataset, a remarkable result in view of the volume of the prostate (Figs. 3, 4) (37).
Figure 3. a, b.

Axial T2-weighted MR image (a) shows sample segmentation with manual planimetry (red) and automatically generated approaches (green). The three dimensional (3D) reconstructed MR image (b) shows the whole prostate gland (green) and transitional zone (red) 3D models generated from an automated segmentation approach.
Figure 4. a–d.
Clinical case of a patient with BPH on finasteride (5-α reductase inhibitor) therapy. Axial T2-weighted MR images show prostate gland at baseline volume of 99 mL (a) and after one year on therapy, prostate volume was reduced to 89 mL (10% reduction) (c). The 3D-reconstructed MR images generated from the automated segmentation approach show the whole gland (green) and transitional zone (red) at baseline (b) and after one year on therapy (d).
Conclusion
Applications of accurate prostate segmentation go beyond simple volume determinations, prostate-specific antigen density measurements, and follow-up of BPH patients. They extend to multimodal and multitime point image fusion, with implications for automated detection, biopsy, and image-guided therapy. Ideally, these images will then be integrated into a picture archiving and communication system for direct and permanent clinical access. Automatic segmentation methods promise to improve the reliability of prostate volume measurements and reduce tedious manual segmentation, while providing an excellent template on which to fuse other types of imaging for computer-aided diagnosis and interventional procedures.
Footnotes
Conflict of interest disclosure
The authors declared no conflicts of interest.
References
- 1.Matthews GJ, Motta J, Fracehia JA. The accuracy of transrectal ultrasound prostate volume estimation: clinical correlations. J Clin Ultrasound. 1996;24:501–505. doi: 10.1002/(SICI)1097-0096(199611/12)24:9<501::AID-JCU2>3.0.CO;2-R. [DOI] [PubMed] [Google Scholar]
- 2.Tewari A, Indudhara R, Shinohara K, et al. Comparison of transrectal ultrasound prostatic volume estimation with magnetic resonance imaging volume estimation and surgical specimen weight in patients with benign prostatic hyperplasia. J Clin Ultrasound. 1996;24:169–174. doi: 10.1002/(SICI)1097-0096(199605)24:4<169::AID-JCU2>3.0.CO;2-D. [DOI] [PubMed] [Google Scholar]
- 3.McNeal JE. Origin and evolution of benign prostatic enlargement. Invest Urol. 1978;15:340–345. [PubMed] [Google Scholar]
- 4.McNeal JE. Pathology of benign prostatic hyperplasia: insight into etiology. Urol Clin North Am. 1990;17:477–486. [PubMed] [Google Scholar]
- 5.Wei JT, Calhoun E, Jacobsen SJ. Urologic diseases in America project: benign prostatic hyperplasia. J Urol. 2005;173:1256–1261. doi: 10.1097/01.ju.0000155709.37840.fe. [DOI] [PubMed] [Google Scholar]
- 6.Berry SJ, Coffey DS, Walsh PC, et al. The development of human benign prostatic hyperplasia with age. J Urol. 1984;132:474–479. doi: 10.1016/s0022-5347(17)49698-4. [DOI] [PubMed] [Google Scholar]
- 7.Kolman C, Girman CJ, Jacobsen SJ, et al. Distribution of postvoid residual urine volume in randomly selected men. J Urol. 1999;16:122–127. [PubMed] [Google Scholar]
- 8.Girman CJ, Jacobsen SJ, Guess HA, et al. Natural history of prostatism: relationship among symptoms, prostate volume and peak urinary flow rate. J Urol. 1995;153:1510–1515. doi: 10.1016/s0022-5347(01)67448-2. [DOI] [PubMed] [Google Scholar]
- 9.Emberton M, Cornel EB, Bassi PF, Fourcade RO, Gómez JM, Castro R. Benign prostatic hyperplasia as a progressive disease: a guide to the risk factors and options for medical management. Int J Clin Pract. 2008;62:1076–1086. doi: 10.1111/j.1742-1241.2008.01785.x. [DOI] [PMC free article] [PubMed] [Google Scholar]
- 10.Marks LS, Roehrborn CG, Wolford E, Wilson TH. The effect of dutasteride on the peripheral and transition zones of the prostate and the value of the transition zone index in predicting treatment response. J Urol. 2007;177:1408–1413. doi: 10.1016/j.juro.2006.11.095. [DOI] [PubMed] [Google Scholar]
- 11.Kaplan SA, Roehrborn CG, McConnell JD, et al. Long-term treatment with finasteride results in a clinically significant reduction in total prostate volume compared to placebo over the full range of baseline prostate sizes in men enrolled in the MTOPS trial. J Urol. 2008;180:1030–1033. doi: 10.1016/j.juro.2008.05.004. [DOI] [PubMed] [Google Scholar]
- 12.Gormley GJ, Stoner E, Bruskewitz RC, et al. The effect of finasteride in men with benign prostatic hyperplasia. For the Finasteride Study Group. N Engl J Med. 1992;327:1185–1191. doi: 10.1056/NEJM199210223271701. [DOI] [PubMed] [Google Scholar]
- 13.Tewari A, Shinohara K, Narayan P. Transition zone volume and transition zone ratio: predictor of uroflow response to finasteride therapy in benign prostatic hyperplasia patients. Urology. 1995;45:258–265. doi: 10.1016/0090-4295(95)80015-8. [DOI] [PubMed] [Google Scholar]
- 14.Tempany CMC, Partin AW, Zerhouni EA, Zinreich SJ, Walsh PC. The influence of finasteride on the volume of the peripheral and periurethral zones of the prostate in men with benign prostatic hyperplasia. Prostate. 1993;22:39–42. doi: 10.1002/pros.2990220106. [DOI] [PubMed] [Google Scholar]
- 15.Marks LS, Partin AW, Gormley GJ, et al. Prostate tissue composition and response to finasteride in men with symptomatic benign prostatic hyperplasia. J Urol. 1997;157:2171–2178. [PubMed] [Google Scholar]
- 16.Marks LS, Partin AW, Dorey FJ, et al. Long-term effects of finasteride on prostate tissue composition. Urology. 1999;53:574–580. [PubMed] [Google Scholar]
- 17.Zlotta AR, Djavan B, Damoun M, et al. The importance of measuring the prostatic transition zone: an anatomical and radiological study. BJU International. 1999;84:661–666. doi: 10.1046/j.1464-410x.1999.00214.x. [DOI] [PubMed] [Google Scholar]
- 18.Sommer FG, McNeil JE, Carol CL. MR depiction of zonal anatomy of the prostate at 1.5T. J Comput Assist Tomogr. 1986;10:983–989. doi: 10.1097/00004728-198611000-00017. [DOI] [PubMed] [Google Scholar]
- 19.Hricak H, Doomes GC, McNeil JE, et al. MR imaging of the prostate gland: normal anatomy. AJR Am J Roentgenol. 1987;148:51–58. doi: 10.2214/ajr.148.1.51. [DOI] [PubMed] [Google Scholar]
- 20.Türkbey B, Bernardo M, Merino MJ, Wood BJ, Pinto PA, Choyke PL. MRI of localized prostate cancer: coming of age in the PSA era. Diagn Interv Radiol. 2012;18:34–45. doi: 10.4261/1305-3825.DIR.4478-11.1. [DOI] [PMC free article] [PubMed] [Google Scholar]
- 21.Soylu FN, Eggener S, Oto A. Local staging of prostate cancer with MRI. Diagn Interv Radiol. 2012;18:365–373. doi: 10.4261/1305-3825.DIR.4970-11.2. [DOI] [PubMed] [Google Scholar]
- 22.Turkbey B, Huang R, Srinivas V, et al. Age-related in prostate zonal volumes as measured by high-resolution magnetic resonance imaging (MRI): a cross-sectional study in over 500 patients. BJU Int. 2012;110:1642–1647. doi: 10.1111/j.1464-410X.2012.11469.x. [DOI] [PMC free article] [PubMed] [Google Scholar]
- 23.Lee JS, Chung BH. Transrectal ultrasound versus magnetic resonance imaging in the estimation of prostate volume as compared with radical prostatectomy specimens. Urol Int. 2007;78:323–327. doi: 10.1159/000100836. [DOI] [PubMed] [Google Scholar]
- 24.Wasserman NF. Benign prostatic hyperplasia: a review and ultrasound classification. Radiol Clin North Am. 2006;44:689–710. doi: 10.1016/j.rcl.2006.07.005. [DOI] [PubMed] [Google Scholar]
- 25.Tokgöz Ö, Tokgöz H, Ünal I, et al. Diagnostic values of detrusor wall thickness, postvoid residual urine, and prostate volume to evaluate lower urinary tract symptoms in men. Diagn Interv Radiol. 2012;18:277–281. doi: 10.4261/1305-3825.DIR.4847-11.1. [DOI] [PubMed] [Google Scholar]
- 26.MacMahon PJ, Kennedy AM, Murphy DT, et al. Modified prostate volume algorithm improves transrectal US volume estimation in men presenting for prostate brachytherapy. Radiology. 2009;250:273–280. doi: 10.1148/radiol.2501080290. [DOI] [PubMed] [Google Scholar]
- 27.Terris MK, Stamey TA. Determination of prostate volume by transrectal ultra-sound. J Urol. 1991;145:984–987. doi: 10.1016/s0022-5347(17)38508-7. [DOI] [PubMed] [Google Scholar]
- 28.al-Rimawi M, Griffiths DJ, Boake RC, Mador DR, Johnson MA. Transrectal ultra-sound versus magnetic resonance imaging in the estimation of prostatic volume. Br J Urol. 1994;74:596–600. doi: 10.1111/j.1464-410x.1994.tb09190.x. [DOI] [PubMed] [Google Scholar]
- 29.Aarnink RG, De La Rosette JJ, Debruyne FM, Wijkstra H. Reproducibility of prostate volume measurements from transrectal ultrasonography by an automated and a manual technique. Br J Urol. 1996;78:219–223. doi: 10.1046/j.1464-410x.1996.08213.x. [DOI] [PubMed] [Google Scholar]
- 30.Martin S, Troccaz J, Daanen V. Automated segmentation of the prostate in 3D MR images using a probabilistic atlas and a spatially constrained deformable model. Med Phys. 2010;37:1579–1590. doi: 10.1118/1.3315367. [DOI] [PubMed] [Google Scholar]
- 31.Pasquier D, Lacornerie T, Vermandel M, et al. Automatic segmentation of pelvic structures from magnetic resonance images for prostate cancer radiotherapy. Int J Radiat Oncol Biol Phys. 2007;68:592–600. doi: 10.1016/j.ijrobp.2007.02.005. [DOI] [PubMed] [Google Scholar]
- 32.Jia G, Baudendistel KT, von Tengg-Kobligk H, et al. Assessing prostate volume by magnetic resonance imaging: a comparison of different measurement approaches for organ volume analysis. Invest Radiol. 2005;40:243–248. doi: 10.1097/01.rli.0000156312.24604.7c. [DOI] [PubMed] [Google Scholar]
- 33.Vikal S, Haker S, Tempany C, Fichtinger G. Prostate contouring in MRI guided biopsy. Proc SPIE. 2009;7259:72594A. doi: 10.1117/12.812433. [DOI] [PMC free article] [PubMed] [Google Scholar]
- 34.Ghose S, Oliver A, Martí R, et al. A survey of prostate segmentation methodologies in ultrasound, magnetic resonance and computed tomography images. Comput Methods Programs Biomed. 2012;108:262–287. doi: 10.1016/j.cmpb.2012.04.006. [DOI] [PubMed] [Google Scholar]
- 35.Makni N, Puech P, Lopes R, Dewalle AS, Colot O, Betrouni N. Combining a deformable model and a probabilistic framework for an automatic 3D segmentation of prostate on MRI. Int J Comput Assist Radiol Surg. 2009;4:181–188. doi: 10.1007/s11548-008-0281-y. [DOI] [PubMed] [Google Scholar]
- 36.Klein S, van der Heide UA, Lips IM, et al. Automatic segmentation of the prostate in 3D MR images by atlas matching using localized mutual information. Med Phys. 2008;35:1407–1417. doi: 10.1118/1.2842076. [DOI] [PubMed] [Google Scholar]
- 37.Fotin SV, Yin Y, Periaswamy S, et al. Normalized gradient fields cross-correlation for automated detection of prostate in magnetic resonance images. Proc SPIE. 2012;8314:83140V. [Google Scholar]


