

Abstract
Objectives. We examined whether Supplemental Nutrition Assistance Program (SNAP) participation changes associations between food insecurity, dietary quality, and weight among US adults.
Methods. We analyzed adult dietary intake data (n = 8333) from the 2003 to 2010 National Health and Nutrition Examination Survey. Bivariate and multivariable methods assessed associations of SNAP participation and 4 levels of food security with diet and weight. Measures of dietary quality were the Healthy Eating Index 2010, total caloric intake, empty calories, and solid fat; weight measures were body mass index (BMI), overweight, and obesity.
Results. SNAP participants with marginal food security had lower BMI (1.83 kg/m2; P < .01) and lower probability of obesity (9 percentage points; P < .05). SNAP participants with marginal (3.46 points; P < .01), low (1.98 points; P < .05), and very low (3.84 points; P < .01) food security had better diets, as illustrated by the Healthy Eating Index. Associations between SNAP participation and improved diet and weight were stronger among Whites than Blacks and Hispanics.
Conclusions. Our research highlights the role of SNAP in helping individuals who are at risk for food insecurity to obtain a healthier diet and better weight status.
Food insecurity, broadly defined as having limited access to adequate food,1 is associated with increased stress levels and reduced overall well-being.2 In addition, food insecurity has been shown to diminish dietary quality and affect nutritional intake and has been associated with chronic morbidity (e.g., type 2 diabetes, hypertension) and weight gain.1,3–5 In 2012, approximately 14.5% of US households (17.6 million households) experienced food insecurity, of whom 5.7% (7.0 million households) experienced very low food security (i.e., reduction in food intake).6 The Supplemental Nutrition Assistance Program (SNAP), formerly known as food stamps, is the largest government assistance program in the United States and seeks to alleviate food insecurity in US households.7 SNAP has the potential to mitigate the adverse effects of food insecurity on health outcomes not only through attenuating food insecurity but also by enhancing the dietary quality of its participants.8,9
Although cross-sectional studies have found no significant differences in food insecurity levels between SNAP participants and nonparticipants,10,11 in a longitudinal study, Nord observed a 28% reduction in the odds for very low food security among households that remained on SNAP throughout the year relative to those who left before the last 30 days of the year.12 In addition, studies by Leung and Villamor13 and Webb et al.14 found that independent of food insecurity, SNAP participation is associated with the increased likelihood of obesity, and other studies have observed lower dietary quality specifically among SNAP participants.15,16 Kreider et al. used partial identification bounding methods to take into account the endogenous selection and misreporting of SNAP enrollment and found that SNAP reduced the prevalence of food insecurity, poor general health, and obesity among children.17
Thus, the interrelationships among SNAP participation, food insecurity, dietary quality, and weight status warrant further investigation to inform SNAP programming, policy, and outreach to ultimately improve the health and well-being of SNAP participants. We explored these relationships in data from the National Health and Nutrition Examination Survey (NHANES) over multiple years. We aimed to determine mitigating effects SNAP participation might have on the association of food insecurity with dietary quality and obesity among a nationally representative sample of US adults.
METHODS
The NHANES is a multistage, cross-sectional, nationally representative survey conducted by the National Center for Health Statistics to explore the health and nutritional status of US children and adults.18 Our participants came from 4 waves: 2003 to 2004, 2005 to 2006, 2007 to 2008, and 2009 to 2010. The NHANES collects information on demographic and socioeconomic characteristics and health from an in-home questionnaire, as well as obtaining dietary data and medical and physiological measurements and performing laboratory tests and a physical examination in mobile examination centers.18
We focused on participants with family income less than 200% of the federal poverty level in 2003 to 2010 to reduce residual confounding in the sample, especially between the high-income food security group and other groups. We did not limit our sample to SNAP-eligible participants with incomes lower than 130% of the federal poverty level because we aimed at capturing both the marginal food security and food insecurity population, many of whom are not eligible for SNAP.6,19 Thus our sample consisted of 8333 nonpregnant adults aged 20 years and older who had completed day 1 dietary interviews.
Measures
We determined participation in the SNAP program by an affirmative response to the question, “In the last 12 months, did [you, or any member of your household] receive food stamp benefits?”18 We derived 4 levels of food security from responses to the NHANES Food Security Survey Module questionnaires, details of which are available online.20 Households with high food security reported no food access problems or limitations; households with marginal food security may have had anxiety over food sufficiency or shortage of food in the house; households with low food security generally reported reduced quality, variety, or desirability of diet without changes in diet or food intake; and households with very low food security generally reported multiple indications of disrupted eating patterns and reduced food intake. We considered households in the high and marginal categories to be food secure.
Our key outcome variables were (1) diet (the Healthy Eating Index 2010 [HEI-2010]21 and intake of added sugar, solid fat, empty calories, and total calories) and (2) weight (body mass index [BMI], defined as weight in kilograms divided by the square of height in meters; overweight; and obesity). From the first-day dietary recall data (24 hours), we computed HEI-2010 as well as other dietary indicators, such as empty calorie, solid fat, and added-sugar intake, with National Cancer Institute methodology.22 We used HEI-2010, a tool that aims to determine compliance with the 2010 Dietary Guidelines for Americans, to assess overall dietary quality.21 We calculated BMI with the standard formula and objectively measured height and weight. We used World Health Organization criteria to categorize participants’ BMI as underweight (< 18.5 kg/m2), normal weight (18.5–< 25 kg/m2), overweight (≥ 25–< 30 kg/m2), or obese (≥ 30 kg/m2).23
Statistical Analysis
We used the first-day 24-hour dietary recall data to document participants’ sociodemographic characteristics by participation status in the SNAP program. We also examined the differences in HEI-2010 score and intake of added sugar, solid fat, empty calories, and total calories among those with full food security versus all others (i.e., participants with marginal, low, and very low food security). In addition, we examined the differences in percentage of underweight, overweight, and obesity and in BMI between these 2 groups.
To examine the combined effect of SNAP participation and food security, we estimated an ordinary least squares model with the interaction coefficient of SNAP and food security. Our formula was
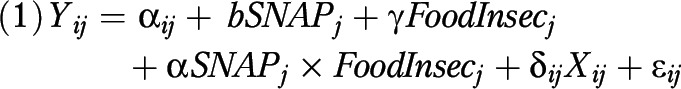 |
Where  , the dependent variables, denoted outcomes of individual i in household j; αij was the intercept; b was a parameter estimate for the baseline difference between SNAP participants and SNAP nonparticipants; and γ was an estimate for the difference between 4 levels of food security. The main parameter of interest, α, was an estimate of the cross-level interactions of a household’s SNAP status and food security.
Other control covariates (Xij) were age; gender; race/ethnicity (non-Hispanic White, non-Hispanic Black, Hispanic, other); education (< high school, high school, some college, ≥ college); marital status (married, never married, divorced or separated, widowed); poverty-to-income ratio; Women, Infants, and Children program participation in the past year; health insurance status (insured or not); employment status (employed or not); whether the survey was completed on a weekday or weekend24; and interview wave (2003–2004, 2005–2006, 2007–2008, 2009–2010).
We conducted all statistical analyses with STATA version 1325 and accounted for the NHANES complex, multistage probability sampling design of households and individuals to enable nationally representative estimates.26 Because individuals in the mobile examination centers sample provided the dietary recall data, we used the centers’ sample weights (provided by NHANES) in all analyses. We computed HEI-2010 scores with SAS software version 9.3.27
RESULTS
The characteristics of the study population are shown in Table 1. The study sample consisted of 8333 adults. Participants had a mean age of 45.5 years; 55.4% were women, 55.9% were non-Hispanic Whites, 16.4% were non-Hispanic Blacks, 21.9% were Hispanics, 51.1% were married, 64.5% had health insurance, and 49.2% were employed. Food security was high in 59.1% of respondents' households, marginal in 13.2%, low in 17.2%, and very low in 10.5%.
TABLE 1—
Summary Statistics of Low-Income Adults: National Health and Nutrition Examination Survey, 2003–2010
| Variable | Full Sample (n = 8333) |
| Women, % | 55.4 |
| Age, y, mean | 45.5 |
| SNAP participation, % | 27.3 |
| Household food security,a % | |
| Full | 59.1 |
| Marginal | 13.2 |
| Low | 17.2 |
| Very low | 10.5 |
| Race/ethnicity, % | |
| Non-Hispanic White | 55.9 |
| Non-Hispanic Black | 16.4 |
| Hispanic | 21.9 |
| Other | 5.9 |
| Marital status, % | |
| Married | 51.1 |
| Widowed | 9.6 |
| Divorced/separated | 17.1 |
| Never married | 22.2 |
| Education, % | |
| < high school | 35.7 |
| High school | 28.3 |
| Some college | 26.6 |
| ≥ college | 9.4 |
| Health insurance, % | 64.5 |
| Currently employed, % | 49.2 |
| Received WIC benefits in past year, % | 21.1 |
| Poverty-to-income ratio, FPL, % | |
| 0–50 | 12.3 |
| 51–100 | 27.1 |
| 101–130 | 20.4 |
| 131–200 | 40.2 |
| Household size, mean | 3.3 |
| Survey on weekend, % | 39.0 |
| Wave | |
| 1 (2003–2004) | 24.1 |
| 2 (2005–2006) | 23.0 |
| 3 (2007–2008) | 26.2 |
| 4 (2009–2010) | 26.7 |
Note. FPL = federal poverty level; SNAP = Supplemental Nutrition Assistance Program; WIC = Women, Infants, and Children program. Results take survey weights into account. Respondents were aged 20 years or older and had family income under 200% of the FPL.
Respondents from households with children younger than 18 years were asked 18 questions from the US Food Security Survey Module; respondents from households without children were asked 10 questions. The food insecurity variable, with 4 response levels, was derived from affirmative responses. Household full food security = zero affirmative responses; marginal food security = 1–2 affirmative responses; low food security = 3–5 affirmative responses for households without children 3–7 affirmative responses for households with children; very low food security = 6–10 affirmative responses for households without children and 8–18 affirmative responses for households with children.
The bivariate relationship of food security status to dietary quality and weight status is presented in Table 2. Participants with any level of food insecurity had a significantly lower HEI-2010 score than those with full food security (43.7 vs 46.6), higher intake of added sugar (22.0 vs 18.7 teaspoons), and higher intake of empty calories (787.9 vs 731.5 kilocalories; P < .05 for all). Furthermore, individuals living in households without food security had significantly higher BMIs and were likelier to be obese than those with food security (38.4% vs 33.7%; P < .01). However, we observed no significant differences in solid fat consumption or the probability of being underweight.
TABLE 2—
Food Security, Dietary Quality, and Weight Status Among US Low-Income Adults: National Health and Nutrition Examination Survey, 2003–2010
| Full Sample (n = 8333), No. or % | Full Food Security (n = 4645), No. or % | Food Insecurity (n = 3688), No. or % | Pa | |
| Dietary quality | ||||
| Healthy Eating Index 2010, total score | 45.4 | 46.6 | 43.7 | < .001 |
| Added sugar, teaspoons | 20.1 | 18.7 | 22.0 | < .001 |
| Solid fat, g | 399.5 | 398.1 | 401.5 | .768 |
| Empty calories, kcal | 754.6 | 731.5 | 787.9 | < .001 |
| Total calories, kcal | 2128.8 | 2103.0 | 2166.2 | .084 |
| Weight (BMI) | ||||
| Continuous | 28.8 | 28.5 | 29.2 | < .001 |
| Underweight (≤ 18.5 kg/m2) | 2.3 | 2.3 | 2.4 | .607 |
| Overweight (≤ 25–< 30 kg/m2) | 31.6 | 32.6 | 30.2 | .178 |
| Obese (≥ 30 kg/m2) | 35.6 | 33.7 | 38.4 | < .001 |
Note. BMI = body mass index. Results take survey weights into account. Not full food security group includes people living in households with marginal food security, low food security and very low food security.
Difference between full food security and any category of food insecurity derived from Student t test.
The association of SNAP participation and food security status with dietary quality and weight status among low-income respondents is presented in Table 3. SNAP participants had a poorer nutrient profile (lower HEI-2010 score, higher consumption of added sugar, solid fat, and empty calories) than nonparticipants. HEI-2010 scores were lowest among participants who reported living in households with very low food security (2.59 points lower than in the reference group, participants with high food security), followed by those with marginal (−2.27 points), and low (−1.63 points) food security.
TABLE 3—
Multivariable Regression Analysis on Associations of Supplemental Nutrition Assistance Program Participation and Food Insecurity With Dietary Quality and Weight Status Among US Low-Income Adults: National Health and Nutrition Examination Survey, 2003–2010
| Dietary Quality |
Weight Status |
||||||
| Healthy Eating Index (n = 8333), b (SE) | Added Sugar (n = 8333), b (SE) | Solid Fat (n = 8333), b (SE) | Empty Calories (n = 8333), b (SE) | BMI (continuous; n = 8174), b (SE) | Overweight (n = 8174), b (SE) | Obese (n = 8174), b (SE) | |
| SNAP | −3.18** (0.53) | 2.53** (0.74) | 18.65 (11.70) | 53.34** (19.70) | 2.10** (0.28) | −0.03 (0.02) | 0.12** (0.02) |
| Household food security | |||||||
| Marginal | −2.27** (0.55) | 0.48 (0.77) | −14.31 (12.10) | −15.79 (20.36) | 0.63* (0.29) | −0.01 (0.02) | 0.04* (0.02) |
| Low | −1.63** (0.53) | 2.35** (0.73) | −3.19 (11.52) | 17.44 (19.39) | 0.47 (0.28) | −0.03 (0.02) | 0.04* (0.02) |
| Very low | −2.59** (0.67) | 4.94** (0.94) | 13.31 (14.77) | 102.48** (24.87) | 1.02** (0.35) | −0.02 (0.02) | 0.05* (0.02) |
| SNAP × marginal food security | 3.46** (0.99) | −1.42 (1.37) | 15.84 (21.64) | 0.54 (36.43) | −1.83** (0.52) | 0.00 (0.03) | −0.09* (0.03) |
| SNAP × low food security | 1.98* (0.88) | −3.88** (1.22) | −21.50 (19.36) | −67.56* (32.58) | −0.98* (0.46) | 0.00 (0.03) | −0.05 (0.03) |
| SNAP × very low food security | 3.84** (1.04) | −2.99* (1.44) | −11.59 (22.76) | −65.24 (38.32) | −1.17* (0.55) | 0.02 (0.04) | −0.06 (0.04) |
Note. BMI = body mass index; FPL = federal poverty level; SNAP = Supplemental Nutrition Assistance Program; WIC = Women, Infants, and Children program. Respondents were aged 20 years or older and had family income under 200% of the FPL. Values are coefficients derived from ordinary least squares regressions. Dependent variables were healthy eating index (maximum score = 100), added sugar (teaspoons), solid fat (grams), empty calories (kilocalories), BMI (continuous value), overweight (dummy variable), and obesity (dummy variable). These dependent variables were regressed on variables indicating SNAP participation, households’ food security categories (dummy variables), and SNAP participation interacted with food security categories. Control variables were age, race/ethnicity, income (via poverty income ratio groups), marital status, education, insurance status, WIC participation, and employment status. Results take survey weights into account.
*P < .05; **P < .01.
Table 3 also shows the interaction between SNAP participation and food security (i.e., whether SNAP participation may change the associations between food insecurity, dietary quality, and weight status among US adults). Participation in SNAP was associated with higher HEI-2010 scores (better nutrient profile) among individuals in households with marginal (+3.46 points), low (+1.98 points), and very low (+3.84 points) food security than among respondents with corresponding food insecurity who did not receive SNAP benefits. For participants with low food security, participating in SNAP was only associated with lower added-sugar (−3.88 teaspoons) and empty calorie (−67.56 kcal) intake. Although SNAP participants and respondents experiencing food insecurity each independently had a higher BMI and higher probability of being obese, the combined association of SNAP participation and food insecurity appeared to decrease BMI across all 3 food-insecure groups and reduce the likelihood of obesity among participants with marginal food security (9 percentage points).
Table 4 presents the associations of SNAP participation and food security with dietary quality and weight status, stratified by race/ethnicity. These results indicated that SNAP participation had limited effect on dietary quality and weight status among food-insecure non-Hispanic Black adults. By contrast, SNAP participation among food-insecure non-Hispanic Whites was associated with a higher HEI-2010 score for respondents with marginal (+5.29 points), low (+3.92 points), and very low (+4.83 points) food security as well as with lower overall BMI among participants with marginal (−2.59 kg/m2) and very low (−2.03 kg/m2) food security. Among Hispanic adults, SNAP participation was related to lower added-sugar consumption (−3.15 teaspoons) lower BMI (−1.54 kg/m2), and lower likelihood of obesity (−12 percentage points) among the marginal food security group.
TABLE 4—
Multivariable Regression Analysis on Racial/Ethnic Differences in Associations of Supplemental Nutrition Assistance Program Participation and Food Insecurity With Dietary Quality and Weight Status Among US Low-Income Adults: National Health and Nutrition Examination Survey, 2003–2010
| Dietary Quality |
Weight Status |
||||||
| Healthy Eating Index, b (SE) | Added Sugar, b (SE) | Solid Fat, b (SE) | Empty Calories, b (SE) | BMI, b (SE) | Overweight, b (SE) | Obese, b (SE) | |
| Non-Hispanic Blacks (n = 1768) | |||||||
| SNAP × marginal food security | −0.29 (1.79) | −2.85 (2.50) | −22.08 (41.81) | −33.41 (69.78) | −0.69 (1.15) | 0.03 (0.06) | −0.06 (0.07) |
| SNAP × low food security | 0.00 (1.67) | −2.13 (2.33) | 22.61 (38.85) | −16.69 (64.84) | −0.55 (1.07) | 0.05 (0.06) | −0.08 (0.06) |
| SNAP × very low food security | 3.04 (1.90) | −2.45 (2.65) | −1.48 (44.34) | −9.86 (74.01) | −0.39 (1.22) | 0.07 (0.07) | −0.06 (0.07) |
| Non-Hispanic Whites (n = 3398) | |||||||
| SNAP × marginal food security | 5.29** (1.71) | 1.55 (2.55) | 29.15 (37.54) | 74.62 (64.89) | −2.59** (0.88) | −0.06 (0.06) | −0.08 (0.06) |
| SNAP × low food security | 3.92* (1.53) | −7.93** (2.29) | −34.38 (33.69) | −143.90* (58.23) | −1.07 (0.79) | −0.07 (0.05) | −0.00 (0.05) |
| SNAP × very low food security | 4.83** (1.76) | −5.01 (2.63) | −37.63 (38.73) | −127.06 (66.94) | −2.03* (0.91) | 0.04 (0.06) | −0.09 (0.06) |
| Hispanics (n = 2806) | |||||||
| SNAP × marginal food security | 2.55 (1.60) | −3.15 (1.73) | 48.45 (33.16) | −34.12 (50.81) | −1.54* (0.72) | 0.14* (0.06) | −0.12* (0.06) |
| SNAP × low food security | 1.53 (1.42) | −1.26 (1.53) | −36.13 (29.48) | −38.27 (45.17) | −0.64 (0.64) | 0.06 (0.05) | −0.05 (0.05) |
| SNAP × very low food security | 1.43 (1.78) | −1.31 (1.93) | 3.25 (37.01) | −52.44 (56.71) | −0.24 (0.80) | −0.01 (0.07) | −0.01 (0.06) |
Note. FPL = federal poverty level; SNAP = Supplemental Nutrition Assistance Program; WIC = Women, Infants, and Children program. Respondents were aged 20 years or older and had family income under 200% of the FPL. Values are coefficients derived from ordinary least squares regressions. Dependent variables were healthy eating index (maximum score = 100), added sugar (teaspoons), solid fat (grams), empty calories (kilocalories), BMI (continuous value), overweight (dummy variable), and obesity (dummy variable). These dependent variables were regressed on variables indicating SNAP participation, households’ food security categories (dummy variables), and SNAP participation interacted with food security categories. Control variables were age, race/ethnicity, income (via poverty income ratio groups), marital status, education, insurance status, WIC participation, and employment status. Results take survey weights into account.
*P < .05; **P < .01.
DISCUSSION
We analyzed nationally representative data to determine whether SNAP participation modified the associations between food insecurity and individuals’ dietary quality and weight. Consistent with the literature, we found that food insecurity and SNAP participation, independently, were associated with lower dietary quality and a higher prevalence of obesity among adults.15,16 In addition, we augmented previous research with our finding that SNAP participation among those who do not have full food security might protect against a less healthful diet and obesity. Specifically, we found that the interaction between SNAP participation and marginal, low, or very low food security was associated with higher dietary quality and lower BMI. The interaction between SNAP participation and food insecurity was significantly associated with a lower likelihood of obesity only among the marginal food security group. This result aligns with Hanson et al., who studied the interaction between food insecurity, marital status, and body weight and found that food insecurity was related to a greater likelihood of obesity among married women with marginal food security.28
Because the recession of 2007 to 2009 was associated with a record high rate of job loss, low rate of reemployment, and substantial earnings losses,29 the population of persons temporarily experiencing marginal food security is expected to grow.30 SNAP could play a prominent role in ensuring that this population has the necessary resources to obtain a nutritionally adequate diet during difficult times.31 On the other hand, it is important to understand the reasons some participants are still unable to consume healthy food, whether it is because of inadequate SNAP benefit, insufficient time to shop for and prepare nutritious meals, or lack of nutrition knowledge and budgeting skills.
Our results also showed that adults without full food security had a higher intake of total calories, added sugar, and empty calories than those with full food security. Research shows that food insecurity, often a cyclic phenomenon, is associated with preferences for energy-dense foods, because adults who anticipate future food scarcity often overconsume when food is available.32 Moreover, food-insecure persons, who are often low income, may be hesitant to purchase nutrient-rich foods such as fruits and vegetables, which cost more per calorie than energy-dense foods with minimal nutritional values.33–35 Those who experience food insecurity may also not have the means to travel to buy food frequently and may opt to purchase nonperishable or canned products or energy-dense foods that are less healthy, yet less costly.36
Our subgroup analysis revealed that SNAP might affect racial/ethnic groups differentially: interactions between SNAP participation and food insecurity benefited dietary quality and weight status among Whites (all food insecurity groups) to a much greater extent than among Blacks. Among Hispanics, SNAP participation was associated with improved diet quality and weight status only in households with marginal food security.
One possible explanation of SNAP's differential modification of the association of food insecurity to dietary intake and weight status is neighborhood disparities in access to healthy food.37 Although low-income Whites tend to live in neighborhoods with other socioeconomic groups, low-income Blacks and Hispanics often live in segregated neighborhoods, especially in inner cities.38 Studies have found that residents of mixed-race or solely Black neighborhoods (regardless of income) are less likely than those in predominantly White communities to have access to healthy food choices,39 even if they have SNAP benefits.37 Many studies have assessed food deserts (low-income areas with limited access to fresh, healthy, and affordable food)40,41 and policies, such as the Healthy Food Financing Initiative, that have been developed to address these inequities.42 Furthermore, dietary intake disparities may turn into discrepancies in the incidence and management of obesity, hypertension, diabetes, and other diet-sensitive chronic diseases.4,32 Thus, further research is needed to better understand why and how government nutrition assistance programs such as SNAP can affect varying food-insecure populations differently and to assess the possible solutions.
The Department of Agriculture has continued to make improvements to the SNAP-Education (SNAP-Ed) program, specifically to enhance the quality of SNAP participants' diets.16,43,44 The main aim of SNAP-Ed is to improve the likelihood that SNAP participants will make healthier food choices within a limited budget.43 Research shows that nutrition education programs can lead to healthier food choices among low-income households participating in SNAP,45 and thus SNAP-Ed could aid SNAP participants in meeting the challenge of consuming a healthful diet on a limited budget.46,47 In addition, SNAP-Ed interventions have begun addressing environmental factors affecting dietary intake, such as providing access to more healthful foods (e.g., fruits and vegetables) in local corner or convenience stores, which are more prevalent in low-income neighborhoods.48
Our findings are consistent with the literature suggesting that racial/ethnic groups may differ in taking advantage of government assistance programs, so interventions encouraging increasing utilization of SNAP and SNAP-Ed and incorporating promotion of more healthful food consumption should be tailored to ethnic minority subgroups. These programs will help not only food-insecure populations, but also the marginally food secure, to achieve a more healthful diet and consequently improve health outcomes and well-being.
Limitations
As a self-reported dietary recall data set, NHANES may be prone to overestimation of portion size and dietary intake and may not represent longer-term dietary intake patterns.49–51 In addition, we could not establish a causal relationship because of the cross-sectional nature of the data. Furthermore, we could not control for self-selection into SNAP, which could have been affected by such unobserved factors as personal preferences and underlying health conditions. Therefore, our identification strategy, similar to many studies in the literature,11 did not permit us to identify the causal effects of SNAP participation on health behaviors and outcomes.
Our results were derived from self-reported food security and SNAP participation status, which may reflect an individual’s own perception rather than the actual situation, and the reported numbers were subject to possible measurement error (e.g., misreporting or misclassification bias).52 For example, weight status may influence reported food insecurity: obese individuals may be more likely to report food insecurity because of their habits and perceptions about food consumption.28,53 However, although our measure of food insecurity relied on self-report,6,17 it adhered to the Department of Agriculture classification, which is regarded as the gold standard.3,6 Future research should aim to enhance understanding of the interrelationship of SNAP and food insecurity with health outcomes and account for both selection bias and measurement error, as in a few works on related topics.17,54
Conclusions
We found that among the food-insecure population, SNAP participation appears to buffer against poor dietary quality and obesity, particularly among non-Hispanic Whites and marginally food-secure Hispanics. Most important, our research highlights the role that SNAP may play in helping individuals who are at risk for food insecurity to obtain a healthful diet and better weight status.
SNAP, food insecurity, obesity, dietary patterns, food availability and access, and other factors should be considered together rather than separately, because these factors may interact in a complex relationship.
Human Participant Protection
No protocol approval was required because the study used de-identified, publicly available data.
References
- 1. US Dept of Agriculture, Economic Research Service. Definitions of food security. 2014. Available at: http://www.ers.usda.gov/topics/food-nutrition-assistance/food-security-in-the-us/definitions-of-food-security.aspx#.U7VjvPldUSV. Accessed July 3, 2014.
- 2.Holben DH American Dietetic Association. Position of the American Dietetic Association: food insecurity in the United States. J Am Diet Assoc. 2010;110(9):1368–1377. doi: 10.1016/j.jada.2010.07.015. [DOI] [PubMed] [Google Scholar]
- 3.Coleman-Jensen A, Nord M, Andrews M, Carlson S. Household food security in the United States in 2010. 2011. Available at: http://ssrn.com/abstract=2116606 or http://dx.doi.org. Accessed July 3, 2014.
- 4.Seligman HK, Laraia BA, Kushel MB. Food insecurity is associated with chronic disease among low-income NHANES participants. J Nutr. 2010;140(2):304–310. doi: 10.3945/jn.109.112573. [DOI] [PMC free article] [PubMed] [Google Scholar]
- 5.Laraia BA. Food insecurity and chronic disease. Adv Nutr. 2013;4(2):203–212. doi: 10.3945/an.112.003277. [DOI] [PMC free article] [PubMed] [Google Scholar]
- 6.Coleman-Jensen A, Nord M, Singh A. Household Food Security in the United States in 2012. Washington, DC: US Dept of Agriculture, Economic Research Service; 2013. ERR-155. [Google Scholar]
- 7. US Dept of Agriculture. Supplemental Nutrition Assistance Program (SNAP). 2013. Available at: http://www.fns.usda.gov/snap. Accessed July 10, 2014.
- 8.Larson NI, Story MT. Food insecurity and weight status among U.S. children and families: a review of the literature. Am J Prev Med. 2011;40(2):166–173. doi: 10.1016/j.amepre.2010.10.028. [DOI] [PubMed] [Google Scholar]
- 9.Berkowitz SA, Seligman HK, Choudhry NK. Treat or eat: food insecurity, cost-related medication underuse, and unmet needs. Am J Med. 2014;127(4):303–310. doi: 10.1016/j.amjmed.2014.01.002. e3. [DOI] [PubMed] [Google Scholar]
- 10.Gundersen C, Oliveira V. The food stamp program and food insufficiency. Am J Agr Econ. 2001;83(4):875–887. [Google Scholar]
- 11.Dinour LM, Bergen D, Yeh M-C. The food insecurity-obesity paradox: a review of the literature and the role food stamps may play. J Am Diet Assoc. 2007;107(11):1952–1961. doi: 10.1016/j.jada.2007.08.006. [DOI] [PubMed] [Google Scholar]
- 12.Nord M. How much does the Supplemental Nutrition Assistance Program alleviate food insecurity? Evidence from recent programme leavers. Public Health Nutr. 2012;15(5):811–817. doi: 10.1017/S1368980011002709. [DOI] [PubMed] [Google Scholar]
- 13.Leung CW, Villamor E. Is participation in food and income assistance programmes associated with obesity in California adults? Results from a state-wide survey. Public Health Nutr. 2011;14(4):645–652. doi: 10.1017/S1368980010002090. [DOI] [PubMed] [Google Scholar]
- 14.Webb AL, Schiff A, Currivan D, Villamor E. Food Stamp Program participation but not food insecurity is associated with higher adult BMI in Massachusetts residents living in low-income neighbourhoods. Public Health Nutr. 2008;11(12):1248–1255. doi: 10.1017/S1368980008002309. [DOI] [PubMed] [Google Scholar]
- 15.Leung CW, Ding EL, Catalano PJ, Villamor E, Rimm EB, Willett WC. Dietary intake and dietary quality of low-income adults in the Supplemental Nutrition Assistance Program. Am J Clin Nutr. 2012;96(5):977–988. doi: 10.3945/ajcn.112.040014. [DOI] [PMC free article] [PubMed] [Google Scholar]
- 16.Nguyen BT, Shuval K, Njike VY, Katz DL. The Supplemental Nutrition Assistance Program and dietary quality among U.S. adults: findings from a nationally representative survey. Mayo Clin Proc. 2014;89(9):1211–1219. doi: 10.1016/j.mayocp.2014.05.010. [DOI] [PubMed] [Google Scholar]
- 17.Kreider B, Pepper JV, Gundersen C, Jolliffe D. Identifying the effects of SNAP (food stamps) on child health outcomes when participation is endogenous and misreported. J Am Stat Assoc. 2012;107(499):958–975. [Google Scholar]
- 18.Centers for Disease Control and Prevention National Center for Health Statistics. National Health and Nutrition Examination Survey. 2013. Available at: http://www.cdc.gov/nchs/nhanes.htm. Accessed May 12, 2013.
- 19.Gundersen C, Kreider B, Pepper J. The economics of food insecurity in the United States. Appl Econ Perspect Pol. 2011;33(3):281–303. [Google Scholar]
- 20.US Dept of Agriculture. Food security in the U.S.—survey tools. 2014. Available at: http://www.ers.usda.gov/topics/food-nutrition-assistance/food-security-in-the-us/survey-tools.aspx#.U7qhOPldUSV. Accessed July 7, 2014.
- 21.National Cancer Institute. Applied research: cancer control and population sciences. Healthy Eating Index. 2012. Available at: http://appliedresearch.cancer.gov/tools/hei. Accessed February 4, 2014.
- 22.Guenther PM, Casavale KO, Kirkpatrick SI et al. Update of the Healthy Eating Index: HEI-2010. J Acad Nutr Diet. 2013;113(4):569–580. doi: 10.1016/j.jand.2012.12.016. [DOI] [PMC free article] [PubMed] [Google Scholar]
- 23.World Health Organization. Global database on body mass index. 2014. Available at: http://apps.who.int/bmi/index.jsp?introPage=intro_3.html. Accessed July 7, 2014.
- 24.Haines PS, Hama MY, Guilkey DK, Popkin BM. Weekend eating in the United States is linked with greater energy, fat, and alcohol intake. Obes Res. 2003;11(8):945–949. doi: 10.1038/oby.2003.130. [DOI] [PubMed] [Google Scholar]
- 25.Stata, Version 13 [computer program]. College Station, TX: StataCorp LP; 2013. [Google Scholar]
- 26.Centers for Disease Control and Prevention. National Health and Nutrition Examination Survey. Overview of NHANES survey design and weights. Available at: http://www.cdc.gov/Nchs/tutorials/environmental/orientation/sample_design/index.htm. Accessed July 7, 2014.
- 27.SAS, Version 9.3 [computer program]. Cary, NC: SAS Institute Inc; 2011. [Google Scholar]
- 28.Hanson KL, Sobal J, Frongillo EA. Gender and marital status clarify associations between food insecurity and body weight. J Nutr. 2007;137(6):1460–1465. doi: 10.1093/jn/137.6.1460. [DOI] [PubMed] [Google Scholar]
- 29.Farber HS. Job Loss in the Great Recession: Historical Perspective From the Displaced Workers Survey, 1984–2010. Cambridge, MA: National Bureau of Economic Research; 2011. Working paper 17040. [Google Scholar]
- 30.Ganong P, Liebman JB. The Decline, Rebound, and Further Rise in SNAP Enrollment: Disentangling Business Cycle Fluctuations and Policy Changes. Cambridge, MA: National Bureau of Economic Research; 2013. Working paper 19363. [Google Scholar]
- 31.Schmidt L, Shore-Sheppard L, Watson T. The effect of safety net programs on food insecurity. University of Kentucky Center for Poverty Research discussion paper series, DP2012-12. Available at: http://www.ukcpr.org/Publications/DP2012-12.pdf. Accessed July 1, 2014.
- 32.Seligman HK, Schillinger D. Hunger and socioeconomic disparities in chronic disease. N Engl J Med. 2010;363(1):6–9. doi: 10.1056/NEJMp1000072. [DOI] [PubMed] [Google Scholar]
- 33.Monsivais P, Drewnowski A. The rising cost of low-energy-density foods. J Am Diet Assoc. 2007;107(12):2071–2076. doi: 10.1016/j.jada.2007.09.009. [DOI] [PubMed] [Google Scholar]
- 34.Maillot M, Darmon N, Darmon M, Lafay L, Drewnowski A. Nutrient-dense food groups have high energy costs: an econometric approach to nutrient profiling. J Nutr. 2007;137(7):1815–1820. doi: 10.1093/jn/137.7.1815. [DOI] [PubMed] [Google Scholar]
- 35.Carlson A, Frazão E. Are healthy foods really more expensive? It depends on how you measure the price. 2012. US Dept of Agriculture, Economic Research Service. Economic information bulletin 96. Available at: http://www.ers.usda.gov/media/600474/eib96_1_.pdf. Accessed August 8, 2014.
- 36.Coveney J, O’Dwyer LA. Effects of mobility and location on food access. Health Place. 2009;15(1):45–55. doi: 10.1016/j.healthplace.2008.01.010. [DOI] [PubMed] [Google Scholar]
- 37.Larson NI, Story MT, Nelson MC. Neighborhood environments: disparities in access to healthy foods in the U.S. Am J Prev Med. 2009;36(1):74–81. doi: 10.1016/j.amepre.2008.09.025. [DOI] [PubMed] [Google Scholar]
- 38.Galvez MP, Morland K, Raines C et al. Race and food store availability in an inner-city neighbourhood. Public Health Nutr. 2008;11(6):624–631. doi: 10.1017/S1368980007001097. [DOI] [PubMed] [Google Scholar]
- 39.Baker EA, Schootman M, Barnidge E, Kelly C. The role of race and poverty in access to foods that enable individuals to adhere to dietary guidelines. Prev Chronic Dis. 2006;3(3):A76. [PMC free article] [PubMed] [Google Scholar]
- 40.US Dept of Agriculture, Agricultural Marketing Service. Food deserts. 2014. Available at: http://apps.ams.usda.gov/fooddeserts/foodDeserts.aspx. Accessed February 6, 2014.
- 41.Walker RE, Keane CR, Burke JG. Disparities and access to healthy food in the United States: a review of food deserts literature. Health Place. 2010;16(5):876–884. doi: 10.1016/j.healthplace.2010.04.013. [DOI] [PubMed] [Google Scholar]
- 42.Administration for Children and Families, Office of Community Services. Healthy Food Financing Initiative. 2011. Available at: http://www.acf.hhs.gov/programs/ocs/resource/healthy-food-financing-initiative-0. Accessed August 5, 2014.
- 43.US Dept of Agriculture. Supplemental Nutrition Assistance Program education guidance: Nutrition Education and Obesity Prevention Grant Program. Available at: http://snap.nal.usda.gov/snap/Guidance/FinalFY2015SNAP-EdGuidance.pdf. Accessed August 9, 2014.
- 44.Guthrie JF, Frazão E, Andrews M, Smallwood D. Improving food choices—can food stamps do more? Amber Waves. 2007;5(2):22–28. [Google Scholar]
- 45.Long V, Cates S, Blitstein J . Supplemental Nutrition Assistance Program Education and Evaluation Study (Wave II) Washington, DC: Dept of Agriculture, Food and Nutrition Service; 2013. [Google Scholar]
- 46.McLaughlin C, Tarasuk V, Kreiger N. An examination of at-home food preparation activity among low-income, food-insecure women. J Am Diet Assoc. 2003;103(11) doi: 10.1016/j.jada.2003.08.022. [DOI] [PubMed] [Google Scholar]
- 47.Rose D. Food Stamps, the Thrifty Food Plan, and meal preparation: the importance of the time dimension for US nutrition policy. J Nutr Educ Behav. 2007;39(4):226–232. doi: 10.1016/j.jneb.2007.04.180. [DOI] [PubMed] [Google Scholar]
- 48.US Dept of Agriculture. SNAP-ED strategies and interventions: an obesity prevention toolkit for states. Available at: http://snap.nal.usda.gov/snap/SNAP-EdInterventionsToolkit.pdf. Accessed December 9, 2014.
- 49.Faggiano F, Vineis P, Cravanzola D et al. Validation of a method for the estimation of food portion size. Epidemiology. 1992;3(4):379–382. doi: 10.1097/00001648-199207000-00015. [DOI] [PubMed] [Google Scholar]
- 50.Mertz W, Tsui JC, Judd J et al. What are people really eating? The relation between intake derived from estimated diet records and intake determined to maintain body weight. Am J Clin Nutr. 1991;54(2):291–295. doi: 10.1093/ajcn/54.2.291. [DOI] [PubMed] [Google Scholar]
- 51.Briefel RR, Sempos CT, McDewell MA, Chien S, Alaimo K. Dietary methods research in the Third National Health and Nutrition Examination Survey: underreporting of energy intake. Am J Clin Nutr. 1997;65(4 suppl):1203S–1209S. doi: 10.1093/ajcn/65.4.1203S. [DOI] [PubMed] [Google Scholar]
- 52.Gundersen C, Kreider B. Food stamps and food insecurity what can be learned in the presence of nonclassical measurement error? J Hum Resour. 2008;43(2):352–382. [Google Scholar]
- 53.Kaiser LL, Townsend MS, Melgar-Quiñonez HR, Fujii ML, Crawford PB. Choice of instrument influences relations between food insecurity and obesity in Latino women. Am J Clin Nutr. 2004;80(5):1372–1378. doi: 10.1093/ajcn/80.5.1372. [DOI] [PubMed] [Google Scholar]
- 54.Gundersen C, Kreider B. Bounding the effects of food insecurity on children’s health outcomes. J Health Econ. 2009;28(5):971–983. doi: 10.1016/j.jhealeco.2009.06.012. [DOI] [PubMed] [Google Scholar]