

Background: ACh-induced phosphorylation drives assembly of reflectins, dynamically tuning iridescence from subcellular Bragg reflectors in squid iridocytes.
Results: Reflectin sequences and phosphorylation sites are characterized from iridocytes with different photonic behaviors.
Conclusion: Differences in reflectin structures and phosphorylation determine the emergent photonic behavior of reflective squid tissues.
Significance: Biomolecular mechanisms of adaptive iridescence provide new insights into protein-dependent energy transduction and approaches to tunable optical materials.
Keywords: biomaterials, cell signaling, mass spectrometry (MS), phosphorylation, protein self-assembly, dynamic color, iridescence, iridocyte, iridophore, reflectin, protein assembly, biophotonics
Abstract
The reversible assembly of reflectin proteins drives dynamic iridescence in cephalopods. Squid dynamically tune the intensity and colors of iridescence generated by constructive interference from intracellular Bragg reflectors in specialized skin cells called iridocytes. Analysis of the tissue specificity of reflectin subtypes reveals that tunability is correlated with the presence of one specific reflectin sequence. Differential phosphorylation and dephosphorylation of the reflectins in response to activation by acetylcholine, as well as differences in their tissue-specific and subcellular spatial distributions, further support the suggestion of different roles for the different reflectin subtypes.
Introduction
Biology has evolved complex strategies to generate, reflect, utilize, control, and detect light. Cephalopods (squids, octopi, and cuttlefish) are paragon examples of light-manipulating organisms, having evolved a sophisticated camera-like eye, which in some respects outperforms the eyes of vertebrate eyes (1). They have evolved the ability to activate, shutter, and direct bioluminescence generated autogenically (2) and by endosymbionts (3). These animals are especially renowned for their remarkable ability to dynamically camouflage themselves, seemingly morphing into and appearing from their surroundings, by actively tuning combinations of the pigmentation, iridescence, transparency, and light scattering of their skin (4, 5). These dynamic color displays are used for camouflage as well as communication (6, 7).
Iridescence (angle- and wavelength-dependent reflectance) is a form of structural coloration that results from reflection rather than from differential absorption by pigments. Unlike the pigmented chromatophore cells in the skin, the cephalopods' iridocytes (also known as iridophores) produce iridescent colors by constructive interference of light reflected from the lamellae of subcellular Bragg reflectors that create a periodic, mesoscale array of alternating high and low refractive indices (8). Although the Bragg reflectors of many cephalopod iridocytes are static, reflecting only one unchanging color (9–11), certain squid (in the family Loliginidae) have evolved tunability and adaptive control of the iridescent properties of their skin by modulation of the internal assembly and periodicity of these photonic structures (12–14).
We recently used focused ion beam dissection, transmission electron microscopy, and confocal immunohistochemistry to confirm earlier observations suggesting that the Bragg lamellae of squid iridocytes are formed by multiple infoldings of the plasma membrane, thus segregating the intracellular reflectin protein-containing lamellae from the extracellular medium (15, 16). The neurotransmitter acetylcholine (ACh),2 previously shown to activate iridescence by binding to muscarinic receptors (17), triggers a signal transduction cascade culminating in changes in phosphorylation of the reflectin proteins correlated with their condensation (14, 15). Analyses of D2O transport in conjunction with microspectrophotometric analyses of subcellular sections of individual Bragg reflectors (15) demonstrated that this reversible condensation of the reflectin proteins drives a Gibbs-Donnan-mediated efflux of water across the lamellar cell membrane, rapidly and reversibly dehydrating the lamellae to thus change both the periodicity and the refractive index contrast of the multilayer reflector, accounting for the tunability of the color and intensity of reflectance (15).
Previous studies demonstrated a dependence of these photonic changes on phosphorylation of the reflectins consistent with a causative relationship (14), and subsequent in vitro studies confirmed that neutralization of the initially cationic reflectins (as would be the result of that phosphorylation) drives their condensation and hierarchical assembly (13). With this motivation, we present here a detailed characterization of the sequences of the reflectin proteins found in tunable and non-tunable iridocytes of the squid, their tissue specificity, subcellular localization, and post-translational changes in phosphorylation, a ubiquitous switch for controlling protein interactions.
Materials and Methods
Specimen Collection
Live Doryteuthis opalescens specimens were purchased from Outer Banks Commercial Fisheries (Oxnard, CA), and transported under constant oxygen aeration to the University of California-Santa Barbara where they were kept in 2-m circular tanks connected to an open seawater system.
Reflectin Analysis by Gel Electrophoresis
Iridocyte tissue was isolated by careful dissection as reported previously (13, 14). 1-cm2 iridocyte tissue patches were taken from around the circumference of a cross-section of the squid mantle to obtain tissue samples representing the radial distribution of reflectins from the ventral, ventral-lateral, lateral, dorsal-lateral, and dorsal surfaces. The iridocyte tissue was homogenized in a TenBroeck glass tissue grinder in homogenization buffer (PBS, pH 7.4, 5 mm EDTA with HaltTM protease and phosphatase inhibitors (Thermo Fisher Scientific)). The insoluble material (containing the reflectin proteins (10, 14, 18)) was pelleted by centrifugation (20,000 × g, 10 min 5 °C). The pellets were centrifugally washed two times with homogenization buffer. The pellet was solubilized in SDS loading buffer, heated to 95 °C for 5 min, and resolved by SDS-PAGE (125 V, 1.5 h) on a 12% Tris-glycine polyacrylamide gel and then stained with Coomassie Brilliant Blue protein stain (0.1% (w/v) Coomassie Brilliant Blue R-250, 50% methanol, 10% acetic acid), and destained (10% methanol, 10% acetic acid). Alternatively, gels were fixed and stained with SYPRO RubyTM (Thermo Fisher Scientific) per the manufacturer's protocol. SeeBlue® Plus2 and BenchMarkTM protein ladder were used as molecular mass standards to determine the apparent molecular masses of the protein bands. Known (0.1, 0.5, 1, 2, 5 μg) amounts of recombinant reflectin DpRA1 (13) were used as quantification standards for densitometry measurements. Protein gels were imaged and analyzed with a ChemiDocTM XRS+ imaging system and Image LabTM software (Bio-Rad). For determination of the reflectin proportion of the dry tissue weight, isolated tissue was rinsed in deionized water, lyophilized, weighed, and then homogenized and extracted as described above.
Tryptic Peptides, LC/MS and LC/MS/MS
Coomassie Brilliant Blue-stained and destained protein bands were excised from the protein gel. Proteins in the gel fragments were digested using the in-gel tryptic digestion protocol described by the University of California, San Francisco (UCSF) Mass Spectrometry Facility (19, 20). In brief, cysteine residues were reduced with 10 mm dithiothreitol in 25 mm ammonium bicarbonate for 1 h at 56 °C followed by alkylation with 55 mm iodoacetamide in 25 mm ammonium bicarbonate for 0.75 h at room temperature. Washed and dehydrated gels were rehydrated in trypsin solution (12.5 ng of trypsin/ml 25 mm ammonium bicarbonate) and digested for 8 h at 37 °C. Peptides were extracted from the gel with 50% acetonitrile, 0.1% trifluoroacetic acid followed by lyophilization overnight. Peptides were resuspended in 1% formic acid and resolved by LC/MS/MS on a Waters 2695 HPLC unit arranged in line with a Waters Micromass QTOF2 (Waters, Milford, MA) instrument at the University of California, Santa Barbara (UCSB) Mass Spectrometry Facility. Chromatograms and spectra were analyzed with MassLynx 4.0 software.
Matrix-assisted Laser Desorption Ionization Mass Spectroscopy
The reflectin pellet was solubilized in 6 m guanidine HCl and then desalted with C18 ZipTips® according to the manufacturer's protocol (Millipore, Billerica, MA). 2 μl of eluant was mixed with 8 μl of a saturated matrix solution of sinapic acid in 70:30, acetonitrile:H2O, with 0.1% TFA, spotted onto a stainless steel plate, and analyzed on a Voyager Biospectrophotometry work station (Applied Biosystems, Framingham, MA). Tryptic digests were analyzed as above except that the matrix solution was α-cyano-4-hydroxycinnamic acid in 50:50 acetonitrile:H2O, with 0.1% TFA.
Amino Acid Analysis
Protein bands resolved on an electrophoresis gel were transferred to a nitrocellulose membrane in a semi-dry blotter (15 V) for 20 min, and the protein bands were briefly stained with Coomassie Brilliant Blue and destained with 10% methanol, 10% acetic acid. The protein bands of interest were excised, vacuum-sealed in ampules with 100 μl of HCl, 5 μl of phenol, and 5 μl of thioglycolic acid, and hydrolyzed for 24 h at 110 °C. The resulting amino acid constituents were analyzed by an L-8900 amino acid analyzer (Hitachi, Tokyo, Japan) and calibrated with a known amino acid standard solution.
Sequencing of the D. opalescens Reflectins
Total RNA was isolated using an RNeasy mini kit (Qiagen, Valencia, CA), from freshly dissected iridocyte tissue that was disrupted by grinding in a mortar and pestle under liquid nitrogen. First-strand cDNA was synthesized using SuperScript III RT (Invitrogen) with an oligo(dT)20 primer. A BD SMART RACE cDNA amplification kit (Clontech) was used to prepare rapid amplification of complementary DNA ends (RACE)-ready cDNA. All the procedures were performed according to the manufacturers' instructions. We designed primers (Table 1) based on the reflectin cDNA transcripts of the closely related species, Doryteuthis pealeii (14), to amplify the coding sequences of D. opalescens reflectins. PCR products were cloned into the pCR2.1 vector using TA cloning (Invitrogen) and sequenced by the Sanger method (GENEWIZ Inc., South Plainfield, NJ) using the standard T7 promotor and M13 reverse primers. Sequences of D. opalescens reflectin-like proteins A1, A2, and B1 were deposited into GenBankTM: DoRA1 (GenBank accession number KF661517), DoRA2 (GenBank accession number KF661516), and DoRB1 (GenBank accession number KF661515). D. opalescens reflectin-like protein C1 (DoRC1, GenBank accession number KF661518) was sequenced using degenerate primers based on the MS/MS sequencing of the tryptic fragments (Table 2) coupled with the universal 5′ and 3′ RACE primers from the BD SMART RACE cDNA amplification kit. Based on the RACE results, primers were designed to amplify the full coding sequence of DoRC1 (Table 1), cloned, and sequenced as described for the reflectin proteins above. The D. opalescens reflectin sequences described here were later confirmed using 454 generated sequencing assemblies (data not shown).
TABLE 1.
PCR primers for the amplification of full length reflectin CDS
| Protein | 5′ primer | 3′ primer |
|---|---|---|
| DoRA1 | GTGTCCCTTCTTGGTCGTTGG | GAACATGCCACGCCCACAAG |
| DoRA2 | CCGTCAATATGAATCGCTAC | GAAAAAAACACACACACGAGAG |
| DoRB1 | AGAACTTTTGTATCACGC | TAAAATTCAACTTCCGG |
| DoRC1 | GTTTCCAAATCAAACCAGCACC | CGAAAGTTTAAGAAGTCCTCCAG |
TABLE 2.
Degenerate internal primers of DoRC1 for sequencing by RACE
| Peptide (MS/MS) | Forward primer | Reverse primer |
|---|---|---|
| YMDMPQGR | TAYATGGAYATGCCNCAYGG | CCRTGNGGCATRTCCATRTA |
| MEGNMEN | ATGGARGGNAAYATGGARAA | TTYTCCATRTTNCCYTCCAT |
| PPDMPR | CCNCCNGAYATGCCNMG | CKNGGCATRTCNGGNGG |
| MSPMPYG | ATGMCNCCNATGCCNTAYGG | CCRTANGGCATNGGNGKCAT |
Reflectance Measurements
The optical spectra of the squid tissues were measured by a USB2000 spectrophotometer (Ocean Optics, Dunedin, FL) through a 0.6-mm multi-mode collection fiber surrounded by a coaxial illumination fiber positioned normal to the skin surface at a distance of 2 mm. The reflectance measurements were taken under illumination (also normal to the surface) with a broadband halogen white light source (DH-2000, Ocean Optics). All spectra were standardized to a diffuse reflection standard WS-1 (Ocean Optics), corrected by subtraction of the electric dark signal, and recorded over an integration time of 0.75 s.
Western Blotting
Tissues were homogenized in homogenization buffer with 2% SDS using TenBroeck tissue homogenizers. Total protein content was determined by a BCA assay (Thermo Fisher), and each lysate was adjusted to final concentration of ∼1 mg/ml protein in SDS loading buffer and heated to 95 °C for 5 min. Freshly resolved SDS-PAGE gels were transferred to PVDF membranes in transfer buffer (25 mm Tris, 192 mm glycine, and 20% (v/v) methanol) using a semi-dry blotter (25 V, 15 min). Western blots for the detection of DoRA1 and DoRA2 were performed using a rabbit polyclonal IgG antibody raised against recombinant D. pealeii reflectin like protein-A1 (DpRA1; GenBank accession number FJ824804) (13). Membranes were blocked overnight at 4 °C in blocking buffer (PBS, 0.1% Tween 20, 3% (w/v) BSA, pH 7.4). The membranes were incubated in a 1:100 dilution of the primary antibodies in blocking buffer for 1 h at room temperature and then washed in blocking buffer three times for 10 min/wash. The membranes were then incubated in a 1:5000 dilution of secondary antibodies (goat anti-rabbit-conjugated HRP, Thermo Scientific, catalog number 31460) in blocking buffer for 1 h at room temperature. The membranes were again washed in blocking buffer three times. Immunoreactivity was visualized by chemiluminescence (SuperSignal West Dura chemiluminescence substrate, Thermo Scientific, catalog number 37071). For Western blot detection of DoRB1, we used a custom polyclonal chicken IgY antibody generated against the peptide: DDHYMENDRFLYPHD (Aves Labs, Tigard, OR). Similarly, for Western blot detection of DoRC1, we used a custom polyclonal chicken IgY antibody generated against the peptide: DQGRMGEPMEGNMENR (Aves Labs, Tigard, OR). For these two IgY antibodies, the blotting protocol was the same as outlined above except that the blocking buffer had 3% (w/v) nonfat milk instead of BSA, the primary antibodies were diluted 1:1000, and the secondary antibody (goat anti-chicken IgY HRP Aves Labs, H-1004) was diluted 1:5000. Blots and protein gels were imaged and analyzed on a ChemiDocTM XRS+ imaging system with Image LabTM software (Bio-Rad).
Microscopy Sample Preparation and Immunohistochemistry
Squid were euthanized by decapitation immediately prior to dissection. The mantle was cut along the ventral surface, the internal organs and gladius were removed, and the mantle was washed with artificial seawater (470 mm NaCl, 10 mm KCl, 27 mm MgCl2, 29 mm MgSO4, 11 mm CaCl2, 10 mm HEPES, pH 7.8) and pinned out flat in a dissection tray. Areas of the dermis were carefully dissected away from the mantle muscle and pinned out to the original dimensions in SYLGARD 184 (Dow Corning, Midland, MI)-coated dishes. These samples were fixed for electron microscopy (2% formaldehyde, 2% glutaraldehyde in artificial seawater, 2 h at room temperature). Following fixation, the tissue was washed with deionized water (freshly degassed) three times. At this point, samples not used for immunohistochemistry were post-fixed in 2% OsO4 for 1 h at room temperature. The tissue was dehydrated in a series of graded ethanol solutions: 25, 50, 75, 90, 100, 100, and 100% ethanol, followed by sequential exchange into propylene oxide:ethanol solutions: 33, 66, 100, 100, 100% propylene oxide. The tissue samples then were transferred to Spurr's resin (Ted Pella Inc., Redding, CA) through a graded series of Spurr's resin:propylene oxide solutions: 33, 66, 100, and 100% Spurr's resin, transferred to silicon molds overlaid with fresh resin, and cured overnight at 55 °C. The hardened blocks were trimmed and sectioned on a Leica EM UC6 ultramicrotome (Leica Microsystems, Wetzlar, Germany). Ultrathin sections (80–100 nm) were collected on Formvar-coated copper mesh grids. The samples were gold-labeled following the previously published protocol (21). Briefly, samples were etched with 5% hydrogen peroxide for 10 min; blocked in Tris-buffered saline (TBST, 137 mm NaCl, 2.7 mm KCl, 25 mm Tris, 0.1% v/v Tween-20, pH 7.4); incubated for 16 h at room temperature in solutions of the antibodies diluted in TBST (rabbit anti-RA1, 1:100; chicken anti-RB1, 1:1000; chicken anti-IN2, 1:1000); washed three times in TBST; incubated with the appropriate secondary antibodies conjugated to 12-nm gold nano-particles (donkey anti-rabbit IgG, 711-205-152, or donkey anti-chicken IgY, 703-205-155, Jackson ImmunoResearch Laboratories Inc., West Grove, PA), washed three times in TBST; post-stained using 4% uranyl acetate (10 min) followed by four water washes; and soaked in 2% lead citrate (2 min) followed by four more washes. Samples were imaged on a JEOL 123 transmission electron microscope operating at 80 kV. The ImageJ software package was used to analyze the spatial distribution of the localized gold nanoparticle with respect to the iridosomal lamellae by measuring the distance from each particle to the membrane at the edge of the lamellae (dpm) and the thickness of the platelet (dt). The distance from the center of the platelet to the particle was expressed as a percentage of the distance from the center platelet to the edge of the platelet (dcp)to normalize for variation in platelet thickness.
Results
We used the Eastern Pacific squid, D. opalescens, for characterization of dynamic squid iridocyte reflectin proteins (Fig. 1). As reported previously (10, 14), the reflectin proteins are the dominant component of the initially insoluble portion of the lysate (pellet following 20,000 × g centrifugation in homogenization buffer) (Fig. 2). The reflectins remain insoluble in the presence of non-ionic detergents (1% Triton-X, Tween 20, and Nonidet P-40) and the non-ionic denaturant urea (8 m) but are readily solubilized in SDS (1–2%) or the chaotropic salt guanidine hydrochloride (6 m).
FIGURE 1.

Iridocytes of D. opalescens. A, red patches of iridescence can be seen in the dorsal surface of the mantle. B, a cross-section of the squid mantle annotated with the radial spatial designations used in this study: D (dorsal), DL (dorsal-lateral), L (lateral,) VL (ventral-lateral), and V (ventral). C and D, close-up of the dorsal surface iridescence emanating from iridocytes in response to ACh: with ACh stimulation (C) and without ACh (D). E, higher resolution images of iridocytes (in this case green/blue). The dotted line represents a cross-section through an iridocyte shown by transmission electron microscopy in F. The electron-dense regions are the high refractive index lamellae filled with condensed reflectins. Periodicity of lamellae produces iridescence via constructive interference of reflections.
FIGURE 2.
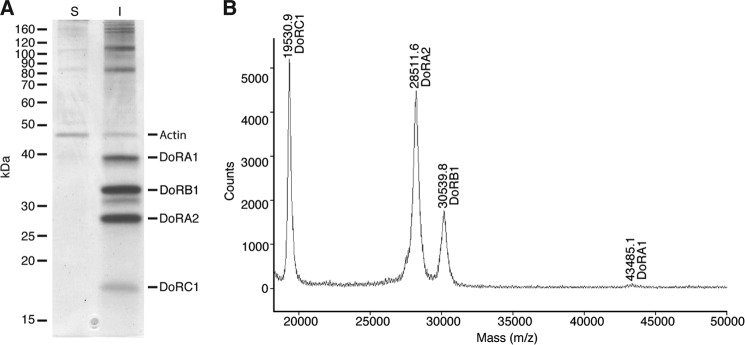
Masses of the iridocyte tissue dominating proteins. A, SDS-PAGE of the soluble (S) and insoluble (I) proteins from iridocyte tissue homogenate. Fractions represent equivalent amounts of tissue homogenate. The reflectin proteins are indicated on the right, along with actin as a reference. Molecular masses of the protein standards are indicated on the left in kDa. B, MALDI-MS of the same insoluble protein fraction showing distinct peaks for the abundant reflectin proteins.
From the sequences of the cloned cDNAs and subsequent confirmation by direct peptide sequencing, we determined the primary sequences of the reflectins from the adaptive iridocytes of D. opalescens. As expected, these include the same highly abundant reflectin proteins found in the closely related D. pealeii (from the western Atlantic) (14). The newly sequenced DoRA1, DoRA2, and DoRB1 are 94.9, 97.4, and 98.5% identical based on amino acid sequence to DpRA1, DpRA2, and DpRB1, respectively (Fig. 3). The relative molecular masses of the various reflectins were determined by mobility during SDS-PAGE (Fig. 2A) and by mass spectrometry (Fig. 2B) and compared with the cDNA deduced sequences (Table 3). We also sequenced an additional abundant protein, DoRC1 (Fig. 4); its amino acid sequence deduced from the cDNA was validated by LC/MS/MS sequencing of multiple tryptic peptides (Table 4). A corresponding (∼18-kDa) protein was also found by SDS-PAGE from the D. pealeii iridocytes, although the sequence of this protein was not determined (14). Together these four highly abundant reflectin proteins make up 18 ± 5% (n = 6) of the dry (lyophilized) weight of dermal iridocyte tissue.
FIGURE 3.

Homology of D. opalescens and D. pealeii dermal reflectins. Asterisks denote identical residues, periods denote similar residues, and the reflectin repeat domains are highlighted in yellow.
TABLE 3.
Measured and predicted masses of the reflectin proteins in adaptive iridocytes
| DoRA1 | DoRA2 | DoRB1 | DoRC1 | |
|---|---|---|---|---|
| Mr (SDS--PAGE) | 41,100 | 31,100 | 26,900 | 18,100 |
| cDNA | 43,672 | 30,450 | 28,364 | 19,458 |
| MALDI-MS | 43,485 | 30,540 | 28,512 | 19,531 |
FIGURE 4.

Sequence of D. opalescens reflectin-like protein C1. A, complementary sequence of DoRC1 coding sequence is shown on the top line, and the corresponding amino acid translation is shown below. Sequences identified by LC/MS/MS sequencing of tryptic peptides are underlined. The characteristic reflectin domain is highlighted in green. The peptide used for generation of antibodies is highlighted in blue. The novel tetrapeptide repeat is highlighted in yellow; the consensus of the repeat is shown in B.
TABLE 4.
LC/MS/MS sequencing of DoRC1 tryptic peptides
| Starting amino acid | Ending amino acid | Sequence | Observed mass (M + 1H)+ | cDNA predicted mass | Modifications |
|---|---|---|---|---|---|
| 91 | 100 | MMQC*PPDMPR | 1276.54 | 1276.49 | Acrylocysteine |
| 109 | 116 | SMDMPYGR | 956.42 | 956.39 | None |
| 117 | 124 | YMDMPQGR | 997.46 | 997.42 | None |
| 125 | 139 | YMSSQDRLMHMMHNR | 1936.68 | 1936.84 | None |
| 151 | 162 | MGEPMEGNMENR | 1394.54 | 1394.55 | None |
DoRC1 has a single hallmark reflectin repeat motif near the C terminus; like the other reflectins, this protein does not show significant sequence homology with any other proteins in the database apart from other reflectins. It has the typical reflectin amino acid composition: rich in methionine, glycine, and arginine, while lacking significant content of the hydrophobic amino acids valine, alanine, leucine, and isoleucine. However, unlike the other reflectins, it has a unique tandem repeat sequence (Fig. 4B) near the N terminus. This repeat constitutes a small non-polar region that could potentially be membrane-associated, as suggested by the von Heijne transmembrane prediction algorithm (22) (Fig. 5). Of all the reflectins analyzed in this work, only DoRC1 shows the pronounced structural segregation of hydrophobic and hydrophilic domains, potentially indicative of membrane interaction. The possible significance of this finding is discussed below.
FIGURE 5.

Transmembrane domain predictions for D. opalescens reflectin proteins. Calculations are based on von Heijne et al. (22) using the Goldman, Engelman, and Steitz (GES) hydrophobicity scale (42) with a scanning window of 11. The dotted and dashed lines denote upper and lower cut-offs for potential membrane domains, respectively.
To validate the protein sequences predicted from the cDNAs and verify that reflectin proteins are indeed the primary component of the observed protein bands and not simply minor components, we measured the amino acid compositions of these bands and compared them with the compositions predicted from the cloned cDNAs. In each case, we found that the predicted composition closely matches the experimental observations, indicating accurate assignment of the protein bands (Fig. 6).
FIGURE 6.
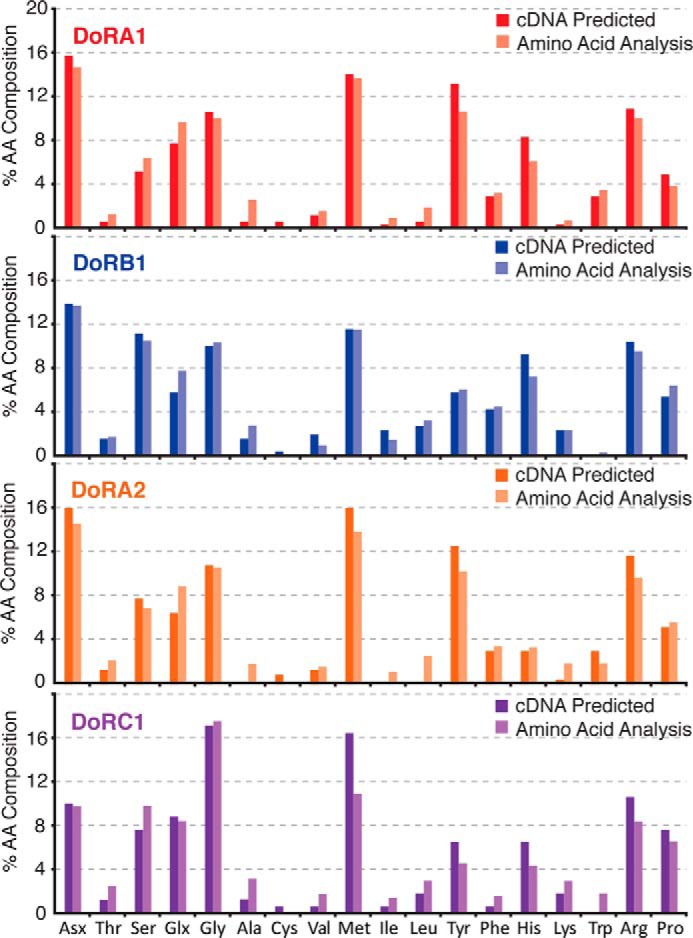
Amino acid compositions of the four most abundant reflectin protein bands. Dark lines indicate the cDNA predicted amino acid (AA) composition, and the light lines represent measured values from protein bands isolated by gel electrophoresis.
Western blotting was used to analyze the distribution of the various reflectins in the tissues of D. opalescens (Fig. 7). Antibody raised against recombinant DpRA1 (cross-reactive with DoRA1 and DoRA2) shows immune cross-reactive protein species in all of the various iridescent tissues (iridocytes, eye silver, and ink sac), but no cross-reactivity with any other tissues. DoRB1 and DoRC1, however, are predominant only in the dermal iridocytes. Furthermore, densitometric analyses of the relative abundance of these proteins showed that DoRB1 and DoRC1 are enriched in the dorsal iridocytes and progressively diminish around the mantle to the ventral surface where DoRA2 dominates (Fig. 8). The iridocyte's optical responsiveness driven by ACh shows a strong correlation (Fig. 9), with the dorsal iridocytes displaying the most dramatic changes in iridescence (temporally progressing from transparent to red, then continuing through the spectrum to blue (13, 23)). Iridocytes toward the ventral surface are less responsive to ACh, and the ventral iridocytes blush only slightly, an effect barely noticeable to the eye and not distinguishable above background in the recorded spectra.
FIGURE 7.
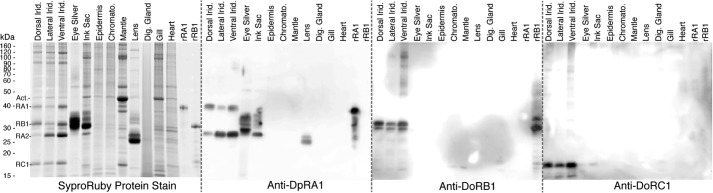
Distributions of reflectins in various tissues. SDS-PAGE and Western blots of various D. opalescens tissue lysates (∼5 μg total protein/lane) are shown. The tissue types are: dorsal iridocyte (Dorsal Irid.), lateral iridocyte (Lateral Irid.), ventral iridocyte (Ventral Irid.), eye silver, ink sac, epidermis, chromatophore (Chromato.), mantle muscle, lens, digestive gland (Dig. Gland), gill, and systemic heart. The molecular mass standard is indicated at the far left with the reflectin proteins (RA1, RB1, RA2, and RC1) and actin (Act.). 1 μg of recombinant reflectins rDpRA1 and 1 μg of rDpRB1 were loaded as controls. All gels were electrophoresed in parallel, transferred to membranes, and immunoblotted. Anti-DpRA1 (cross-reactive with DoRA1 and DoRA2) binds proteins in all iridescent tissues. Anti-DoRB1 and anti-DoRC1 cross-react only with proteins in the adaptive iridescent tissues of the dermis.
FIGURE 8.

Distribution of reflectin subtypes around the circumference of the squid mantle. Relative protein concentrations were determined by SDS-PAGE densitometry. A, plots of the relative percentage of composition of the total reflectin proteins represented by each reflectin subtype, with tissue location indicated on the x axis. The solid lines represent the wt % (error bars = ±1 S.D., n = 5) and the dashed lines represent the mol %. B, bar graphs visually represent the same data for the dorsal, lateral, and ventral iridocytes, showing relative wt % (top) and relative molar ratios (bottom).
FIGURE 9.
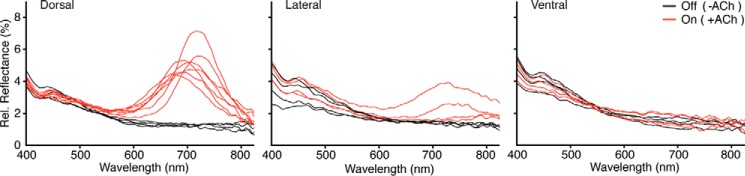
Acetylcholine induced iridescence by position around the D. opalescens mantle. Iridescence response before (black) and after (red) the addition of exogenous ACh is shown. The dorsal region shows the most dramatic response, followed by the lateral and ventral regions. Rel. Reflectance, relative reflectance.
Immunohistochemical labeling of the iridocytes using gold nanoparticle-conjugated antibodies revealed the intra-lamellar organization of the reflectin proteins (Fig. 10). In these analyses, the protein-rich Bragg lamellae are visualized as the electron-dense structures after staining with heavy metal. Histograms of the distance from each deposited particle to the nearest lamellar membrane interface show the distribution of the reflectin across the protein lamellae. These measurements indicate that reflectins DoA1/A2 and DoRB1 are distributed across the entire platelet, whereas DoRC1 is preferentially localized near the edges of the reflectin lamellae. As mentioned above, DoRC1 is unique among the reflectins analyzed in this work in exhibiting a pronounced structural segregation of hydrophobic and hydrophilic domains (Fig. 5) sufficient to suggest the possibility of association with membrane. Immunogold nanoparticle labeling has a lateral resolution of ∼30 nm (21). The average lamellar thickness associated with each particle measurement was 94.7 ± 22 nm and therefore within the resolution necessary to determine general localization across the lamellae.
FIGURE 10.
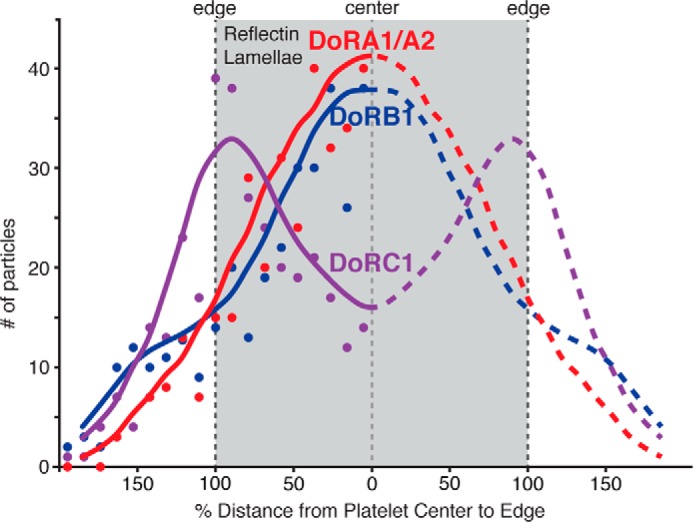
Reflectin distribution across the high-index lamellae. This graph shows the reflectin distribution across the high-index lamellae filled with the condensed reflectins as determined by immunohistochemistry using RA1 (red), RB1 (blue), and RC1 (purple) primary antibodies and secondary antibodies conjugated to gold nanoparticles. The gray region represents a cross-section through a single reflectin-containing lamella. Dashed lines demarcate the center and edges of the lamellae. The y axis shows the total number of nanoparticles measured, and the x axis shows the percentage of distance from the center to the edge of the lamellae (thus the edge = 100%). For greater significance, all data were plotted on the left side of the figure (regardless of the actual side on which the counted particles were observed); for schematic representation, the lines tracing the positions of the data were then reflected across the lamellar center (x = 0). The dots represent the histograms of the total particle count from the center in 10% increments (n = 325 for each sample). The lines are drawn as guides for the eye, representing the data smoothed with an averaging window size of 5.
Izumi et al. (14) showed that phosphorylation of reflectins DpRA1 and DpRA2 is triggered by ACh and required for activation of iridescence, identifying several of these sites of phosphorylation. They also showed that DpRB1 becomes dephosphorylated simultaneously commensurate with the activation of iridescence, as evidenced by the dramatic shift in the isoelectric point of DpRB1 (becoming more positive) by two-dimensional gel electrophoresis and changes in staining by the Pro-Q diamond phosphoprotein stain, although the specific sites of phosphorylation were not identified (14). We used LC/MS/MS and MALDI-MS to characterize the post-translational modifications of DoRB1. LC/MS/MS analyses identified three sites of phosphorylation: Thr(P)-64, Ser(P)-228, and Ser(P)-258 (Fig. 11, Table 5). Based on the local amino acid sequence similarity between Ser-228 (RRPSEGH) and Ser-218 (RRPSESH), we suggest that Ser-218 may also be a likely phosphorylation site. Although the peptide containing Ser-218 was not observed in our LC/MS/MS analyses (possibly due to poor mobilization of the peptide ion), we did observe an ion of the appropriate mass to contain Ser(P)-218 by MALDI-MS of the tryptic fragment (Fig. 12), supporting our suggestion. Mass spectrometry also revealed that the reflectins are N-terminally acetylated, explaining the previous failed attempts at Edman degradation (14).
FIGURE 11.

Representative spectra of DoRB1 phosphorylation site identification by LC/MS/MS, in this case Ser(P)-228. A and B, the non-phosphorylated (A) and phosphorylated (B) versions of the same peptide. Phosphorylation is evident by the additional 80 Da on the phospho-containing parent ion. More informatively, the characteristic fragmentation induced neutral loss of 98 Da (H3PO4, ions shown in red), allowing identification of the specific phosphorylated amino acid. All daughter ions that do not contain the phosphorylation site are identical in the two spectra (labeled in black, e.g. y10–y15). In contrast, all phospho-containing peptides are 18 Da less (+80 Da (HPO3) − 98 Da (H3PO4)) than the corresponding fragments in the non-phosphorylated spectra (shown in red, e.g. y16–y17).
TABLE 5.
LC/MS/MS sequencing of DoRB1 tryptic peptides identifying multiple sites of post-translational modifications
| Starting amino acid | Ending amino acid | Sequence | Observed mass (M + 1H)+ | cDNA predicted mass | Modifications |
|---|---|---|---|---|---|
| 2 | 19 | SSFMDPMHYDGMGMSHSK | 2086.93 | 2086.81 | M1 loss, acetyl N terminus (S2) |
| 53 | 62 | FGNLMEPMSR | 1181.60 | 1181.54 | None |
| 63 | 70 | MTMDFHGR | 1074.42 | 1074.37 | Thr(P)-63 |
| 78 | 96 | IVDPGHYFAMDDHYMENDR | 2326.06 | 2326.54 | None |
| 97 | 105 | FLYPHDMLR | 1191.58 | 1191.59 | None |
| 108 | 124 | HGMYGFMQGDYGNNMHR | 2014.88 | 2014.81 | None |
| 125 | 133 | GMFADGMYR | 1047.54 | 1047.43 | None |
| 163 | 189 | YLDDSYFMNYHDPPVIVHSHYNDQEGR | 3312.52 | 3312.45 | None |
| 216 | 225 | RPSESHSPQGR | 1261.01 | 1261.24 | Ser(P)-118 |
| 226 | 243 | RPSEGHIIQVRPEGGSSR | 1961.94 | 1962.02 | None |
| 226 | 243 | RPSEGHIIQVRPEGGSSR | 2041.90 | 2041.99 | Ser(P)-228 |
| 248 | 260 | AQLFPDDKLTDSA | 1420.66 | 1420.69 | None |
| 248 | 260 | AQLFPDDKLTDSA | 1500.72 | 1500.67 | Ser(P)-259 |
FIGURE 12.
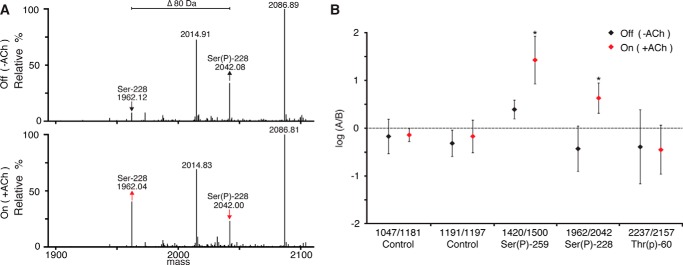
Site-specific phosphorylation of DoRB1 revealed by LC/MS. A, representative LC/MS spectra comparing the relative ion counts of the non-phosphorylated (1962 Da) and phosphorylated (2042 Da) Ser-228-containing peptide from non-iridescent (Off) and iridescent (On) iridocyte tissue. The increase in the relative ion count ratio of 1962/2042 in the ACh-stimulated tissue indicates net dephosphorylation of this site. B, comparison of relative ion counts showing the dephosphorylation of Ser(P)-228 and Ser(P)-259 (*: p < 0.05). Thr(P)-60 does not show significant changes in this analysis. For comparison, unmodified (non-phosphorylated) DoRB1 peptides are used as internal controls. (n = 5; error bars = ±1 S.D.)
To further corroborate the previously observed changes in phosphorylation, we used LC/MS to qualitatively observe site-specific phosphorylation changes in DoRB1. Comparison of the ratios of the total ion counts of phosphorylated and non-phosphorylated versions of the same peptide in iridescent and non-iridescent samples (Fig. 12A) revealed that Ser-228 and Ser-259 both become dephosphorylated in response to ACh (Fig. 12B). We speculate that Ser(P)-218 follows the same dephosphorylation trend as Ser(P)-228. The phosphorylation level of Thr-60, on the other hand, does not appear to change significantly, although the signals for this peptide and its phosphopeptide counterpart are too low relative to the background to allow a definitive conclusion.
Discussion
The reflectance intensity of multilayer reflectors is a function of the number of interfaces and the refractive index contrast (24). Recent optical analysis of individual iridocyte reflectors determined that the lamellae containing the condensed reflectins have refractive indices of ∼1.405 (25). To achieve this refractive index, the reflectin proteins must be concentrated to several hundred mg/ml (15, 26, 27). It is therefore not surprising to find that the reflectin proteins constitute such a large portion of the dry mass of the tissue, even considering that they are found specifically within a defined region of the iridocyte cells and that the whole tissue contains other cell types and a dense network of extracellular matrix. This puts reflectins among some of the most tissue-dominating proteins, with levels similar to the highly concentrated lens crystallins (28) or the abundant carbon-fixing plant enzyme ribulose-bisphosphate carboxylase/oxygenase (Rubisco) (29). The reflectins are the dominant component of the optically functional dynamic actuator material: the switchable components of the Bragg lamellae that undergo structural transitions to modulate the behavior of incident light.
The emerging hypothesis is that the diverse array of photonic structures (static, adaptive, specular, diffuse, broadband, narrowband) across Cephalopoda are reflectin-based and that the subtypes and proportions thereof tune the photonic performance of these reflective tissues (10, 11, 14, 18, 30–32). Here we show that DoRB1 is specific to adaptive iridocytes; that its relative abundance corresponds to adaptive functionality; and that specific changes in its phosphorylation state correlate with changes in acetylcholine-induced iridescence. This evidence suggests that this specific reflectin plays a role in the modulation of protein assembly (13) and ultrastructure (12) of the protein-containing lamellae, with the resulting condensation of the reflectins driving the Gibbs-Donnan-mediated expulsion of water, the consequent activation of reflectance, and the ultimate color change, as previously demonstrated (15). In corroboration, we recently used the presence of high levels of DoRB1 to predict that a unique class of leucophores discovered in female D. opalescens are in fact adaptive, transitioning between transparent and bright white, apparently using the same mechanism and signaling pathway as the adaptive iridocytes, with the only difference being that the photonic structures are large, intracellular, Mie-scattering vesicles rather than Bragg lamellae (31). Confirming the significance of this result, we find reflectins with sequences corresponding exactly to those of DoRA1 and DoRB1 in these ACh-switchable bright white reflective cells.
Transmission electron micrographs suggested that the reflectins may be tethered to the lamellar membranes and that this may in some way control the consistent regularity of the lamellar dimensions (13, 33). We hypothesize that DoRC1 protein might serve to tether the reflectin network to the lamellar membrane. DoRC1 is localized at or near the lamellar membranes, as shown by our immunolocalization experiments, and contains the only predicted membrane-associating domain among the reflectins analyzed here.
Reflectins DoRA1 and DoRA2 are highly homologous to all other reflectin proteins characterized in other families of cephalopods thus far, all of which come from statically reflective tissues (10, 18, 32). The static reflectins superficially vary only in the number of reflectin repeats (DoRA1 has six repeats; DoRA2 has four repeats; all six identified Euprymna scolopes reflectins contain five repeats; Loligo forbesi MRRP1 has five repeats; etc.). The secondary and hierarchical structures and mechanistic function of the reflectin domains still remain unclear, but it is thought that assembly can be triggered (by the processes discussed immediately below) to reversibly self-associate to form a condensed reflectin hydrogel-like network (13). DoRA1 and DoRA2 show evidence of self-assembly in vitro (13, 34, 35), forming complexes similar in size and morphology to those observed in vivo (13). This could explain the enrichment of DoRA2 (supplanting DoRB1) in the less responsive dermal iridocytes and the presence of DpRA1 immunologically cross-reactive species in all of the iridescent tissues of D. opalescens: adaptive and static alike.
Our working hypothesis for the mechanistic control of the modulation of iridocyte reflectivity and color is that changes in reflectin phosphorylation trigger the condensation of these proteins within the Bragg lamellae. We note that previous studies showed that inhibition of this phosphorylation blocks ACh-induced activation of reflectance (14) and that charge neutralization drives the condensation and hierarchical assembly of the reflectins (13). We suggest that this reversible condensation drives the transition to an optically homogenous material, with progressive densification of the protein matrix masking surface charges and driving a compensatory flux of mobile counter ions across the lamellar membranes, which in turn triggers the expulsion of water and partial dehydration of the Bragg lamellae via Gibbs-Donnan re-equilibration (15). These processes both increase the refractive index contrast of the lamellae (activating their reflectance) and progressively shift the wavelength of the reflected light as the thickness and spacing of the Bragg lamellae shrink. Although recent microspectrophotometric analyses support this hypothesis (23, 25), there are several conceivable mechanisms by which changes in reflectin phosphorylation could drive these processes, and they are not mutually exclusive. Phosphorylation/dephosphorylation might direct specific reflectin protein-protein interactions and assembly, influencing hydrophobic collapse and the masking of surface charge moieties. Dephosphorylation will also directly decrease the surface charge density of the protein and decrease the protein hydration shell. The observed changes in reflectin phosphorylation also drive the proteins toward net charge neutrality, the point at which proteins tend to be least soluble (14). ACh-induced dephosphorylation shifts the pI of RB1 from ∼7 to ∼8, whereas the ACh-induced phosphorylations of RA1 and RA2 shift their pI values from ∼9 to ∼8 (13). Assuming that the intra-lamellar pH is close to that of the cytosol at ∼7.8, these changes in phosphorylation of the reflectins would essentially neutralize excess charges on the proteins, overcoming their Coulombic repulsion and potentially allowing Van der Waals and other attractive forces to drive non-covalent condensation of the reflectin network.
Most importantly, this work builds a framework for further research into reflectin-based adaptive photonic structures. We can now start to frame hypotheses and design experiments to further characterize the functional roles of specific reflectin proteins in the biophotonic systems of cephalopods. It should in the future be possible to experimentally test our suggestions that DoRA1/DoRA2 reversibly establish the hydrogel network and that DoRB1 and DoRC1 integrate into this network via association of their canonically repeated reflectin domains, tethering the network to the lamellar membranes of the Bragg reflector and imparting phosphorylation-and dephosphorylation-inducible changes in refractive index, hydration, dehydration, reflectivity, and color.
Among the diverse range of animal reflectors (8, 36, 37), the subject of these studies is one of the rare cases in which iridescence is tunably adaptive (38, 39). Although the tunable iridescence of squid has been the subject of numerous quests for insights to guide the bio-inspired development of tunable photonic materials (13, 14, 34, 35, 40, 41), characterization of the protein actuators controlling adaptive iridescence is only just coming to light.
Acknowledgments
We thank Tim Athens of Outer Banks Commercial Fisheries for help in the collection of live, healthy squid specimens. We thank Mary Baum and Dr. Amitabh Ghoshal for helpful discussions and for reviewing and editing the manuscript.
This work was supported by grants from the Office of Naval Research via a Multidisciplinary University Research Initiative (MURI) award to Duke University (Grant N00014-09-1-1053), and the Army Research Office (Grant W911NF-10-1-0139 to D. E. M.).
- ACh
- acetylcholine
- RACE
- rapid amplification of complementary DNA ends.
References
- 1. Land M. F., Fernald R. D. (1992) The evolution of eyes. Annu. Rev. Neurosci. 15, 1–29 [DOI] [PubMed] [Google Scholar]
- 2. Arnold J., Young R. (1974) Ultrastructure of squid photophore. I. Structure of the photogenic tissue. Biol. Bull. 147, 507–521 [DOI] [PubMed] [Google Scholar]
- 3. Ruby E. G. (1996) Lessons from a cooperative, bacterial-animal association: the Vibrio fischeri-Euprymna scolopes light organ symbiosis. Annu. Rev. Microbiol. 50, 591–624 [DOI] [PubMed] [Google Scholar]
- 4. Mäthger L. M., Hanlon R. T. (2007) Malleable skin coloration in cephalopods: selective reflectance, transmission and absorbance of light by chromatophores and iridophores. Cell Tissue Res. 329, 179–186 [DOI] [PubMed] [Google Scholar]
- 5. Hanlon R. T., Chiao C. C., Mäthger L. M., Barbosa A., Buresch K. C., Chubb C. (2009) Cephalopod dynamic camouflage: bridging the continuum between background matching and disruptive coloration. Philos. Trans. R. Soc. Lond. B Biol. Sci. 364, 429–437 [DOI] [PMC free article] [PubMed] [Google Scholar]
- 6. Boal J., Shashar N., Grable M., Vaughan K., Loew E., Hanlon R. T. (2004) Behavioral evidence for intraspecific signaling with achromatic and polarized light by cuttlefish (Mollusca: Cephalopoda). Behaviour 141, 837–861 [Google Scholar]
- 7. Hanlon R. T., Messenger J. B. (1996) Cephalopod Behavior, pp. 31–45, 120–130, Cambridge University Press, Cambridge, UK [Google Scholar]
- 8. Denton E. J., Land M. F. (1971) Mechanism of reflexion in silvery layers of fish and cephalopods. Proc. R Soc. Lond. B Biol. Sci. 178, 43–61 [DOI] [PubMed] [Google Scholar]
- 9. Brocco S. L., Cloney R. A. (1980) Reflector cells in the skin of Octopus dofleini. Cell Tissue Res. 205, 167–186 [DOI] [PubMed] [Google Scholar]
- 10. Crookes W. J., Ding L.-L., Huang Q. L., Kimbell J. R., Horwitz J., McFall-Ngai M. J. (2004) Reflectins: the unusual proteins of squid reflective tissues. Science 303, 235–238 [DOI] [PubMed] [Google Scholar]
- 11. Holt A. L., Sweeney A. M., Johnsen S., Morse D. E. (2011) A highly distributed Bragg stack with unique geometry provides effective camouflage for Loliginid squid eyes. J. R. Soc. Interface 8, 1386–1399 [DOI] [PMC free article] [PubMed] [Google Scholar]
- 12. Cooper K. M., Hanlon R. T., Budelmann B. U. (1990) Physiological color change in squid iridophores. II. Ultrastructural mechanisms in Lolliguncula brevis. Cell Tissue Res. 259, 15–24 [DOI] [PubMed] [Google Scholar]
- 13. Tao A. R., DeMartini D. G., Izumi M., Sweeney A. M., Holt A. L., Morse D. E. (2010) The role of protein assembly in dynamically tunable bio-optical tissues. Biomaterials 31, 793–801 [DOI] [PubMed] [Google Scholar]
- 14. Izumi M., Sweeney A. M., DeMartini D. G., Weaver J. C., Powers M. L., Tao A., Silvas T. V., Kramer R. M., Crookes-Goodson W. J., Mäthger L. M., Naik R. R., Hanlon R. T., Morse D. E. (2010) Changes in reflectin protein phosphorylation are associated with dynamic iridescence in squid. J. R. Soc. Interface 7, 549–560 [DOI] [PMC free article] [PubMed] [Google Scholar]
- 15. DeMartini D. G., Krogstad D. V., Morse D. E. (2013) Membrane invaginations facilitate reversible water flux driving tunable iridescence in a dynamic biophotonic system. Proc. Natl. Acad. Sci. U.S.A. 110, 2552–2556 [DOI] [PMC free article] [PubMed] [Google Scholar]
- 16. Cloney R. A., Brocco S. L. (1983) Chromatophore organs, reflector cells, iridocytes and leucophores in cephalopods. Integr. Comp. Biol. 23, 581–592 [Google Scholar]
- 17. Hanlon R. T., Cooper K. M., Budelmann B. U., Pappas T. C. (1990) Physiological color change in squid iridophores. I. Behavior, morphology and pharmacology in Lolliguncula brevis. Cell Tissue Res. 259, 3–14 [DOI] [PubMed] [Google Scholar]
- 18. Weiss J. L., Evans N. A., Ahmed T., Wrigley J. D., Khan S., Wright C., Keen J. N., Holzenburg A., Findlay J. B. (2005) Methionine-rich repeat proteins: a family of membrane-associated proteins which contain unusual repeat regions. Biochim. Biophys. Acta 1668, 164–174 [DOI] [PubMed] [Google Scholar]
- 19. Rosenfeld J., Capdevielle J., Guillemot J. C., Ferrara P. (1992) In-gel digestion of proteins for internal sequence analysis after one- or two-dimensional gel electrophoresis. Anal. Biochem. 203, 173–179 [DOI] [PubMed] [Google Scholar]
- 20. Hellman U., Wernstedt C., Góñez J., Heldin C. H. (1995) Improvement of an “In-Gel” digestion procedure for the micropreparation of internal protein fragments for amino acid sequencing. Anal. Biochem. 224, 451–455 [DOI] [PubMed] [Google Scholar]
- 21. Bergersen L. H., Storm-Mathisen J., Gundersen V. (2008) Immunogold quantification of amino acids and proteins in complex subcellular compartments. Nat. Protoc. 3, 144–152 [DOI] [PubMed] [Google Scholar]
- 22. Claros M. G., von Heijne G. (1994) TopPred II: an improved software for membrane protein structure predictions. Comput. Appl. Biosci. 10, 685–686 [DOI] [PubMed] [Google Scholar]
- 23. Wardill T. J., Gonzalez-Bellido P. T., Crook R. J., Hanlon R. T. (2012) Neural control of tuneable skin iridescence in squid. Proc. Biol. Sci. 279, 4243–4252 [DOI] [PMC free article] [PubMed] [Google Scholar]
- 24. Land M. (1972) The physics and biology of animal reflectors. Prog. Biophys. Mol. Biol. 24, 75–106 [DOI] [PubMed] [Google Scholar]
- 25. Ghoshal A., DeMartini D. G., Eck E., Morse D. E. (2013) Optical parameters of the tunable Bragg reflectors in squid. J. R. Soc. Interface 10, 20130386. [DOI] [PMC free article] [PubMed] [Google Scholar]
- 26. Barer R., Tkaczyk S. (1954) Refractive index of concentrated protein solutions. Nature 173, 821–822 [DOI] [PubMed] [Google Scholar]
- 27. Zhao H., Brown P. H., Schuck P. (2011) On the distribution of protein refractive index increments. Biophys. J. 100, 2309–2317 [DOI] [PMC free article] [PubMed] [Google Scholar]
- 28. Horwitz J. (2003) α-Crystallin. Exp. Eye Res. 76, 145–153 [DOI] [PubMed] [Google Scholar]
- 29. Ellis R. J. (1979) The most abundant protein in the world. Trends Biochem. Sci. 4, 241–244 [Google Scholar]
- 30. Mäthger L. M., Senft S. L., Gao M., Karaveli S., Bell G. R. R., Zia R., Kuzirian A. M., Dennis P. B., Crookes-Goodson W. J., Naik R. R., Kattawar G. W., Hanlon R. T. (2013) Bright white scattering from protein spheres in color changing, flexible cuttlefish skin. Adv. Funct. Mater. 23, 3980–3989 [Google Scholar]
- 31. DeMartini D. G., Ghoshal A., Pandolfi E., Weaver A. T., Baum M., Morse D. E. (2013) Dynamic biophotonics: female squid exhibit sexually dimorphic tunable leucophores and iridocytes. J. Exp. Biol. 216, 3733–3741 [DOI] [PubMed] [Google Scholar]
- 32. Andouche A., Bassaglia Y., Baratte S., Bonnaud L. (2013) Reflectin genes and development of iridophore patterns in Sepia officinalis embryos (Mollusca, Cephalopoda). Dev. Dyn. 242, 560–571 . [DOI] [PubMed] [Google Scholar]
- 33. Arnold J. M. (1967) Organellogenesis of the cephalopod iridophore: cytomembranes in development. J. Ultrastruct. Res. 20, 410–421 [DOI] [PubMed] [Google Scholar]
- 34. Kramer R. M., Crookes-Goodson W. J., Naik R. R. (2007) The self-organizing properties of squid reflectin protein. Nat. Mater. 6, 533–538 [DOI] [PubMed] [Google Scholar]
- 35. Qin G., Dennis P. B., Zhang Y., Hu X., Bressner J. E., Sun Z., Crookes-Goodson W. J., Naik R. R., Omenetto F. G., Kaplan D. L. (2012) Recombinant reflectin-based optical materials. J. Polym. Sci. B Polym. Phys. 51, 254–264 [Google Scholar]
- 36. Seago A. E., Brady P., Vigneron J. P., Schultz T. D. (2009) Gold bugs and beyond: a review of iridescence and structural colour mechanisms in beetles (Coleoptera). J. R. Soc. Interface 6, S165–S184 [DOI] [PMC free article] [PubMed] [Google Scholar]
- 37. Parker A. R. (2000) 515 million years of structural colour. J. Opt. A Pure Appl. Opt. 2, 15–28 [Google Scholar]
- 38. Mäthger L. M., Land M. F., Siebeck U. E., Marshall N. J. (2003) Rapid colour changes in multilayer reflecting stripes in the paradise whiptail, Pentapodus paradiseus. J. Exp. Biol. 206, 3607–3613 [DOI] [PubMed] [Google Scholar]
- 39. Vigneron J. P., Pasteels J. M., Windsor D. M., Vértesy Z., Rassart M., Seldrum T., Dumont J., Deparis O., Lousse V., Biró L. P., Ertz D., Welch V. (2007) Switchable reflector in the Panamanian tortoise beetle Charidotella egregia (Chrysomelidae: Cassidinae). Phys. Rev. E Stat. Nonlin. Soft Matter Phys. 76, 031907 [DOI] [PubMed] [Google Scholar]
- 40. Walish J., Kang Y., Mickiewicz R., Thomas E. (2009) Bioinspired electrochemically tunable block copolymer full color pixels. Adv. Mater. 21, 1–4 [Google Scholar]
- 41. Fudouzi H. (2011) Tunable structural color in organisms and photonic materials for design of bioinspired materials. Sci. Technol. Adv. Mater. 12, 064704 [DOI] [PMC free article] [PubMed] [Google Scholar]
- 42. Engelman D. M., Steitz T. A., Goldman A. (1986) Identifying nonpolar transbilayer helices in amino acid sequences of membrane proteins. Annu. Rev. Biophys. Biophys. Chem. 15, 321–353 [DOI] [PubMed] [Google Scholar]