

Background: A hydrophobic residue in TM7 of the hSLC2A9 was found to affect hexose transport.
Results: Both Ile-335 and Trp-110 affect fructose trans-acceleration of urate, whereas only Trp-110 directly affects urate transport.
Conclusion: hSLC2A9 handles urate/fructose transport differently.
Significance: This study provides further information of how hSLC2A9 handling its substrates could be beneficial for future pharmaceutical treatments used in related diseases.
Keywords: hSLC2A9, hydrophobic residues, urate, trans-acceleration
Abstract
High blood urate levels (hyperuricemia) have been found to be a significant risk factor for cardiovascular diseases and inflammatory arthritis, such as hypertension and gout. Human glucose transporter 9 (hSLC2A9) is an essential protein that mainly regulates urate/hexose homeostasis in human kidney and liver. hSLC2A9 is a high affinity-low capacity hexose transporter and a high capacity urate transporter. Our previous studies identified a single hydrophobic residue in trans-membrane domain 7 of class II glucose transporters as a determinant of fructose transport. A mutation of isoleucine 335 to valine (I355V) in hSLC2A9 can reduce fructose transport while not affecting glucose fluxes. This current study demonstrates that the I335V mutant transports urate similarly to the wild type hSLC2A9; however, Ile-335 is necessary for urate/fructose trans-acceleration exchange to occur. Furthermore, Trp-110 is a critical site for urate transport. Two structural models of the class II glucose transporters, hSLC2A9 and hSLC2A5, based on the crystal structure of hSLC2A1 (GLUT1), reveal that Ile-335 (or the homologous Ile-296 in hSLC2A5) is a key component for protein conformational changes when the protein translocates substrates. The hSLC2A9 model also predicted that Trp-110 is a crucial site that could directly interact with urate during transport. Together, these studies confirm that hSLC2A9 transports both urate and fructose, but it interacts with them in different ways. Therefore, this study advances our understanding of how hSLC2A9 mediates urate and fructose transport, providing further information for developing pharmacological agents to treat hyperuricemia and related diseases, such as gout, hypertension, and diabetes.
Introduction
The membrane proteins making up the human facilitated glucose transporter family are encoded by the solute carrier gene family 2A (SLC2A).2 Many of these transport hexoses down their concentration gradient across mammalian cell membranes. Currently, 14 hSLC2As have been identified and subdivided into three classes (1–4), each associated with distinct substrate transport specificities. Many of these glucose transporter proteins are expressed specifically in different human tissues. For instance, the human glucose transporter 9 (hSLC2A9) is found primarily in the human kidney and liver (5, 6). Genome-wide association studies suggest that nucleotide polymorphisms within hSLC2A9 are associated with uric acid (urate) handling and urate-related diseases in humans, such as gout, diabetes, and hypertension (7–12).
Initially, hSLC2A9 was shown to be a high affinity-low capacity glucose and fructose transporter; however, more recently studies have demonstrated that it is also a high capacity urate transporter, playing a key role in the handling of this important metabolite in humans. Detailed characterization of hSLC2A9 indicates that this transporter exhibits hexose/hexose trans-acceleration and hexose/urate exchange across the cell membrane (13, 14). That is, hexose on one side of the membrane can stimulate the unidirectional flow of hexose or urate from the other side of the membrane. This trans-acceleration exchange behavior provides confirmation that hexoses and urate share the same transporter despite the observation that there is little or no competition for transport between these substrates (13, 14). Although trans-acceleration has been reported for a number of other members of this gene family, such as hSLC2A1, the exact mechanism for this interaction, particularly for hexoses and urate by hSLC2A9, remains unknown.
Extensive analysis has predicted that the SLC2As all have twelve transmembrane domains (TMs) with both carboxyl and amino termini and a long loop that connects TM6 and TM7, presenting to the cytosol (15). The recent report by Deng et al. (16) provides the first crystal structure for SLC2A1 and has now confirmed this topology. However, some features such as an intracellular helical bundle (ICH) domain, formed by the intracellular loop, which apparently closes the inner vestibule when the protein is in the outward-facing conformation, appears to be novel. TM7, long suspected to form part of the lining of the translocation pore with several key residues potentially involved in substrate binding and selectivity, is confirmed by this first SLC2A1 crystal structure.
We previously proposed that residues in this pore-lining helix, TM7, play key roles in determining substrate specificity. We have also shown that a single hydrophobic residue in the TM7 of several of the class II glucose transporters (hSLC2A5, 7, -9, and -11) and SLC2A2 markedly affects their ability to transport fructose but not glucose (17). An early computer model of hSLC2A7, based on the glycerol 3-phosphate transporter (GlpT), predicted that the isoleucine residue, Ile-314, in TM7 faces the aqueous pore and could potentially interact with a second hydrophobic residue, Trp-89, on the other side of the pore in TM2. This interaction was proposed to form a substrate selectivity filter, which determined the ability of fructose to access the translocation mechanism (18). Substitution of the equivalent isoleucine (Ile-296) with a valine in hSLC2A5 abolished fructose transport while having no effect on glucose transport. Similarly, substitution of isoleucine 335 with valine (I335V) in hSLC2A9 also strongly decreased fructose transport with glucose transport remaining unaffected.
This current study examined the importance of the hydrophobic residues Ile-335 and Trp-110 of hSLC2A9 for urate transport and urate/hexose trans-acceleration exchange. For this we constructed three point mutations of hSLC2A9: isoleucine 335 to valine (I335V) and tryptophan 110 to alanine (W110A) and phenylalanine (W110F). The impact of these mutations on hSLC2A9 transport characteristics was then assessed after expressing the proteins in Xenopus oocytes by the use of radiotracer flux measurements and electrophysiology. We found that the mutation I335V has urate transport kinetics similar to the wild type (WT) protein, whereas W110A has a lower capacity and higher affinity for urate transport compared with WT hSLC2A9. Wild type and mutant transporters exhibited urate/urate trans-acceleration; however, fructose/urate trans-acceleration was lost in both the I335V and W110A mutants but retained in W110F mutant. Immunohistochemistry and biotinylation studies indicated that all proteins are expressed at similar levels in the oocyte. This suggests that these functional differences between WT and mutant hSLC2A9 are due to structural changes in the protein, which is further discussed in light of a new structural model for hSLC2A9 based upon the crystal structure of hSLC2A1 (16).
These results demonstrate that Ile-335 of hSLC2A9 is necessary for urate/fructose trans-acceleration exchange to occur. They also indicate that Trp-110 of hSLC2A9 is critical for urate transport. Together they also confirmed that urate and fructose are both mediated by hSLC2A9 but that they interact with the transporter protein differently.
Experimental Procedures
Plasmid Construction
Original human hSLC2A9 was a gift from Kelly Moley and were inserted into the pGEM-HE vector for oocyte expression. Site-directed mutagenesis was performed by using QuikChange II site-directed mutagenesis kit (Stratagene) to construct isoleucine 335 to valine (I335V) and tryptophan 110 to alanine (W110A) mutants of hSLC2A9 WT. The forward and reverse primers for the I335V mutant were 5′-GTG GCC TCA ATG CAG TTT GGT TCT ATA CCA ACA GC-3′ and 5′-GCT GTT GGTATA GAA CCA AAC TGC ATT GAG GCC AC-3′ (17), for the W110A mutant were 5′-CT CTG ACT TTG CTC GCG TCT GTG ACT GTG TCC-3′ and 5′-GGA CAC AGT CAC AGA CGCGAG CAA AGT CAG AG-3′, and for the W110F mutant were 5′-CCC AGA CAC TCT GAC TTT GCT CTT CTC TGT GAC TGT GTC C-3′ and 5′-GGA CAC AGT CAC AGA GAA GAG CAA AGT CAG AGT GTC TGG G-′ (Sigma). These plasmids were transformed into Escherichia coli DH5α competent cells for DNA propagation.
mRNA Preparation and Xenopus laevis Oocyte Microinjection
mRNA preparation and microinjection were performed as previously described (13, 14). In brief, plasmids containing hSLC2A9 WT and its I335V, W110A, and W110F mutants were linearized with NheI and transcribed in vitro with T7 polymerase mMESSAGEmMACHINETM (Ambion). Individual adult female X. laevis oocytes were separated by collagenase and manually defoliculated before injection. Isolated oocytes were injected with 10–20 nl (20 ng) of mutant plasmid mRNA and incubated in modified Bath medium (88 mm NaCl, 1 mm KCl, 0.33 mm Ca(NO3)2, 0.41 mm CaCl2, 0.82 mm MgSO4, 2.4 mm NaHCO3, 10 mm Hepes, 2.5 mm sodium pyruvate, 0.1 mg/ml penicillin, and 0.05 mg/ml gentamycin sulfate, pH 7.5, for 4 days at 16–18 °C before functional assays. All chemicals were obtained from Sigma unless otherwise stated (Sigma, Oakville, Ontario, Canada). The same volume of water was injected into oocytes as a control. The concentration of mRNA was determined using a Nano Drop 1000 Spectrophotometer V3.7 (Thermo Fisher Scientific).
Radiotracer Flux Experiments
All radiotracer flux studies were conducted at room temperature 20–22 °C. 14C-labeled urate (Moravek) was used in flux and efflux experiments to test the urate handling ability of hSLC2A9 WT, I335V, W110A, and W110F mutants. Radioactivity was measured with a Beckman LS6500 liquid scintillation counter (Fullerton, CA). Experiments were performed as previous studies described (13, 17).
Urate Kinetics
Urate transport was measured by incubating oocytes with 200 μl of urate solution ranging from 100 μm to 5 mm. Oocytes were incubated for 20 min, which was determined as the linear portion of the urate uptake. The transport reaction was stopped by washing with ice-cold modified Barth's medium, then individual oocytes were placed into scintillation vials for uptake activity measurement. Uptake activity was corrected for nonspecific activities measured from control water-injected oocytes from the same batch for each experiment.
Trans-stimulation of Urate Uptake
Oocytes were loaded with substrates, d-fructose, urate, and d-fructose by preincubation for 1 h. Preloading was terminated by washing the oocytes with fresh modified Barth's medium. Preloaded oocytes were then used to perform [14C]urate uptake experiments as described above.
Electrophysiology Experiments
Experiments were conducted using the two-microelectrode voltage clamp (TEVC) technique with a GeneClamp 500B (Molecular Devices Inc. Sunnyvale, CA). Sodium-containing transport medium (STM; 100 mm NaCl, 2 mm KCl, 1 mm CaCl2, 1 mm MgCl2, 10 mm Hepes, pH 7.5, with Tris base) was used to perfuse oocytes to obtain a baseline current before adding experimental substrates. Urate induced current (1 mm urate in standard STM), and urate kinetics analysis (with urate concentration ranging from 0.05 to 5 mm, added to STM) was performed using a Gap-free protocol. Individual oocytes were clamped at −30 mV and super-perfused with different concentrations of urate for 30 s (range from 0.1 to 5 mm) followed by a 1-min wash with urate free buffer in between. Data were collected at the peak of each urate-induced current (previous analysis had shown that using the plateau after the peak provided identical kinetics). Data was expressed in the form of urate-induced mean current ±S.E. Current-voltage (I-V) curves were measured with a RAMP protocol in which the voltage was changed from −120 to 60 mV for a 3-s period. I-V curves were RAMP at the peak of the urate-induced currents. A Digidata 1320A converter and pClamp8 (Axon Instruments, Union City, CA) were used to collect and analyze data. Then we performed the Gap-free protocols to compare inward mean peak currents using either STM wash buffer or fructose containing STM buffer after oocytes were preincubated in situ with 1 mm urate for 1 min. The trans-acceleration measured with TEVC assumed that the inward currents induced by washing the oocytes with STM are urate-induced. That is, these currents were induced when urate moved out of the oocyte (downward facing peak current value; see Fig. 4, A and B).
FIGURE 4.

Trans-acceleration studies of urate-induced currents mediated by hSLC2A9 measured with TEVC. Panels A and B are representative current traces in a single oocyte expressing hSLC2A9 WT (upper traces), the I335V (lower traces), W110F (upper traces), and W110A (lower traces) mutants. All traces indicate 1 min of urate preloading followed by washing with either substrate free STM buffer (left) or 50 mm d-fructose STM buffer (right). Oocytes were clamped at −30 mV, and traces were recorded under the Gap-free protocol. Panel C, mean urate-induced inward currents were collected at the peak of the inward currents hSLC2A9 WT, I335V, W110F, and W110A. Urate preloading, oocytes were washed with either STM (dark) or 50 mm fructose containing STM (Fru, white). n ≥ 15 oocytes from 3 frogs, unpaired t test. *, p < 0.05.
Biotinylation
Biotinylation and Western blot analyses were carried out to measure the protein expression level of each isoform based upon a previously published protocol (19) with modification. Oocytes were washed three times with phosphate buffer saline (PBS), pH 8.0; then they were incubated in 2 mm Sulfo-NHS-LC-Biotin (Pierce) at room temperature for 30 min. The reaction was stopped by washing with quenching buffer (192 mm glycine and 25 mm Tris-HCl in PBS, pH 7.5). Oocytes were then lysed with radioimmune precipitation assay buffer (150 mm NaCl, 1% Triton X-100, 1% deoxycholic acid, 0.1% SDS, 1 mm EDTA, 10 mm Tris-HCl, pH 7.5). Lysates were incubated with streptavidin (Pierce) at 4 °C overnight. The next day beads with bound protein were spun down gently. Biotinylated proteins were resuspended using SDS sample buffer and subjected to SDS-PAGE. Proteins from SDS-PAGE were transferred to nitrocellulose membranes and blocked with 3% milk in PBST (0.05% Tween 20 in PBS). After blocking, the membrane was probed with primary hSLC2A9 antibody (Cedarlane, Canada) and anti-rabbit secondary antibody (Abcam, Cambridge, MA). Protein quantification was by measuring the band intensities using Image J (imagej.nih.gov).
Immunohistochemistry
Immunohistochemistry was used to determine protein expression in X. laevis oocyte membranes. Oocytes were washed with PBS (137 mm NaCl, 2.78 mm KCl, 4.3 mm Na2HPO4, 1.5 mm KH2PO4, pH 7.4), then fixed in 3% paraformaldehyde for 15 min at room temperature. After fixation, oocytes were washed with 50 mm NH4Cl and permeabilized with 0.1% Triton X-100. Oocytes were then blocked with 2% bovine serum albumin for 30 min followed by incubation with primary hSLC2A9 antibody in blocking buffer for 1 h at room temperature and then with secondary antibody, Alexa 488 (Invitrogen). After incubation, oocytes were mounted using Vectashield mounting medium (Vector Laboratories, Inc. Burlingame, CA) on slides with secure-seal spacers. Protein expression was determined by Wave FX confocal microscopy (Quorum Technologies, ON, Canada) of the fluorescent secondary antibody.
Data Analysis
Graphpad 5.0 was used to analyze all the data. Urate kinetic data were fitted using nonlinear regression. Current-voltage (I-V) curves were graphed in X-Y plots. Trans-acceleration data were analyzed by one-way ANOVA for the flux studies and Student's unpaired t test in TEVC studies. Significant values were accepted when p < 0.05. Biotinylation of protein expression level data were compared using arbitrary units of band intensity.
Homology Modeling
The three-dimensional models of the human transporters SLC2A5 and SLC2A9 were built using the I-TASSER server, which is based on ab initio/threading methods (20), and choosing the crystal structure of human glucose transporter SLC2A1 (PDB ID 4PYP) as the preferred template. The sequence identity/similarity between SLC2A1 (or SLC2A5) and SLC2A9 was 28/49% (or 29/59%). The server generated 5 models with the best model for each target selected based on their C-scores (−1.2) implemented in I-TASSER. The score is calculated based on the significance of threading template alignments and the convergence parameters of the structure assembly simulations. The stereochemical quality of the model was assessed with Molprobity, and it showed that 92% of the residues are in the most favorable regions of the Ramachandran plot for both molecular models (21). Sequence alignments were conducted with Clustal Omega (22) with figures created in ESPript 3.0 (23) and the PyMOL Molecular Graphics System, Version 1.5.0.4 Schrödinger, LLC.
Results
Urate Kinetics
Flux Studies
After determining that urate transport mediated by WT hSLC2A9 and its I335V, W110A, and W110F mutants were similar at 0.1 mm substrate concentration (data not shown), the kinetics for both mutants were then fully characterized. As shown in Fig. 1, A and B, the data indicate that the Michaelis-Menten-like kinetics for urate are similar for both the WT and the I335V mutant. WT hSLC2A9 has an average Vmax of 981.9 ± 136.5 pmol/oocyte/20 min with a Km of 4.5 ± 11.6 mm, I335V has a Vmax of 937.7 ± 278.1 pmol/oocyte/20 min and Km of 6.6 ± 3.1 mm, W110A has an average Vmax of 108.5 ± 11.1 pmol/oocyte/20 min and Km of 0.3 ± 0.1 mm, and W110F has an average Vmax of 355.6 ± 61.9 pmol/oocyte/20 min and Km of 1.7 ± 0.7 mm. This indicates that urate transport by the I335V mutant is very similar to the WT. The W110A mutant, on the other hand, has higher affinity and lower transport capacity compared with WT. W110F show an intermediate Vmax and Km between W110A and WT hSLC2A9.
FIGURE 1.
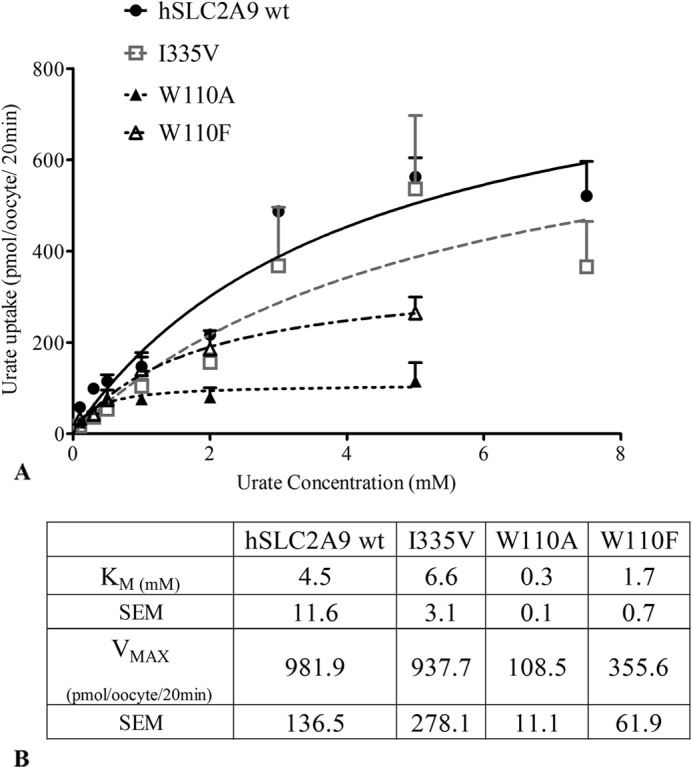
[14C]Urate kinetic measurements in oocytes expressing hSLC2A9. Panel A, Michaelis-Menten curves of [14C]urate kinetics of hSLC2A9 WT (●) and its mutants I335V (□), W110A (▴), and W110F (▵). Urate uptake was measured by incubating protein expressing oocytes in 200 μl of urate solution ranged from 100 μm to 5 mm for 20 min. Uptake activity was corrected for nonspecific transport measured in control water-injected oocytes from the same batch of oocytes. Panel B, [14C]urate kinetic constants of the three isoforms (n = 4).
TEVC
Because urate transport by WT hSLC2A9 is electrogenic (13, 14), we also used the TEVC method to further investigate how hSLC2A9 and its mutants transport urate. A representative trace from the actual recording obtained with WT hSLC2A9 is shown in Fig. 2A. We clamped a single oocyte at a holding potential of −30 mV, then perfused the oocyte with different concentrations of urate followed by a 1-min wash with STM. We then measured the mean induced outward current. Data were collected at the peak of each urate-induced current. Fig. 2B shows that urate transport by hSLC2A9 WT and its mutants displayed classical Michaelis-Menten kinetics. This confirms that all these proteins have only a single binding site for urate. Also, we can conclude that hSLC2A9 WT and I335V transport urate in the same way because they have very similar kinetic constants (Fig. 2C) (WT: Vmax = 433.4 ± 21.5 nA, Km = 1.9 ± 0.2 mm; I335V: Vmax = 451.0 ± 26.5 nA, Km = 2.2 ± 0.3 mm). However, the W110A and W110F mutations shift the urate kinetic curve to the right with a significantly smaller Vmax (115.0 ± 5.8 nA and 158.9 ± 14.5 nA) and Km (0.7 ± 0.1 mm and 1.0 ± 0.3 mm), suggesting that this tryptophan residue may play a key role in substrate preselection or binding.
FIGURE 2.

Urate-induced currents in oocytes measured with TEVC. Panel A, Provides a representative trace from the Gap-free protocol of WT hSLC2A9-expressed oocytes. Single oocytes were clamped at −30 mV and super-perfused with different concentrations of urate for 30 s (range from 0.1 to 5 mm) followed by a 1-min wash with urate free buffer in between. Panel B, Michaelis-Menten curves of urate kinetics of hSLC2A9 WT (●) and its mutants I335V (□), W110A (▴), and W110F (▵). Data were collected at the peak of each urate-induced current. Points represent the mean of urate induced peak outward current for each concentration. Panel C, [14C]urate kinetic constants of the WT and mutant isoforms (n ≥15 oocytes from 3 frogs). Panel D, current-voltage curve of 1 mm urate-induced current obtained from RAMP protocol for control and WT hSLC2A9 (●)- and I335V (□), W110A(▴), and W110F (▵) mutant-expressing oocytes. The oocytes were clamped initially at −30 mV followed by voltage change instantly from −120 to 60 mV for a 3-s period. I-V curves were RAMP at the peak of the urate-induced currents. n ≥15 oocytes from 3 frogs.
I-V Curve Using TEVC
In addition, we further investigated the protein function using current-voltage (I-V) curves as shown in Fig. 2D using a RAMP protocol. I-V curves were RAMP at the peak of the urate-induced currents. The voltage was progressively changed from −120 to 60 mV within a 3-s time period. Current recordings were filtered, and current values at 20 different voltages from −120 to 60 mV were shown. As indicated in Fig. 2C, urate transport showed a quasi-linear relationship with the membrane potential in the range from −120 to 60 mV, indicating that urate transport is driven, but not gated, by the voltage. The I-V curves of WT and I335V are similar; however, the I-V curve of W110A shows that urate-induced current is smaller than WT, similar to the urate kinetics analysis, and the curve of W110F indicates the urate-induced current is in between those recorded for WT and W110A. Overall, this suggests that the ability of SLC2A9 to bind and translocate urate is driven by the membrane potential.
Urate/Hexose Trans-stimulation
Isotopic Flux Studies
hSLC2A9 was originally reported to be a high affinity-low capacity hexose transporter and subsequently a high capacity urate transporter. It was also noted that hexoses can trans-accelerate urate uptake into oocytes (13, 14). Thus, we further examined the effect of trans-stimulation of urate transport by hexoses mediated by hSLC2A9 and its I335V, W110A, and W110F mutants. Fig. 3A shows urate flux rates compared with their control experiment using the non-transported l-glucose. Fig. 3B shows the normalized percentage of the trans-stimulation effect of both fructose and urate relative to the control, l-glucose. These result indicate that urate trans-stimulates urate uptake in all cases (One-way ANOVA, p < 0.05) and that fructose trans-stimulated urate uptake mediated by WT and W110F hSLC2A9 (one-way ANOVA, p < 0.05) but not by the I335V or W110A mutants (one-way ANOVA, p > 0.05, n ≥ 4).
FIGURE 3.
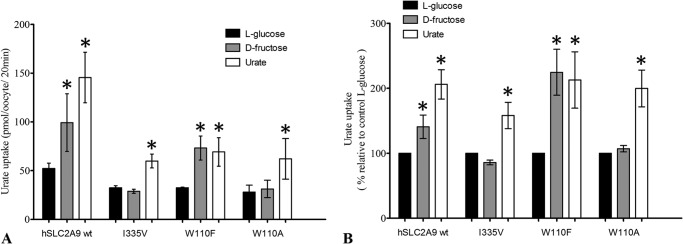
Trans-acceleration studies for urate uptake into oocytes preloaded with urate or fructose. Panel A, trans-acceleration experiments of urate flux in the presence of intracellular substrates mediated by hSLC2A9 WT- I335V mutant-, W110A mutant-, and W110F-expressing oocytes. Oocytes were preloaded with intracellular substrates, l-glucose (dark), d-fructose (gray), or urate (white) by preincubation for 1 h. Preloaded oocytes were then washed with fresh modified Barth's medium before performing [14C]urate uptake experiments. Panel B, bar graphs represent the percentage of each condition relative to control experiments (l-glucose). n ≥ 3, one-way ANOVA; *, p < 0.05.
TEVC
Using TEVC, Fig. 4, A and B, shows representative traces of urate-induced current mediated by hSLC2A9 WT-, I335V-, W110A-, and W110F-expressing oocytes using the Gap-free protocol in which the oocytes were clamped at −30 mV and incubated with 1 mm urate for 1 min. These traces clearly indicate that the inward current increases in the presence of extracellular fructose in oocytes expressing WT and W110F but not in those expressing I335V and W110A. Fig. 4C is a bar graph showing the peak mean inward currents. Again, results showed that increased inward currents were observed in WT- and W110F-expressing oocytes when extracellular fructose was present (Fig. 4, A and B, n ≥ 18, unpaired t test, p < 0.05). In contrast, no stimulation by fructose was seen in I335V- and W110A-expressing oocytes (n ≥ 18, unpaired t test, p > 0.05).
Qualitative and Quantitative Protein Expression
Qualitative analysis of hSLC2A9 and its I335V, W110A, and W110F mutant protein expression in the plasma membranes of X. laevis oocytes was determined using immunohistochemistry as shown in Fig. 5A. hSLC2A9 WT, I335V, W110A, and W110F proteins were expressed in the oocyte membrane, whereas water-injected oocytes showed no detectable protein expression (n = 3). Membrane proteins of all isoforms were also detected by biotinylation indicated in Fig. 5B. Indicated in Fig. 5C, protein expression levels were almost identical in both hSLC2A9 WT and the I335V mutant. Although the total expression protein levels seem slightly less in W110A and W110F compared with the WT, these differences are not statistically significant. The membrane protein expression levels are all proportional to their total protein levels. (n ≥ 6, one-way ANOVA, p > 0.05).
FIGURE 5.

Qualitative and quantitative determination of WT and mutant hSLC2A9 protein expression. Panel A, representative pictures of immunohistochemistry of water injected, hSLC2A9 WT and I335V, W110A, and W110F mutant-expressing oocytes. Panel B, a representative picture of Western blot analysis of protein expression of water injected: hSLC2A9 WT and I335V-, W110F-, and W110A-expressing oocytes. Total (Tf; black), unbound (Un; gray), and biotinylated (Bt, white) proteins of hSLC2A9 WT, W110F, and W110A were loaded onto one 10-well SDS-PAGE gel, whereas proteins of I335V were loaded on a separated gel. Panel C, quantitative analysis of protein expression. Data were calculated from band intensities obtained from Image J and use a formula, biotinylated protein = total protein − unbound protein. Protein expression levels are shown as bar graphs with arbitrary units. n ≥ 6, one-way ANOVA among the three biotinylated proteins, p > 0.05.
Structural Analysis of SLC2A9 Using Homology Modeling
To provide structural insight into these critical residues, a model of the human SLC2A9 transporter was generated based on the human glucose transporter SLC2A1 (PDB ID 4PYP) (16). The accuracy of homology models is dependent on the template sequence identity (>30%) or the quality of the alignment between the target and template. Fortunately for membrane proteins, even at a low level of template sequence identity, accurate model prediction is possible. The membrane environment imposes topological constraints on the relative orientations of helices, which limit structural diversity available to families of membrane proteins. SLC2A1 and SLC2A9 share 28% sequence identity and a high degree of similarity, 49%. Phylogenetic comparison reveal three classes within the GLUT clade, with hSLC2A1, a class 1 GLUT, and hSLC2A9, a class II GLUT, having similar predicted topologies (24). Due to such high homology, the template treading alignment score was remarkably high as indicated by the normalized Z-score of 3.4. Alignments with a normalized Z-score of >1 reflects a confident alignment and most likely the same fold as the query protein. Furthermore, I-TASSER confidence score (C-score) for the derived SLC2A9 model is also in the higher range (1.2). Confidence values higher than 1 indicate that the overall derived structural homology model is likely accurate, that is, the deviation between derived homology model and the template three-dimensional structure is low (20).
The SLC2A9 model has 12 transmembrane segments and represents the inward-facing conformation (Fig. 6A). Fig. 6, B and C, show both views from intracellular face and extracellular face of the model. These 12 TM segments are organized into two structural repeats, TM1–6 and TM7–12, related by a pseudo-2-fold inversion axis parallel to the membrane bilayer, yielding a 6 + 6 inverted repeat fold. The transmembrane domains 1, 2, 4, 5, 7, 8, 10, and 11 line the central transport cavity, and 3, 6, 9, and 12 form the outer helices as seen in Fig. 6A. Furthermore, we see evidence of an ICH on the cytoplasmic face of the transporter (Fig. 6A). Crystal structures of SLC2A1, XylE (25), and GlcP (26) suggest that all of the Major Facilitator Superfamily (MFS) transporters have an ICH located at the cytoplasmic face that is thought to affect the conformational change between inward- and outward-facing conformations (27).
FIGURE 6.

Molecular model of the human SLC2A9 and SLC2A5 transporters comparing possible hydrophobic interactions. Panel A, schematic representation of the molecular homology model of the hSLC2A9a based on the human SLC2A1 crystal structure (PDB ID 4PYP). The 12-transmembrane helices are labeled. Panels B and C show views from the intracellular face and extracellular face. The intracellular face contains the conserved intracellular helical bundle. Panel D, potential interactions of Ile-335 indicate a hydrophobic network with residues within TM10, thus linking the critical TM7 (orange) to one-half of the transporter. Panel E, structural model of the mutant SLC2A9 I335V was generated that demonstrates the intricate linkage to helix 10 is disrupted when Ile-335 is converted to Val. Panel F, in SLC2A5 Ile-296, equivalent of Ile-335 in SLC2A9, forms an even more extensive hydrophobic cluster with neighboring residues at TM10 and TM12. Panel G, structural model of the mutant SLC2A5 I296V highlights the loss of the hydrophobic network, which subsequently leads to alteration in substrate specificity.
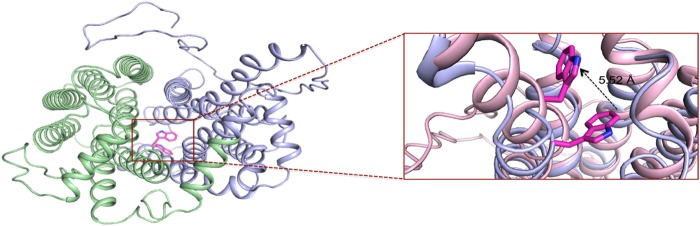
A comparison of the SLC2A9 model with the SLC2A1 structure indicates an excellent structural agreement with a root mean square deviation of 0.49 Å over 442 C-α atoms excluding variable amino and carboxyl terminals. A central amphipathic pore 30 Å deep is formed by two interior pairs of symmetry-related helices (TM1/TM4 and TM7/TM10) that are surrounded by an outer ring of helices, TM2, TM5, TM8, and TM11. A higher root mean square deviation of 0.32 Å is obtained when the pore region of SLC2A9 is aligned with those in SLC2A1, which underlies functional conservation. Both TM7 and TM10 are discontinuous helices having a non helical hinge-region. This structural element plays a significant role in conformational changes during substrate transport. Main structural features of SLC2A9 and SLC2A1 are very similar; however, the size of this hinge region in SLC2A9 is different than SLC2A1, smaller for TM7 and larger for TM10. These subtle differences can account for isoform-specific transport properties. Fig. 6D shows that in SLC2A9, Ile-335 is located in TM7 and faces away from the binding and translocation pore, in contrast to our earlier hypothesis (18). This residue interacts with two residues in helix 10 to form an intricate hydrophobic patch. Conversion of this residue to valine disrupts these interactions (Fig. 6E). Because substitution of this residue in SLC2A5 has also been shown to affect fructose and urate transport (17), SLC2A5 was also modeled based on SLC2A1, with models being made of the equivalent isoleucine to valine mutations (Fig. 6, F and G). The SLC2A5 shares 41.7% sequence identity and 56.1 similarity with SLC2A1 (28), resulting in a model with a root mean square deviation of 0.81Å. As with SLC2A9, a mutation of Ile to Val disrupts important hydrophobic linkages of TM7 with helices at the outer edge of the transporter.
Structural analysis of the Trp-110 residue indicates it is located on TM2, and the indole ring of the residue faces toward the substrate recognition and translocation pore. We compared side chain orientations of key residues in all five top scoring models. The Ile-335 side chain position was nearly identical in all the models; however, Trp-110 adopted multiple orientations within the pore (Fig. 7). The kinetic data suggest that this residue may be involved in substrate binding, as urate transport is greatly reduced when this residue is mutated to alanine.
FIGURE 7.
Analysis of tryptophan 110 orientation within the translocation pore of hSLC2A9. A schematic representation of the extracellular face of two SLC2A9 homology models, with the two halves of six helical bundles colored in green and purple, indicate that the Trp-110 residue is located within the substrate translocation pore of the transporter. Furthermore, it was noted among the molecular models generated, Trp-110 was observed in different orientations within the pore, suggesting a possible role of Trp-110 side chain movements during the transport cycle.
Discussion
Hydrophobic residues are well known determinants in protein structure-function relationships. Residues such as isoleucine, valine, leucine, and phenylalanine are often clustered within active sites (29). For example, SLC2A1 has a leucine (Leu-279) within the most conserved motif QLS in GLUTs adjacent to the postulated “bottle-neck” region of the substrate transport pathway (30), and valine 165 is also predicted to be located near the exofacial surface of the substrate binding site (31). Subsequently, Manolescu et al. (17) proposed that an isoleucine in TM7 is a critical determinant of substrate selection in class 2 hSLC2As (5, 7, 9, and 11). They found that substituting an isoleucine for valine at the equivalent position within these proteins significantly reduces or abolishes fructose transport while not affecting glucose fluxes (17). Dietvorst et al. (32) also demonstrated that isoleucine 374 in TM7 of Snf3 is essential for fructose sensing in yeast Saccharomyces cerevisiae but does not affect their glucose sensing. Given that hSLC2A9 also transports urate, this study was designed to examine the effect of this I-V substitution on urate transport and the trans-stimulation behavior between hexoses and the organic anion. In addition, our earlier prediction that isoleucine or valine might form a hydrophobic interaction across the translocation pore with a tryptophan in TM2 led us to also investigate the role of this residue (Trp-110).
The electrogenic property of urate transport by hSLC2A9 allows further characterization of urate fluxes by measuring the urate-induced current. The representative trace from the Gap-free protocol of WT hSLC2A9-expressed oocytes shows a typical urate-induced current trace in which a fast occurrence of outward current is followed by a slow decline to a plateau (Fig. 2A). This observation was previously reported in both Bibert et al. (33) and our studies (14). We propose that there must be a rapid accumulation of the entered urate in the proximity of the inner face of the oocyte surface membrane. Previous studies have reported that this phenomenon corresponds to the presence of a so-called “unstirred layer” due to the slower urate diffusion away from the membrane than the rate of urate entry (34). This leads to a decreased chemical gradient/driving force for urate entry, thereby resulting in a decreasing current from its peak value. In fact, this reduced current at the plateau must be the net result of two opposing currents: influx of extracellular urate and efflux of urate from the unstirred layer, which represents a steady state condition of the unstirred layer. However, upon extracellular urate withdrawal, only the latter is present, corresponding to the observed undershooting currents, which quickly vanished, likely due to exhaustion of the urate within the cytoplasmic unstirred layer. Thus, the concept of the presence of an accumulated urate proximal to the inner face of the surface membrane is in agreement with the time course of these events.
The urate kinetics and I-V curves determined by TEVC matched the isotopic flux confirming that both WT hSLC2A9 and the I335V mutant transport urate similarly (Figs. 1A and 2B). However, it is not so easy to do a direct comparison of the transport properties from these two methods due to the different conditions achieved using the two techniques (Figs. 1B and 2C). In the flux study the oocyte membrane potential was not clamped; thus, entry of negatively charged urate into an oocyte should have quickly hyperpolarized the membrane potential, from an initial value of around −30 mV to a value of −50 mV or so, depending on the magnitude of the influx (14). The hyperpolarized voltage, representing a reduced driving force, thus decreased urate entry. This effect would increase as the urate concentration employed rose. In contrast, the oocyte membrane potential was held constant at −30 mV by a gap-free protocol during a TEVC experiment; hence, the chemical gradient becomes the dominant driving force for urate transport into the oocytes. Thus, the urate entry rate for a given concentration will differ between the two protocols. Nevertheless, one conclusion we could draw from the I-V curve experiments is that the more the membrane potential is depolarized, the higher the urate influx (Fig. 2D). This confirms our previous suggestion that the membrane potential is a driving force for hSLC2A9 to bind and translocate urate.
The Role of Isoleucine 335
Our flux trans-acceleration measurements indicate that both intracellular fructose and urate are capable of stimulating urate uptake into WT hSLC2A9-expressing oocytes. This could be explained by the Simple Carrier Model theory in which reorientation of an empty carrier from one side of the membrane to the other is the rate-limiting step (35, 36). That is, when a substrate is presented on the trans side of the membrane it will be energetically more favorable for the substrate-protein complex to reorient from the trans side to the cis side. A more recent study on another MFS protein, the lactose permease, LacY, also demonstrated that the empty protein is the rate-limiting step for sugar binding and transport. Smirnova et al. (37) found that sugar binding is energetically favorable for increasing the open probability of LacY to the periplasm. We observed a similar phenomenon in our trans-acceleration experiments in which both preloaded fructose and urate (trans) simulate [14C]urate hSLC2A9-mediated transport into (cis) the oocytes. Our data also suggest that Ile-335 of hSLC2A9 is necessary for urate/fructose trans-acceleration to occur during transport (Fig. 3). Fructose/urate stimulation was lost in the I335V mutant, whereas the urate/urate exchange remained unchanged. The reduction of fructose transport activity in the I335V mutant could thus lower the energy for the mutant transporter to reorient from the intracellular to extracellular side. Consequently, the trans-accelerating effect of fructose was lost. These data provide additional evidence for a role of Ile-335 in fructose permeation in a class II hSLC2A protein but that Ile-335 is not involved in urate transport in hSLC2A9 (Fig. 1A). Urate kinetics and urate/urate trans-acceleration were unaffected in I335V compared with the WT hSLC2A9, which supports our previous conclusion that fructose and urate share the same transporter, but they interact with the translocation pathway quite differently.
Until now hSLC2A9 is the only class II glucose transporter in which trans-acceleration behavior has been reported. Other members of class I, like hSLC2A1 and -3 but not hSLC2A2 and -4, have also been characterized for their ability to exchange hexoses in both oocyte and mammalian cell studies (38–41). Through the construction of chimeras between hSLC2A1 and -4, Vollers and Carruthers (38) found that TM6 of hSLC2A1 contains residues necessary for trans-acceleration with glucose-glucose exchange.
In the TEVC trans-stimulation study, we used the Gap-free protocol to detect urate efflux elicited inward currents by perfusing oocytes with fructose and fructose-free buffer. After preloading the oocytes with urate, we observed that extracellular fructose increased the urate-elicited inward current with WT hSLC2A9 but not with the I335V mutant (Fig. 4). Thus, our study has shown that Ile-335 in TM7 is an essential residue for fructose to accelerate urate movement in the opposite direction. This confirms that Ile-335 plays an important role in the ability of hSLC2A9 to transport fructose (17, 18).
Structural Modeling of hSLC2A9
In an early computer model of hSLC2A7 based on the GlpT structure (42), Manolescu et al. suggested that the isoleucine in the equivalent position (Ile-314) appeared to be located on TM7 within the extracellular vestibule facing the translocation pore. Consequently, they suggested that a hydrophobic residue at that site could either interact directly with substrates as they entered the pore or there could be a hydrophobic interaction across the pore with Trp-89 on TM2 (18).
However, our revised model of hSL2A9 based upon the recent crystal structure of human SLC2A1 indicates that this residue is not oriented toward the central pore. Instead, it appears to interact with residues on the adjacent TM 10 via an intricate hydrophobic network (Fig. 6D). Notably, our new hSLC9A model provides a higher degree of accuracy given that both SLC2A1 and SLC2A9 are in the same transporter classification from the same species, resulting in a considerable increase in sequence similarity with SLC2A1 compared with GlpT. The single amino acid changes in SLC2A9, I335V, decreased fructose transport but not glucose. A structural model for the mutant SLC2A9-I335V was also generated in which we observed an apparent loss of the hydrophobic contacts observed with isoleucine in the identical position (Fig. 6E). The structural model strongly suggests that via its hydrophobic network, Ile-335 affects the rigid body movement of one of the two six-helix bundles and subsequently the orientation of helix 7 in the translocation pore of the transporter. The alternating access model developed for MFS transporters proposes that the two six-helix bundles form the translocation pore and move through an occluded state to provide access of the substrate binding pocket to one side of the membrane or the other (38). This central isoleucine residue may promote a more rigid coupling of helix 7 to the other members of its helical bundle, altering how it faces the translocation pore and subsequently influencing its ability to bind fructose. In the I335V mutant this interaction appears to be weakened, changing the orientation of TM7, and hence the protein loses its ability to bind fructose.
A molecular model of SLC2A5 was also generated based on the SLC2A1 crystal structure to gain insight into how this residue influences substrate specificity among other family members. In the SLC2A5 model, this isoleucine promotes a more complex interaction with the surrounding helices 9, 10, and 12, essentially linking helix 7 to its half of the transporter (Fig. 6F). Similarly, when we modeled the same substitution in SLC2A5, the hydrophobic network was again lost (Fig. 6G). Together these observations suggest that this hydrophobic residue plays a crucial role in altering the different conformational states in the alternating access model and subsequently substrate specificity.
The Role of Tryptophan 110
Our new model also rules out an interaction of Trp-110 with Ile-335 but suggests that Trp-110 has a role in regulating substrate transport. As mentioned above, earlier modeling studies of hSLC2A7 suggested that Trp-85 in TM2 (equivalent to Trp-110 in hSLC2A9) might form a hydrophobic interaction with Ile-314 across the pore in TM7 serving as a preselection site in regulating fructose transport through hSLC2A7 (18). Our new model indicates interactions of Trp-110 in the central pore, and substitutions lead to altered transport, further suggesting a role in substrate pre-selection. However, at this stage it is unclear whether these observed effects are due to direct interaction with substrates or structural changes.
Such preselection mechanisms have also been observed for other transporters, and early crystal structures of LacY and SGLT1 showed that the indole ring of tryptophan/tyrosine is a common feature of sugar binding proteins, where the primary hydrophobic interaction occurs between sugar and the sugar binding sites (43, 44).
In the glucose transporter 1 (SLC2A1), tryptophans in TM10 and TM11 are known to be responsible for glucose transport activity and substrate binding (45, 46). Also, a docking study indicated that Trp-65 formed a direct interaction with the C6 of glucose (47). In addition, a tryptophan residue mutation had been identified in another urate transporter, hSLC22A12, as a major cause in hypouricemia in Japanese patients (48). These observations support the view that Trp-110 in hSLC2A9 could also be interacting with urate and/or fructose directly. Indeed when mutated to alanine (W110A) urate transport was affected substantially (Fig. 1A). The Km for urate uptake was reduced, indicating an increased affinity for the substrate, whereas at the same time the Vmax was very significantly reduced. However, despite these changes in urate kinetics, the urate/urate exchange was still present (Fig. 3).
The effect on urate transport could, therefore, result from a loss of a direct interaction between Trp-110 and the substrate or be a consequence of an altered structure of the protein. In the latter case, the time spent in the occluded state during the conformational change between the outward- and inward-facing states could be affected. W110A has very similar Km values in both TEVC and flux studies, suggesting that varying the intracellular membrane potential did not affect how W110A handles urate transport. We were also interested in determining whether urate and fructose transport would still be maintained when Trp-110 is mutated into another aromatic residue. Therefore, we constructed a third mutant of hSLC2A9, tryptophan 110 into phenylalanine (W110F). We observed that W110F partially reduced urate transport with a lower Vmax and smaller Km compare with WT, whereas these values are higher when compared with W110A (Fig. 1). This indicated that W110F has higher capacity and lower affinity for urate when compare with W110A. In addition, the trans-stimulation experiment data demonstrated that both urate/urate and urate/fructose exchange were maintained in W110F. This indicated that the aromatic ring structure is not only important for urate transport but also fructose transport at this Trp-110 position of hSLC2A9 (Figs. 3 and 4).
These data support our hypothesis that either these electronic rich aromatic rings form direct interactions with the charged substrates during transport or they are involved in maintaining protein structure by interacting with other residues in the protein. With a partially altered the ring structure, W110F maintains the primary hydrophobic interaction with the substrates; thus, it is still able to transport both urate and fructose. In contrast, W110A has no aromatic ring in the residue; hence, it was not able to sense changes in the ionic environment and influence the urate/fructose transport properties. All these data imply that the bulky side chain of tryptophan is essential for urate transport in hSLC2A9.
Additional analysis of structural models generated using I-TASSER indicated a considerable degree of flexibility for the Trp-110 residue in the pore region (Fig. 7), again suggesting that it may play a role in substrate binding, selectivity, or occlusion. Transition of SLC2A9 from an outward-facing to an inward-facing conformation through an occluded state is possibly associated with conformational changes in the inner pore region, which might involve the repositioning of the Trp-110 side chain. Fig. 7 suggests that the indole ring of tryptophan could act as a lid between the protein's central cavity and the extracellular face, which could serve as a “thin gating element” similar to that proposed for other sugar transporters, like vSGLT (49). MFS transporters are known to have several mechanisms for substrate occlusion and permeation. Common denominators in all these structures include an extracellular facing thin gate that plays a role in providing access to the primary substrate binding site. We propose Trp-110 could play such a role in controlling access to the primary binding site and could be one of the residues forming a thin gate. In addition it could also serve as a closure to prevent urate escaping from the binding site before the protein changed from an outward to an inward conformation avoiding a futile cycle. However, several crystal structures are needed to determine the precise nature of the role of Trp-110.
Although many studies indicate that hSLC2A9 is primarily a urate transporter, its ability to transport hexoses should not be ignored. Our studies have demonstrated hSLC2A9 cannot only transport both hexoses and urate but can also exchange the two different types of substrate. There is an obvious implication in that hSLC2A9 could serve as an excellent candidate in regulating both blood sugar and urate in humans. For example, Emmerson (50) pointed out that when fructose is given orally it causes an increase in urate excretion in the urine of children. hSLC2A9 is expressed in both the proximal convoluted tubule and collecting duct in human kidney nephrons, sites where both sugars and urate are handled (51–54). Therefore, understanding the mechanism of how hSLC2A9 can exchange hexoses and urate in the human kidney will be valuable for developing new treatments for patients with hyperuricemia or hyperglycemia.
In summary, this study has further demonstrated that the hydrophobic residues, isoleucine 335 and tryptophan 110, of hSLC2A9 are important residues influencing both hexose and urate transport. Future studies of hSLC2A9 substrate selectivity and specificity will provide an even better understanding of urate transport and its regulation and hence the causation of hyperuricemia. A series of crystal structures is needed to determine the exact roles of both residues within hSLC2A9. Furthermore, understanding the hSLC2A9 binding sites for urate and hexoses could help to provide a pharmacological basis for effective treatment of hyperuricemia and other related diseases, such as gout, hypertension, and diabetes.
Acknowledgment
We thank Kyla Smith for technical support of electrophysiology studies.
This work was supported by Canadian Institutes of Health Research.
- SLC2A
- solute carrier gene family 2A
- hSLC2A9
- human glucose transporter 9
- STM
- sodium containing transport medium
- TEVC
- two electrode voltage clamp
- ICH
- intracellular helical bundle
- GlpT
- glycerol 3-phosphate transporter
- ANOVA
- analysis of variance
- TM
- transmembrane domain.
References
- 1. Joost H. G., Thorens B. (2001) The extended GLUT-family of sugar/polyol transport facilitators: nomenclature, sequence characteristics, and potential function of its novel members. Mol. Membr. Biol. 18, 247–256 [DOI] [PubMed] [Google Scholar]
- 2. Hirai T., Heymann J. A., Maloney P. C., Subramaniam S. (2003) Structural model for 12-helix transporters belonging to the major facilitator superfamily. J. Bacteriol. 185, 1712–1718 [DOI] [PMC free article] [PubMed] [Google Scholar]
- 3. Carruthers A., DeZutter J., Ganguly A., Devaskar S. U. (2009) Will the original glucose transporter isoform please stand up! Am. J. Physiol. Endocrinol. Metab. 297, E836–E848 [DOI] [PMC free article] [PubMed] [Google Scholar]
- 4. Cura A. J., Carruthers A. (2012) Role of monosaccharide transport proteins in carbohydrate assimilation, distribution, metabolism, and homeostasis. Compr. Physiol. 2, 863–914 [DOI] [PMC free article] [PubMed] [Google Scholar]
- 5. Phay J. E., Hussain H. B., Moley J. F. (2000) Cloning and expression analysis of a novel member of the facilitative glucose transporter family, SLC2A9 (GLUT9). Genomics 66, 217–220 [DOI] [PubMed] [Google Scholar]
- 6. Kimura T., Takahashi M., Yan K., Sakurai H. (2014) Expression of SLC2A9 isoforms in the kidney and their localization in polarized epithelial cells. PLoS ONE 9, e84996. [DOI] [PMC free article] [PubMed] [Google Scholar]
- 7. Matsuo H., Chiba T., Nagamori S., Nakayama A., Domoto H., Phetdee K., Wiriyasermkul P., Kikuchi Y., Oda T., Nishiyama J., Nakamura T., Morimoto Y., Kamakura K., Sakurai Y., Nonoyama S., Kanai Y., Shinomiya N. (2008) Mutations in glucose transporter 9 gene SLC2A9 cause renal hypouricemia. Am. J. Hum. Genet. 83, 744–751 [DOI] [PMC free article] [PubMed] [Google Scholar]
- 8. Cannon P. J., Stason W. B., Demartini F. E., Sommers S. C., Laragh J. H. (1966) Hyperuricemia in primary and renal hypertension. N. Engl. J. Med. 275, 457–464 [DOI] [PubMed] [Google Scholar]
- 9. Puig J. G., Ruilope L. M. (1999) Uric acid as a cardiovascular risk factor in arterial hypertension. J. Hypertens. 17, 869–872 [DOI] [PubMed] [Google Scholar]
- 10. Johnson R. J., Kang D. H., Feig D., Kivlighn S., Kanellis J., Watanabe S., Tuttle K. R., Rodriguez-Iturbe B., Herrera-Acosta J., Mazzali M. (2003) Is there a pathogenetic role for uric acid in hypertension and cardiovascular and renal disease? Hypertension 41, 1183–1190 [DOI] [PubMed] [Google Scholar]
- 11. Onat A., Uyarel H., Hergenç G., Karabulut A., Albayrak S., Sari I., Yazici M., Kele I. (2006) Serum uric acid is a determinant of metabolic syndrome in a population-based study. Am. J. Hypertens. 19, 1055–1062 [DOI] [PubMed] [Google Scholar]
- 12. Bo S., Cavallo-Perin P., Gentile L., Repetti E., Pagano G. (2001) Hypouricemia and hyperuricemia in type 2 diabetes: two different phenotypes. Eur. J. Clin. Invest. 31, 318–321 [DOI] [PubMed] [Google Scholar]
- 13. Caulfield M. J., Munroe P. B., O'Neil D., Witkowska K., Charchar F. J., Doblado M., Evans S., Eyheramendy S., Onipinla A., Howard P., Shaw-Hawkins S., Dobson R. J., Wallace C., Newhouse S. J., Brown M., Connell J. M., Dominiczak A., Farrall M., Lathrop M., Samani N. J., Kumari M., Marmot M., Brunner E., Chambers J., Elliott P., Kooner J., Lann M., Org E., Veldre G., Viigimmaa M., Cappuccio F. P., Ji C., Iacone R., Strazzullo R., Moley K. H., Cheeseman C. (2008) SLC2A9 is a high capacity urate transporter in humans. PLoS ONE 5, 1509–1523 [DOI] [PMC free article] [PubMed] [Google Scholar]
- 14. Witkowska K., Smith K. M., Yao S. Y., Ng A. M., O'Neill D., Karpinski E., Young J. D., Cheeseman C. I. (2012) Human SLC2A9a and SLC2A9b isoforms mediate electrogenic transport of urate with different characteristics in the presence of hexoses. Am. J. Physiol. Renal. Physiol. 303, F527–F539 [DOI] [PMC free article] [PubMed] [Google Scholar]
- 15. Mueckler M., Thorens B. (2013) The SLC2 (GLUT) family of membrane transporters. Mol. Aspects Med. 34, 121–138 [DOI] [PMC free article] [PubMed] [Google Scholar]
- 16. Deng D., Xu C., Sun P., Wu J., Yan C., Hu M., Yan N. (2014) Crystal structure of the human glucose transporter GLUT1. Nature 510, 121–125 [DOI] [PubMed] [Google Scholar]
- 17. Manolescu A. R., Augustin R., Moley K., Cheeseman C. (2007) A highly conserved hydrophobic motif in the exofacial vestibule of fructose transporting SLC2A proteins acts as a critical determinant of their substrate selectivity. Mol. Membr. Biol. 24, 455–463 [DOI] [PubMed] [Google Scholar]
- 18. Manolescu A., Salas-Burgos A. M., Fischbarg J., Cheeseman C. I. (2005) Identification of a hydrophobic residue as a key determinant of fructose transport by the facilitative hexose transporter SLC2A7 (GLUT7). J. Biol. Chem. 280, 42978–42983 [DOI] [PubMed] [Google Scholar]
- 19. Wang Q., Dai X. Q., Li Q., Tuli J., Liang G., Li S. S., Chen X. Z. (2013) Filamin interacts with epithelial sodium channel and inhibits its channel function. J. Biol. Chem. 288, 264–273 [DOI] [PMC free article] [PubMed] [Google Scholar]
- 20. Zhang Y. (2008) I-TASSER servers of protein 3D. BMC Bioinformatics 9, 40. [DOI] [PMC free article] [PubMed] [Google Scholar]
- 21. Laskowski R. A., MacArthur M. W., Moss D. S., Thornton J. M. (1993) Procheck: a program to check the stereochemical quality of protein structures. J. Appl. Crystallogr. 26, 283–291 [Google Scholar]
- 22. Sievers F., Wilm A., Dineen D., Gibson T. J., Karplus K., Li W., Lopez R., McWilliam H., Remmert M., Söding J., Thompson J. D., Higgins D. G. (2011) Fast, scalable generation of high-quality protein multiple sequence alignments using Clustal Omega. Mol. Syst. Biol. 7, 539–545 [DOI] [PMC free article] [PubMed] [Google Scholar]
- 23. Robert X., Gouet P. (2014) Deciphering key features in protein structures with the new ENDscript server. Nucleic Acids Res. 42, W320–W324 [DOI] [PMC free article] [PubMed] [Google Scholar]
- 24. Augustin R. (2010) The protein family of glucose transport facilitators: it's not only about glucose after all. IUBMB Life 62, 315–333 [DOI] [PubMed] [Google Scholar]
- 25. Sun L., Zeng X., Yan C., Sun X., Gong X., Rao Y., Yan N. (2012) Crystal structure of a bacterial homologue of glucose transporters GLUT1–4. Nature 490, 361–366 [DOI] [PubMed] [Google Scholar]
- 26. Iancu C. V., Zamoon J., Woo S. B., Aleshin A., Choe J.-Y. (2013) Crystal structure of a glucose/H+ symporter and its mechanism of action. Proc. Natl. Acad. Sci. U.S.A. 110, 17862–17867 [DOI] [PMC free article] [PubMed] [Google Scholar]
- 27. Madej M. G., Sun L., Yan N., Kaback H. R. (2014) Functional architecture of MFS d-glucose transporters. Proc. Natl. Acad. Sci. U.S.A. 111, E719–E727 [DOI] [PMC free article] [PubMed] [Google Scholar]
- 28. Kayano T., Burant C. F., Fukumoto H., Gould G. W., Fan Y. S., Eddy R. L., Byers M. G., Shows T. B., Seino S., Bell G. I. (1990) Human facilitative glucose transporters: isolation, functional characterization, and gene localization of cDNAs encoding an isoform (GLUT5) expressed in small intestine, kidney, muscle, and adipose tissue and an unusual glucose transporter pseudogene-like sequence (GLUT6). J. Biol. Chem. 265, 13276–13282 [PubMed] [Google Scholar]
- 29. Jayaraj V., Suhanya R., Vijayasarathy M., Anandagopu P., Rajasekaran E. (2009) Role of large hydrophobic residues in proteins. Bioinformation 3, 409–412 [DOI] [PMC free article] [PubMed] [Google Scholar]
- 30. Seatter M. J., De la Rue S. A., Porter L. M., Gould G. W. (1998) QLS motif in transmembrane helix VII of the glucose transporter family interacts with the C-1 position of d-glucose and is involved in substrate selection at the exofacial binding site. Biochemistry 37, 1322–1326 [DOI] [PubMed] [Google Scholar]
- 31. Mueckler M., Makepeace C. (1997) Identification of an amino acid residue that lies between the exofacial vestibule and exofacial substrate-binding site of the Glut1 sugar permeation pathway. J. Biol. Chem. 272, 30141–30146 [DOI] [PubMed] [Google Scholar]
- 32. Dietvorst J., Karhumaa K., Kielland-Brandt M. C., Brandt A. (2010) Amino acid residues involved in ligand preference of the Snf3 transporter-like sensor in Saccharomyces cerevisiae. Yeast 27, 131–138 [DOI] [PubMed] [Google Scholar]
- 33. Bibert S., Hess S. K., Firsov D., Thorens B., Geering K., Horisberger J.-D., Bonny O. (2009) Mouse GLUT9: evidences for a urate uniporter. Am. J. Physiol. Renal. Physiol. 297, F612–F619 [DOI] [PubMed] [Google Scholar]
- 34. Hill W. G., Southern N. M., MacIver B., Potter E., Apodaca G., Smith C. P., Zeidel M. L. (2005) Isolation and characterization of the Xenopus oocyte plasma membrane: a new method for studying activity of water and solute transporters. Am. J. Physiol. Renal Physiol. 289, F217–F224 [DOI] [PubMed] [Google Scholar]
- 35. Stein W. D. (1972) The mechanism of sugar transfer across erythrocyte membranes. Ann. N.Y. Acad. Sci. 195, 412–428 [PubMed] [Google Scholar]
- 36. Widdas W. F. (1952) Inability of diffusion to account for placental glucose transfer in the sheep and consideration of the kinetics of a possible carrier transfer. J. Physiol. 118, 23–39 [DOI] [PMC free article] [PubMed] [Google Scholar]
- 37. Smirnova I., Kasho V., Kaback H. R. (2011) Lactose permease and the alternating access mechanism. Biochemistry 50, 9684–9693 [DOI] [PMC free article] [PubMed] [Google Scholar]
- 38. Vollers S. S., Carruthers A. (2012) Sequence determinants of GLUT1-mediated accelerated-exchange transport: analysis by homology-scanning mutagenesis. J. Biol. Chem. 287, 42533–42544 [DOI] [PMC free article] [PubMed] [Google Scholar]
- 39. Sweet I. R., Matschinsky F. M. (1997) Are there kinetic advantages of GLUT2 in pancreatic glucose sensing? Diabetologia 40, 112–119 [DOI] [PubMed] [Google Scholar]
- 40. Maher F., Davies-Hill T. M., Simpson I. A. (1996) Substrate specificity and kinetic parameters of GLUT3 in rat cerebellar granule neurons. Biochem. J. 315, 827–831 [DOI] [PMC free article] [PubMed] [Google Scholar]
- 41. Taylor L. P., Holman G. D. (1981) Symmetrical kinetic parameters for 3-O-methyl-d-glucose transport in adipocytes in the presence and in the absence of insulin. Biochim. Biophys. Acta 642, 325–335 [DOI] [PubMed] [Google Scholar]
- 42. Huang Y., Lemieux M. J., Song J., Auer M., Wang D. N. (2003) Structure and mechanism of the glycerol 3-phosphate transporter from Escherichia coli. Science 301, 616–620 [DOI] [PubMed] [Google Scholar]
- 43. Abramson J., Smirnova I., Kasho V., Verner G., Kaback H. R., Iwata S. (2003) Structure and mechanism of the lactose permease of Escherichia coli. Science 301, 610–615 [DOI] [PubMed] [Google Scholar]
- 44. Faham S., Watanabe A., Besserer G. M., Cascio D., Specht A., Hirayama B. A., Wright E. M., Abramson J. (2008) The crystal structure of a sodium galactose transporter reveals mechanistic insights into Na+/sugar symport. Science 321, 810–814 [DOI] [PMC free article] [PubMed] [Google Scholar]
- 45. Katagiri H., Asano T., Shibasaki Y., Lin J. L., Tsukuda K., Ishihara H., Akanuma Y., Takaku F., Oka Y. (1991) Substitution of leucine for tryptophan 412 does not abolish cytochalasin B labeling but markedly decreases the intrinsic activity of GLUT1 glucose transporter. J. Biol. Chem. 266, 7769–7773 [PubMed] [Google Scholar]
- 46. Katagiri H., Asano T., Ishihara H., Lin J. L., Inukai K., Shanahan M. F., Tsukuda K., Kikuchi M., Yazaki Y., Oka Y. (1993) Role of tryptophan-388 of GLUT1 glucose transporter in glucose-transport activity and photoaffinity-labelling with forskolin. Biochem. J. 291, 861–867 [DOI] [PMC free article] [PubMed] [Google Scholar]
- 47. Salas-Burgos A., Iserovich P., Zuniga F., Vera J. C. (2004) Predicting the three-dimensional structure of the human facilitative glucose transporter glut1 by a novel evolutionary homology strategy: insights on the molecular mechanism of substrate migration, and binding sites for glucose and inhibitory molecule. Biophys. J. 87, 2990–2999 [DOI] [PMC free article] [PubMed] [Google Scholar]
- 48. Komoda F., Sekine T., Inatomi J., Enomoto A., Endou H., Ota T., Matsuyama T., Ogata T., Ikeda M., Awazu M., Muroya K., Kamimaki I., Igarashi T. (2004) The W258X mutation in SLC22A12 is the predominant cause of Japanese renal hypouricemia. Pediatr. Nephrol. 19, 728–733 [DOI] [PubMed] [Google Scholar]
- 49. Krishnamurthy H., Piscitelli C. L., Gouaux E. (2009) Unlocking the molecular secrets of sodium-coupled transporters. Nature 459, 347–355 [DOI] [PMC free article] [PubMed] [Google Scholar]
- 50. Emmerson B. T. (1974) Effect of oral fructose on urate production. Ann. Rheum. Dis. 33, 276–280 [DOI] [PMC free article] [PubMed] [Google Scholar]
- 51. Stein W. D. (1986) Transport and Diffusion across Cell Membranes, p. 31, Academic Press, Inc., San Diego, CA [Google Scholar]
- 52. Cheeseman C. (2009) Solute carrier family 2, member 9 and uric acid homeostasis. Curr. Opin. Nephrol. Hypertens. 18, 428–432 [DOI] [PubMed] [Google Scholar]
- 53. Komala M. G., Panchapakesan U., Pollock C., Mather A. (2013) Sodium glucose cotransporter 2 and the diabetic kidney. Curr. Opin. Nephrol. Hypertens. 22, 113–119 [DOI] [PubMed] [Google Scholar]
- 54. Johnson R. J., Sanchez-Lozada L. G., Nakagawa T. (2010) The effect of fructose on renal biology and disease. J. Am. Soc. Nephrol. 21, 2036–2039 [DOI] [PubMed] [Google Scholar]