

Abstract

Molecular dynamics (MD) simulations for RNA tetramers r(AAAA), r(CAAU), r(GACC), and r(UUUU) are benchmarked against 1H–1H NOESY distances and 3J scalar couplings to test effects of RNA torsion parametrizations. Four different starting structures were used for r(AAAA), r(CAAU), and r(GACC), while five starting structures were used for r(UUUU). On the basis of X-ray structures, criteria are reported for quantifying stacking. The force fields, AMBER ff99, parmbsc0, parm99χ_Yil, ff10, and parmTor, all predict experimentally unobserved stacks and intercalations, e.g., base 1 stacked between bases 3 and 4, and incorrect χ, ϵ, and sugar pucker populations. The intercalated structures are particularly stable, often lasting several microseconds. Parmbsc0, parm99χ_Yil, and ff10 give similar agreement with NMR, but the best agreement is only 46%. Experimentally unobserved intercalations typically are associated with reduced solvent accessible surface area along with amino and hydroxyl hydrogen bonds to phosphate nonbridging oxygens. Results from an extensive set of MD simulations suggest that recent force field parametrizations improve predictions, but further improvements are necessary to provide reasonable agreement with NMR. In particular, intramolecular stacking and hydrogen bonding interactions may not be well balanced with the TIP3P water model. NMR data and the scoring method presented here provide rigorous benchmarks for future changes in force fields and MD methods.
1. Introduction
RNA is being increasingly recognized as important for many functions in the cell1−6 and as a potential target for therapeutics.7−11 Molecular dynamics (MD) simulations can be used to predict structure,12,13 mechanism,14 and dynamics15−18 which can then provide insight into function. RNA MD has been done both atomistically19−21 and with coarse-graining22 and has a wide spectrum of applications.23−34
MD uses computationally inexpensive classical mechanics to approximate molecular movements and equilibria.35 In MD simulations, potential energy is expressed in terms of bond lengths, angles between bonds, torsion angles, Lennard-Jones,36 and Coulomb pairwise interactions. RNA parametrizations have been developed for CHARMM37 and AMBER35,38−40 MD packages. The lack of consistent agreement between MD simulations of RNA and experimental results, however, has revealed weaknesses in force field parameters. For example, reparametrizations of torsion terms have improved agreement with experiment.41−44 Additionally, the Lennard-Jones term between bases12,45,46 may not be optimal and not well balanced with solution.
Here, MD simulations with AMBER parm99,39 parmbsc0,41 parm99χ_Yil,42 ff10,43 and parmTor44 force fields are tested against NMR spectra for RNA tetramers r(AAAA), r(CAAU), r(GACC),47−49 and r(UUUU), similarly to previous work done on proteins.50,51 Tetramers were chosen to minimize NMR overlap, ensuring that NOE cross-peaks between sugars and bases could be identified relatively easily and a maximum number of 3J coupling constants could be measured. Solvated tetramers are relatively small systems compared to biologically relevant RNAs, enabling more rapid computations than possible with larger systems. Sequences were chosen to preclude duplex formation in NMR experiments because single-stranded systems allow conformational freedom and thus rigorous testing of particular aspects of the force field. The temperature dependence of 1D NMR spectra showed that r(CAAU)52 and r(GACC)47 do not exhibit cooperative transitions and thus are single-stranded in solution. While intramolecular base–base hydrogen bonding is theoretically possible in a tetramer,49 there is no NMR evidence for it in the tetramers studied here. Thus, the comparisons focus on other aspects of the force field.
Poly(A) stacks strongly,53 while poly(U) is unstacked in aqueous solution as shown by light scattering, viscometry, sedimentation velocity,54,55 and SAXS and smFRET,56 so each force field’s predictions of stacking were tested as well on r(AAAA) and r(UUUU). Three-dimensional RNA structures tend to be A-form in Watson–Crick57 base-paired regions, but single stranded regions can be variable.58−62 Thus, accurate modeling of single-stranded regions requires accurate force field parametrization. Comparisons between MD simulations and experiments for a few systems indicate this has yet to be achieved.47,49,63 The results presented here expand the sequence dependence of comparisons and provide working hypotheses for potential improvements in force fields.
1.1. RNA Force Field Parametrizations
The force fields use different nucleic acid backbone torsion64 energy functions, as briefly described below and in Figures 1 and 2 and Table 1.
-
I.
ff99.39 In vacuo MP2/6-31G(d)68,69 quantum mechanics (QM) was used to estimate the χ torsion energy profiles for a small model system designed to mimic DNA rather than RNA and did not include the entire sugar. The atoms were arranged to model a C2′–endo sugar pucker, rather than RNA’s preferred C3′–endo sugar pucker.65 AMBER ff99 has been used extensively in diverse applications.70−75
-
II.
parmbsc0.41 Using a larger model system than the original parm99, a similar MP2/6-31G(d) potential energy surface scan was done to model DNA α/γ backbone torsions, resulting in more accurate and longer time scale simulations for many DNA and RNA sequences.76−79
-
III.
parm99χ_Yil.42,47 Complete RNA nucleoside model systems were used to gain more accurate χ energy profiles with MP2/6-31G(d) QM. The new parameters result in increased barrier heights around χ and alter the equilibria to favor T, or anti χ, orientations. This greatly improved agreement with NMR spectra for cytosine, uridine,42 and r(GACC).47
-
IV.
ff10,43 also known as “parmOL”. This force field used MP2 theory68 with the complete basis set extrapolation80,81 and a COSMO solvation model82 to reparametrize χ at a higher QM level than parm99χ_Yil. FF10 includes parmbsc0’s revised α/γ. This improved simulation accuracy for several tetraloop hairpins, especially by preventing ladder-like structures.83
-
V.
parmTor.44 New β, ϵ, and ζ torsion profiles were generated with methods similar to parm99χ_Yil. ParmTor also incorporates parmbsc0’s α and γ parameters and was able to improve prediction of the differences in thermodynamic stability of tetramer duplexes formed by G–C or isoG–isoC base pairs, where isoG and isoC have amino and carbonyl groups transposed relative to G and C.
Figure 1.
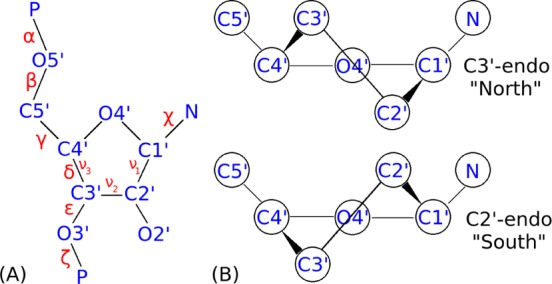
RNA atom names and torsions64,65 are defined in panel A. Note that δ = C5′–C4′–C3′–O3′ while ν3 = C2′–C3′–C4′–O4′. Panel B illustrates C3′–endo (N) and C2′–endo (S) conformations. Hydrogens have been omitted for clarity.66
Figure 2.
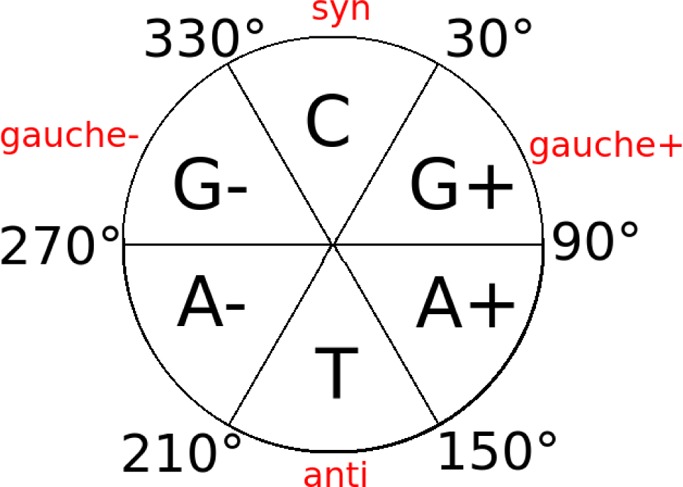
Table 1. Summary of Force Field Torsion Reparametrizations Relative to AMBER ff99a.
2. Methods
2.1. NMR
Tetramers, r(AAAA) and r(UUUU), were synthesized in Poznan and 1.3 μmol of r(CAAU) was purchased from Dharmacon. Samples were dissolved in 300 μL of 30 mM phosphate buffer, 150 mM NaCl, and 0.5 mM Na2EDTA, at pH 7.4 in water. The buffer was vacuum centrifuged twice with 600 μL of 99% D2O (Cambridge Isotope Laboratories) and finally dissolved in 99.99% D2O (Cambridge Isotope Laboratories). r(GACC) 1H chemical shift assignments and NOESY volumes84 are from Yildirim et al.47 A r(GACC) 1H–13C HMQC85,86 spectrum was collected on a Varian Inova 500 MHz spectrometer, as 13C chemical shifts have been shown to differentiate χG+ and χT.87All tetramers’ spectra were collected at 2 °C to maximize NOE volumes. 1H–1H NOE, 1H–31P HETCOR, and 1H–13C HMQC data for r(CAAU) were collected on a Varian Inova 600 MHz spectrometer and processed with NMRPipe.88 r(AAAA), r(CAAU), and r(UUUU) NOESY spectra were collected at 200, 400, 600, and 800 ms with 31P decoupling to minimize overlap and maximize signal-to-noise of H3′, H5′, and H5″. NOESY spectra at 2 °C and an 800 ms mixing time were obtained with and without 31P decoupling on a Varian Inova 600 MHz spectrometer to determine 3JH5′–P5′, 3JH5″–P5′, and 3JH3′–P3′. NOESY volumes, V, were integrated with the box method in Sparky 3.113.89
NMR distances between any 1H atoms i and j were calculated from eq 1,
| 1 |
Errors were quantified with eqs 1a and 1b.90,91
 |
1a |
| 1b |
The scaling constant c and standard deviation cSD were determined from the calculated scaling constants of known 1H–1H distances (Supporting Information Table 3). The x term was set to a minimum of 1.0 and increased until all of the known 1H–1H distances are within the error bounds (Supporting Information Table 4). Verr is the standard deviation of 20 randomly selected areas of the spectrum, each area approximately the same as the NOE cross-peak. To minimize the influence of spin-diffusion, 2D NOESYs with a mixing time of 200 ms were used for NOE volume measurements. Volume errors due to partial saturation effects are estimated to be within the error bounds.
The proportion of C2′/C3′-endo conformation of a sugar was estimated with eq 2.92 The derivation is shown in Supporting Information Section 2.1.
| 2 |
2.2. Molecular Dynamics
Multiple starting structures can test a force field’s ability to model an RNA accurately. For example, if a starting structure is in a conformation not present in a solution ensemble, then the force field should be able to correct that given enough time. In addition, for a converged simulation, the ensemble should not depend on starting structure. Therefore, multiple starting structures not representative of the experimental ensemble were used in assessing the force fields.
For all four tetramers, four starting structures were used, A-form (N-anti), N-syn, S-anti, and S-syn. Here “N” refers to a ribose C3′-endo pseudorotation phase angle,65 and “anti” or “syn” refers to the χ conformation (Figure 1). A-form starting structures were generated with nucgen97 and the others were generated (Figure 3) with a simulated annealing procedure.90,91 An additional starting structure called “>5 Å” was generated with >5 Å restraints on nH1′–(n + 1)H6 to provide a nonstacked structure expected for r(UUUU). All 17 structures were visually inspected to ensure no chiral inversions had occurred during simulated annealing. FF99 was run only with r(CAAU) and r(GACC), where its predictions were worse than parm99χ_Yil, as also seen with previous tests.42,44,47,90 Starting structures were solvated in an 8.65 Å TIP3P98 truncated octahedral box and run at 275 K to match NMR spectra. Each system was neutralized with three Na+ ions in AMBER’s LEAP program. Running times for all the 76 simulations range from 7.7 to 11.9 μs and are listed in Supporting Information Table 34. Details on NMR agreement of starting structures are presented in Supporting Information Section 7. This work tests four force fields (cf. Table 1) on four tetramers with each in four starting structures and a fifth for r(UUUU). Minimization, equilibration, and production runs of all tetramers followed a published protocol.91 AMBER input files are included in Supporting Information Section 6.
Figure 3.

MD starting structures for r(CAAU) and r(GACC). Image was generated with PyMOL 1.5.0.1.96
2.3. Comparison between MD and NMR
For an ensemble of conformations in rapid exchange, NOESY99 spectra report average properties. MD predictions are benchmarked against 1H–1H NOE volumes and 3J scalar couplings. MD predictions of 3J scalar couplings were given an error of ±1.5 Hz to account for measurement and Karplus function errors. Each structure starts at varying accuracy with regard to NMR spectra, and NMR agreement was scored after the first 500 ns of a simulation.
Each of the NMR observables was averaged over an MD simulation and the score graded as a percentage. This was done similarly to the Locked Nucleic Acid (LNA),100 L(CAAU),91 where 1H–1H MD distances were computed via eq 3:
| 3 |
where N is the number of MD trajectory points and ri is the distance at time i. The negative sixth power is necessary to weight the ensemble, as an arithmetic mean would would not model this effect. L(CAAU) was evaluated as the mean of distances calculated for each 20 ns interval, while here N represents the entire simulation. All reported NMR scores are for the entire simulation after 500 ns. To provide insight into the degree of predicted variation around an “average” structure as was done for L(CAAU), Supporting Information Section 8 contains plots of percentage NMR agreement for each 20 ns window vs simulation time. Here, eq 3 is used to evaluate all NOEs: measured, overlapped, and predicted but not observed.
-
I.
Measured NOEs have measured upper and lower distances, cf. Supporting Information Tables 12 and 13, which are calculated via eqs 1a and 1b.
-
II.
Overlapped NOEs are visible in NOESY spectra, but do not have reliable volume information. Overlapped NOEs are counted as accurate if the MD distance is <7.0 Å.
-
III.
Predicted but not observed NOEs, i.e., absent NOEs, are 1H–1H pairs predicted to have an NOE distance ≤5.0 Å but are not visible in NOESY spectra. All potential nonsequential internucleotide NOEs, between nucleotides 1–3, 1–4, and 2–4, are listed as possible NOEs. If an MD simulation predicts an NOE with average distance < 5.0 Å calculated via eq 3, but the predicted NOE is not observed in NOESY spectra, then the predicted NOE is scored as incorrect. This term is important because a large number of intercalated structures are predicted by MD but not observed by NMR. For example, many predicted structures have base 1 stacked between bases 3 and 4, forming a 3–1–4 intercalation, but no NOEs are observed between nucleotide 1 and nucleotides 3 and 4.
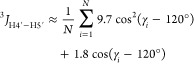
Sugar pucker can be quantified with three 3J scalar couplings following Marino’s nomenclature:101 ν1 = O1′–C1′–C2′–C3′, ν2 = C1′–C2′–C3′–C4′, and ν3 = C2′–C3′–C4′–O1′. Haasnoot parameters102,103 were replaced with parameters fit to empirical 1H–1H torsion angles from the UUCG tetraloop104 determined via dipolar cross-coupled relaxation rates105 (Supporting Information Section 4). Torsion angles and 3J were fit to a Karplus equation to yield eq 4. These functions are compared to Davies106 and Haasnoot102 predictions in Supporting Information Section 4. Here, all MD predictions for all ribose torsion angles are expressed as scalar couplings via eq 4:
| 4 |
where n is 1, 2, or 3, i is the MD trajectory point, and N is the total number of simulation data points.
Similarly, both 3J values associated with γ can be predicted:107
 |
5a |
| 5b |
Both values must be within error bounds of observed 3J to be counted correct. The reported error is the least of the two possible errors in Hz. Similarly for β,108,109
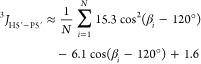 |
6a |
 |
6b |
 |
7 |
Note that all scalar coupling equations have numerous possible degeneracies.
Agreement between MD simulations and NMR spectra was quantified via eq 8, which is similar to positive predictive value.110
| 8 |
Without considering predicted but not observed NOEs, intercalated structures show unreasonably high NMR agreement.
2.4. Criteria for Stacking
A qualitative way to rapidly consider the structures generated during simulations is to score base stacking. While the word “stacking” is frequently used in RNA literature, there is no single definition. One definition states a “stacked” nucleotide has ≤4.0 Å between non-hydrogen atoms, dihedral angle between the planes of ≤30°, and overlap between the bases.111 Another stacking definition uses Cartesian coordinates63 but lacks a way to quantify the amount of stacking.
Here, we define stacking in terms of three criteria based on A-form X-ray structures (Figure 4 and Supporting Information Table 2). Each base plane is defined by vectors, a⃗ and b⃗, whose cross products a⃗ × b⃗ and b⃗ × a⃗ define each base’s normal vectors (Figure 4). Vectors a⃗ and b⃗ are far apart from one another to minimize out-of-plane distortions. For adenine, a⃗ is defined from the Center of Mass (CoM) to C8 and b⃗ is defined from the CoM to N6. Similarly, for guanosine a⃗ = (CoM → C8) and b⃗ = (CoM → O6). For cytosine, a⃗ = (CoM → O2) and b⃗ = (CoM → N6), and for uracil a⃗ = (CoM → O2) and b⃗ = (CoM → O6). As described below, the distance between CoMs and the angles, ω and χ, are used to provide a rough measure of stacking. Because Ξ can be positive or negative, depending on whether the base–base alignment is either relatively parallel or perpendicular (Figure 5), the stacking score ranges from 100% to −100%, respectively. Only positive percentages score as stacking.
-
I.
The first variable to consider whether two bases are “stacked” is the distance, d0, between their centers of mass. Based on CCSD(T) studies of uracil63 and adenine45 dimers, we consider bases to be unstacked if d0 > 5.0 Å. If d0 ≤ 3.5 Å, the stacking score is incremented +1 for d0. If 3.5 Å < d0 < 5.0 Å, then the score is decreased as r–3 from 1 to 0, where r is the distance between the centers of mass. If d0 > 5.0 Å, ω and Ξ are not computed. These distances were chosen based on X-ray statistics (Supporting Information Table 2).
-
II.The angle ω (“oh-mega” for “overlap”), is a measure of overlap between bases, analogous to the angle between steps on a staircase (Figures 4 and 5). The ω angle is defined in terms of
-
(a)the distance between the centers of mass (d0),
-
(b)the length of the 5′ base’s normal vector (d1), and
-
(c)the distance between the closest normal vector of the 5′ base to the 3′ base’s center of mass (d2).
If ω ≤ 25°, the stack score is incremented +1. If 25° < ω ≤ 50°, the score is linearly decreased from 1 to 0. These angles were chosen based on X-ray statistics (Supporting Information Table 2). If ω > 50°, the base is not considered “stacked” and Ξ is not computed.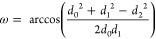
9 -
(a)
-
III.Ξ angles are the minimum angle between each base’s normal vectors (eq 10 and Figure 5). Ξ = 0° indicates vectors normal to each base plane are parallel, and the bases stack similarly to the shape of the Greek letter Ξ. The cross-product identity |a⃗ × b⃗| = |a⃗||b⃗| sin θ, where θ is the angle between vectors a⃗ and b⃗, implies Ξ can be computed via eq 10:
Ξ quantifies whether a given base pair is a parallel stack or T-shape. If 45.0° < χ < 135.0°, then the stack score is multiplied by −1, which indicates a T-shape.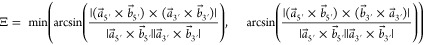
10
Figure 4.

PDB structure 157D(112) residues 13C and 14G shown to illustrate the distance, d0, as well as ω and Ξ angles used to quantify stacking. The 5′ and 3′ subscripts specify the 5′ and 3′ bases, respectively. For this case, d0 = 4.5 Å, ω = 40.7°, and Ξ = 17.3°.
Figure 5.
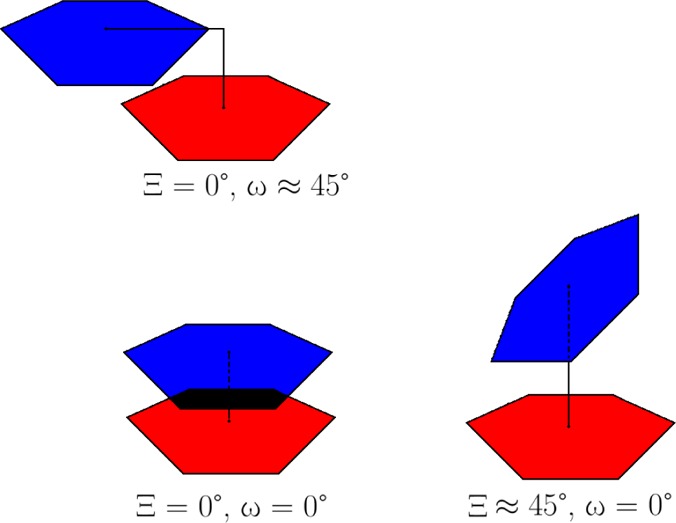
Ξ and ω compared.
The stack score by this method ranges from −2 to 2. It is reported as a percentage from −100% to 100%. Here, two bases are considered stacked if the stacking percentage is (>50%).
3. Results
3.1. NMR
Comparison of MD simulations with NMR spectra requires assignment of NMR resonances to particular atoms. Typical NOESY walk spectra for this purpose are shown in Figure 6 for r(AAAA), r(CAAU), and r(UUUU). Additional spectra are shown in Supporting Information Section 5. All 1H, 13C, and 31P measured chemical shifts are reported in Supporting Information Table 6. C atoms not bonded to H are not detected by HMQC and were not assigned. There was insufficient concentration to measure natural abundance 15N chemical shifts. Distances with upper and lower bounds from measured NOEs are shown in Supporting Information Tables 12 and 13.
Figure 6.

NOESY spectra for tetramers r(AAAA), r(CAAU), and r(UUUU) at 800 ms mixing time with 31P decoupling, drawn with Sparky 3.113.89 NOESY walks are outlined in red. r(GACC) spectra are from Yildirim et al.47 and are not repeated here. More images of NMR spectra are available in Supporting Information Section 5. Note that the dispersion of chemical shifts for r(UUUU) is much less than for r(AAAA) and r(CAAU), consistent with r(UUUU) residues having much more similar chemical environments.
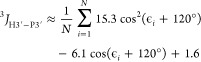
NMR scalar couplings provide information on torsion angles, which can be compared to MD simulations. All 3J scalar couplings are given in Table 2. All nonoverlapped 3JH5′/5″–P5′ couplings showed 90–100% fractions in the βT conformer,103 together with all three ϵ torsions being at approximately 210° (Table 2). All γ are majority γG+, as implied from Wijmenga’s Table 4.103 It is likely that 2H exchange with solvent and the lack of a phosphate group distort γ1 to a more highly populated γT state. Most 3JH1′–H2′ are ≤2 Hz, implying that sugar puckers are mostly C3′–endo in solution92 (Table 2). The exceptions are r(UUUU) and each 3′ terminal ribose, which show higher populations of C2′-endo. This is likely due to solvent exposure. For each tetramer, H1′, H2′, C1′, A and G H8 and C8, and C and U H6 chemical shifts (Supporting Information Table 6) imply that all four nucleotides are χT.87
Table 2. Torsional Parameters and/or 3J for A-Form RNA and Measured for Tetramersa.
| torsion | A-form101,104,113 | r(AAAA) | r(CAAU) | r(GACC) | r(UUUU) |
|---|---|---|---|---|---|
| β2 | T | 3.8, 1.0; T | 3.7, 2.2, ∼96% T | 3.7, 0.9; ∼100% T | 2.0, 2.0; ∼100% T |
| β3 | T | 3.0, 1.0; T | 3.5, <1, ∼100% T | 4.0, 2.0; ∼100% T | 2.0, 2.0; ∼100% T |
| β4 | T | 3.2, 1.0; T | 3.8–4.3, 3.3, ∼92% T | 4.4, 2.0; ∼95% T | 2.0, 2.0; ∼100% T |
| γ1 | G+ | 3.8, 2.0; ∼77% G+ | 1.6, ∼3.75, ∼82% G+ | 4.6, 2.3; ∼66% G+ | 3.7, 2.8; ∼70% G+ |
| γ2 | G+ | ∼2, ∼1; ∼100% G+ | ∼2.8,∼2.1; ∼87% G+ | ∼2, ∼2; ∼96% G+ | ≈2.5, ≈2.5; ∼86% G+ |
| γ3 | G+ | 2.0, 2.0; ∼96% G+ | 2.0, 1.3; ∼93% G+ | 1.5, <1; ∼100% G+ | <≈2.5, ≈2.5; ∼86% G+ |
| γ4 | G+ | 2.0, 2.0; ∼96% G+ | 1.0, <1; ∼70% G+ | 1.8, 1.3; ∼100% G+ | overlap |
| ϵ1 | 185–280° | 8.0–8.9; 207–233° | 9.4–9.8; 218–230° | 9.3; 213–230° | 8.2; 210–218° |
| ϵ2 | 185–280° | 8.6–8.8; 210–225° | 8.4; 211–219° | 9.1; 213–229° | 7.8; 207–215° |
| ϵ3 | 185–280° | 8.3–8.4; 209–221° | 8.3; 210–219° | 9.0; 212–227° | 7.7; 207–215° |
| ν11 | 0.2–1.3 | 2.0 | ≈1 | 1.8 | 4.5 |
| ν21 | 3.3–6.0 | 3.4 | 4.5 | 4.4 | 4.7 |
| ν31 | 8.8–11.5 | 5.4–6.0 | 8.4 | 7.9 | 5.3 |
| ν12 | 0.2–1.3 | 1.0 | ≈1 | <1 | 5.2 |
| ν22 | 3.3–6.0 | 3.6 | 4.6 | 4.4 | 4.6 |
| ν32 | 8.8–11.5 | 7.3 | 8.3 | 8.9 | 5.5 |
| ν13 | 0.2–1.3 | 1.0 | 1.4 | <1 | 5.2 |
| ν23 | 3.3–6.0 | 4.0 | 4.3 | 4.0 | 4.8 |
| ν33 | 8.8–11.5 | 8.0 | 8.2–8.4 | 8.8 | 5.4 |
| ν14 | 0.2–1.3 | 2.75 | 3.7 | 2.5 | 3.7 |
| ν24 | 3.3–6.0 | overlap | 3.7 | 4.6 | overlap |
| ν34 | 8.8–11.5 | 6.0 | overlap | 7.2 | overlap |
Backbone β, γ, and ϵ torsions observed via NMR fall within standard crystallographic A-form ranges (Table 2).1133J scalar couplings (Table 2) and NOESY distances (Supporting Information Table 13 and Supporting Information Figure 10) indicate that r(AAAA), r(GACC),47 and r(CAAU) are majority A-form in solution (see Methods). 31P chemical shifts are consistent with A-form for r(AAAA), r(CAAU), and r(GACC). Several NOEs in r(GACC),47 r(AAAA), and r(CAAU) suggest their 3′ nucleotide is sometimes inverted. Table 3 summarizes the number of NMR observables that can be compared to MD predictions. The most NOEs were seen with r(CAAU). Few were seen with r(UUUU), consistent with r(UUUU) likely being unstacked and/or disordered.
Table 3. Number of NMR Observablesa.
| tetramer | measured NOEs | overlap NOEs | β | γ | ribose | ϵ | total |
|---|---|---|---|---|---|---|---|
| r(AAAA) | 23 | 3 | 3 | 4 | 11 | 3 | 47 |
| r(CAAU) | 42 | 6 | 3 | 4 | 11 | 3 | 69 |
| r(GACC) | 23 | 9 | 3 | 4 | 12 | 3 | 54 |
| r(UUUU) | 1 | 5 | 3 | 3 | 10 | 3 | 25 |
Number of measured NOEs depends on how many 1H–1H pairs are visible in the spectrum (cf. Supporting Information Tables 12 and 13). The NOEs (cf. Section 2.3) and 3J scalar coupling allow a direct comparison between NMR results and computational predictions. Overlap NOEs could not be definitively measured in NOESY spectra (cf. Figure 6). Only one NOE was measured with r(UUUU), which is consistent with r(UUUU) being far from an A-form structure. NOEs with H5′ or H5″ were omitted.
3.2. Molecular Dynamics
Simulations for all four tetramers with four starting structures each were completed with parmbsc0,41 parm99χ_Yil,42 ff10,43 and parmTor.44 Tetramers r(CAAU) and r(GACC) were also simulated with ff99 and a fifth starting structure was tested for r(UUUU), for a total of 76 simulations and 737 μs of simulation time (cf. Tables 4 and 5). Table 4 and Supporting Information Table 32 show for each simulation the percentage agreement with NMR, including in Table 4 the number of NOEs predicted but not observed.
Table 4. Agreement of Simulations with NMRa.
| NMR
Mean Scores (%) and Number of NOEs Predicted but Not Observed | ||||||
|---|---|---|---|---|---|---|
| force field | A-form (43) | N-syn (30) | S-anti (24) | S-syn (21) | mean | |
| r(AAAA) | parmbsc0 | 40 (5) | 34 (6) | 37 (2) | 33 (10) | 36 (5.8) |
| parm99χ_Yil | 32 (9) | 26 (31) | 32 (16) | 27 (15) | 29 (17.8) | |
| ff10 | 37 (5) | 38 (18) | 37 (21) | 38 (13) | 38 (14.2) | |
| parmTor | 27 (16) | 14 (40) | 20 (52) | 21 (58) | 20 (41.5) | |
| force field | A-form (54) | N-syn (21) | S-anti (33) | S-syn (15) | mean | |
|---|---|---|---|---|---|---|
| r(CAAU) | ff99 | 37 (3) | 29 (17) | 35 (3) | 35 (3) | 34 (6.5) |
| parmbsc0 | 43 (8) | 41 (6) | 31 (23) | 42 (9) | 39 (11.5) | |
| parm99χ_Yil | 36 (24) | 34 (23) | 33 (31) | 36 (23) | 35 (25.2) | |
| ff10 | 34 (23) | 38 (22) | 35 (27) | 38 (23) | 36 (23.8) | |
| parmTor | 33 (27) | 36 (34) | 26 (39) | 36 (39) | 33 (34.8) |
| force field | A-form (43) | N-syn (34) | S-anti (25) | S-syn (24) | mean | |
|---|---|---|---|---|---|---|
| r(GACC) | ff99 | 33 (6) | 22 (29) | 22 (28) | 23 (28) | 25 (22.8) |
| parmbsc0 | 23 (29) | 32 (8) | 33 (13) | 30 (23) | 29 (18.2) | |
| parm99χ_Yil | 46 (13) | 33 (29) | 41 (14) | 37 (38) | 39 (23.5) | |
| ff10 | 41 (19) | 30 (34) | 42 (22) | 29 (26) | 35 (25.2) | |
| parmTor | 35 (26) | 20 (39) | 22 (59) | 20 (40) | 24 (41.0) |
| force field | A-form (54) | N-syn (36) | S-anti (40) | S-syn (41) | >5 Å (41) | mean | |
|---|---|---|---|---|---|---|---|
| r(UUUU) | parmbsc0 | 18 (51) | 20 (41) | 21 (46) | 22 (42) | 21 (43) | 20 (44.6) |
| parm99χ_Yil | 21 (42) | 26 (45) | 20 (46) | 24 (46) | 19 (53) | 22 (46.4) | |
| ff10 | 23 (46) | 21 (52) | 29 (37) | 21 (48) | 23 (44) | 23 (45.4) | |
| parmTor | 19 (58) | 14 (74) | 17 (58) | 18 (40) | 15 (69) | 17 (59.8) |
Each starting structure’s NMR agreement is given in parentheses in the column headings. NMR agreement via eq 8 is shown in black, while the number of NOEs predicted to be below 5 Å but absent in spectra is shown in italics in parentheses. Explicit details in starting structure NMR accuracy are presented in Supporting Information section 7.
Table 5. Total Simulation Time for Each Force Field and Summary of Results from Table 4a.
| force field | min. score (%) | mean (%) | max. score (%) | total time (μs) |
|---|---|---|---|---|
| parmbsc0 | 18 | 31 | 43 | 165 |
| parm99χ_Yil | 19 | 31 | 46 | 166 |
| ff10 | 21 | 33 | 42 | 162 |
| parmTor | 14 | 23 | 36 | 166 |
Mean % is an average of 16 simulations for a given force field. Simulation for r(UUUU) with “<5 Å” starting structure is also included.
The number of predicted but not observed NOEs can be a significant or even, for r(UUUU), a majority part of the denominator of eq 8. This is due to a large fraction of simulation structures that contain stacks between bases that are not nearest neighbors in the sequence (Tables 6–9). This over representation is particularly large for r(UUUU) and more generally for parmTor.
Table 6. r(AAAA) Simulation Dataa.
| NMR | parmbsc0 | parm99χ_Yil | ff10 | parmTor | |
|---|---|---|---|---|---|
| 1–2 stack | present | 36.1% | 19.0% | 24.5% | 20.3% |
| 2–3 stack | present | 36.5% | 43.3% | 50.3% | 36.9% |
| 3–4 stack | present | 30.2% | 33.4% | 22.6% | 42.9% |
| 1–3 stack | none | 1.6% | 4.7% | 7.5% | 24.3% |
| 1–4 stack | none | 9.0% | 3.2% | 4.3% | 11.2% |
| 2–4 stack | none | 1.4% | 7.9% | 5.4% | 9.5% |
| 1–3–2 intercalation | none | 0.0% | 2.7% | 5.6% | 0.8% |
| 1–4–2 intercalation | none | 0.0% | 0.6% | 0.0% | 1.8% |
| 2–1–3 intercalation | none | 0.0% | 0.0% | 0.0% | 5.2% |
| 2–4–3 intercalation | none | 0.0% | 2.0% | 0.6% | 2.3% |
| 3–1–4 intercalation | none | 0.1% | 13.0% | 22.2% | 3.2% |
| 3–2–4 intercalation | none | 0.0% | 0.7% | 0.0% | 2.0% |
| random coil | none | 21.8% | 15.1% | 11.8% | 8.2% |
| β RMSD (Hz) | T | 0.5 | 0.3 | 0.4 | 6.0 |
| ϵ RMSD (Hz) | cf. Table 2 | 2.5 | 2.7 | 3.0 | 3.1 |
| γ RMSD (Hz) | cf. Table 2 | 0.8 | 1.4 | 0.7 | 1.2 |
| suger pucker RMSD (Hz) | cf. Table 2 | 2.4 | 1.8 | 1.4 | 2.2 |
r(AAAA) simulation data shows percentage of time the simulation showed stacks, intercalations, random coil, as well as RMSD of predicted 3J couplings relative to NMR. Nucleotides are numbered 1 to 4 starting with the 5′ nucleotide. Thus, a 1–2 stack represents a structure with the bases of nucleotides 1 and 2 stacked on each other, and a 1–3–2 intercalation represents stacking of base 3 on bases 1 and 2. Intercalations with maximum <1% for all force fields are not listed. “Random coil” means conformations where all nucleotides failed the stacking definition. Note that some intercalations can occur simultaneously, viz., 1–3–2/3–2–4 and 1–3–2/3–1–4. Non-sequential stacks are only counted if there is no intercalation present. Similarly, a 2–4 stack includes 1–4–2, 2–4–3, and 3–2–4 intercalations. Sugar pucker RMSD is the sum of all errors in ν: 3JH1′–H2′ + 3JH2′–H3′, + 3JH3′–H4′.
Table 9. r(GACC)a.
| NMR | parm99 | parmbsc0 | parm99χ_Yil | ff10 | parmTor | |
|---|---|---|---|---|---|---|
| 1–2 stack | present | 42.6% | 55.4% | 51.4% | 35.4% | 17.4% |
| 2–3 stack | present | 33.1% | 27.4% | 68.0% | 68.3% | 76.6% |
| 3–4 stack | present | 11.9% | 11.7% | 47.4% | 31.1% | 13.3% |
| 1–3 stack | none | 19.5% | 12.1% | 5.0% | 12.2% | 3.1% |
| 1–4 stack | none | 4.6% | 4.3% | 9.7% | 21.9% | 17.9% |
| 2–4 stack | none | 17.7% | 13.2% | 7.3% | 8.5% | 3.3% |
| 1–3–2 intercalation | none | 0.1% | 0.1% | 7.7% | 10.7% | 30.1% |
| 3–1–4 intercalation | none | 0.1% | 0.0% | 4.2% | 4.9% | 13.8% |
| random coil | none | 14.9% | 14.0% | 3.3% | 3.2% | 3.7% |
| β RMSD (Hz) | T | 1.0 | 1.2 | 0.4 | 0.6 | 3.3 |
| ϵ RMSD (Hz) | cf. Table 2 | 3.5 | 3.4 | 2.3 | 2.6 | 5.1 |
| γ RMSD (Hz) | cf. Table 2 | 1.4 | 0.9 | 1.1 | 0.8 | 1.3 |
| suger pucker RMSD (Hz) | cf. Table 2 | 3.2 | 2.8 | 0.4 | 1.3 | 1.7 |
Cf. Table 6.
Table 7. r(UUUU)a.
| NMR | parmbsc0 | parm99χ_Yil | ff10 | parmTor | |
|---|---|---|---|---|---|
| 1–2 stack | none | 5.5% | 15.7% | 13.8% | 21.0% |
| 2–3 stack | none | 6.3% | 22.1% | 12.3% | 20.6% |
| 3–4 stack | none | 4.5% | 9.1% | 8.3% | 21.4% |
| 1–3 stack | none | 50.6% | 36.1% | 33.2% | 15.4% |
| 1–4 stack | none | 1.8% | 2.3% | 2.9% | 7.2% |
| 2–4 stack | none | 30.8% | 11.5% | 12.8% | 7.2% |
| 1–3–2 intercalation | none | 0.0% | 3.1% | 0.3% | 3.8% |
| 3–1–4 intercalation | none | 0.1% | 4.2% | 3.3% | 1.5% |
| random coil | possible | 27.6% | 21.6% | 30.2% | 28.1% |
| β RMSD (Hz) | T | 0.1 | 0.1 | 0.1 | 6.4 |
| ϵ RMSD (Hz) | cf. Table 2 | 1.3 | 1.2 | 1.5 | 2.2 |
| γ RMSD (Hz) | cf. Table 2 | 0.9 | 1.4 | 0.7 | 0.5 |
| suger pucker RMSD (Hz) | cf. Table 2 | 2.3 | 0.6 | 1.2 | 0.7 |
Cf. Table 6.
Table 5 summarizes average agreement with NMR for four force fields and lists the total simulation time for each. Supporting Information Table 32 gives RMSD values between predicted and measured distances and 3J couplings. The parmTor force field shows the least average agreement with NMR. Parmbsc0, parm99χ_Yil, and ff10 performed similarly on average when compared to NMR spectra for the four single stranded tetramers studied here (Table 5).
When parmbsc0, parm99χ_Yil, and ff10 are considered, the mean agreement with NMR results depends on sequence (cf. Table 4). The order is r(CAAU) > r(GACC) ≈ r(AAAA) > r(UUUU). None, however, averages >40% NMR agreement.
Tables 6–9 provide qualitative insight into the structures seen in the MD simulations. For r(AAAA), r(CAAU), and r(GACC), with some exceptions for parmbsc0 and parmTor, 2–3 stacks have the highest percentage of stacking between two bases. Presumably, this reflects the fact that bases 1 and 4 are more exposed to water. As expected from studies of poly U,54,55 r(UUUU) has the least predicted stacking (as defined in Figures 4 and 5) between nearest neighbor bases and the largest predicted percentage of random coil (cf. Figure 7), where “random-coil” is defined as having no stacking above 50%. Unexpectedly, however, r(UUUU) is predicted to have a large fraction of 1–3 stacks with structures similar to that shown in Figure 7B. Additionally, r(UUUU) has a large number of predicted but not observed NOEs, which implies that predicted structures are more collapsed than expected from small-angle X-ray scattering measurements on r(U40).56
Figure 7.
Representative structures from r(UUUU) simulation starting A-form with ff10. Structure (B) illustrates a 1–3 stack. Hydrogen bonds are shown in green.
No NMR evidence is seen for 1–4 stacks, but parm99χ_Yil, ff10, and parmTor all predict that >9% of r(GACC) structures will have 1–4 stacking. Structures of r(GACC) generated with an M-REMD approach using ff10 suggest roughly 25% will have 1–4 stacks.49
There is also no NMR evidence for intercalated structures, where “intercalations” are defined as a nucleotide stack Ni–Nj–Ni+1, where j < i or j > i + 1. This also contrasts with MD predictions, as seen previously for r(GACC).47−49 Tables 6, 8, and 9 show that significant 1–3–2 and 3–1–4 intercalated structures are often predicted for r(AAAA), r(CAAU), and r(GACC). Intercalations can be very stable in simulations. For example, with ff10 starting with an A-form structure for r(CAAU), a 3–1–4 intercalation started at ≈490 ns and did not break free as of 9.2 μs (Figure 8). Similarly, parmTor’s A-form starting structure of r(CAAU) started a 3–1–4 intercalation at ≈540 ns and did not become free as of 9.6 μs.
Table 8. r(CAAU)a.
| NMR | parm99 | parmbsc0 | parm99χ_Yil | ff10 | parmTor | |
|---|---|---|---|---|---|---|
| 1–2 stack | present | 29.6% | 25.2% | 6.9% | 6.2% | 8.8% |
| 2–3 stack | present | 60.1% | 40.5% | 75.1% | 83.0% | 47.4% |
| 3–4 stack | present | 32.8% | 12.2% | 10.6% | 1.8% | 19.5% |
| 1–3 stack | none | 2.7% | 6.4% | 2.3% | 3.1% | 18.3% |
| 1–4 stack | none | 2.4% | 1.4% | 0.5% | 1.8% | 1.4% |
| 2–4 stack | none | 2.8% | 6.4% | 2.1% | 0.6% | 22.7% |
| 1–3–2 intercalation | none | 0.0% | 0.5% | 15.6% | 35.0% | 17.4% |
| 2–1–3 intercalation | none | 0.0% | 0.1% | 0.0% | 0.0% | 1.7% |
| 3–1–4 intercalation | none | 0.1% | 2.0% | 44.6% | 49.5% | 17.1% |
| 3–2–4 intercalation | none | 0.1% | 0.0% | 1.7% | 0.0% | 0.0% |
| random coil | none | 18.4% | 29.7% | 10.0% | 2.3% | 8.0% |
| β RMSD (Hz) | T | 0.9 | 0.2 | 1.3 | 1.2 | 8.0 |
| ϵ RMSD (Hz) | cf. Table 2 | 3.2 | 3.2 | 3.8 | 4.3 | 3.7 |
| γ RMSD (Hz) | cf. Table 2 | 1.5 | 1.2 | 1.1 | 1.1 | 1.2 |
| suger pucker RMSD (Hz) | cf. Table 2 | 3.3 | 2.7 | 0.8 | 0.5 | 2.4 |
Cf. Table 6.
Figure 8.

One example of a 3–1–4 intercalation: r(CAAU) starting from an A-form structure with force field ff10 intercalates at ≈490 ns and remains intercalated. Structure shown is visualized at 5996.0 ns. Hydrogen bonds are shown in green, which lock the intercalation in place. Both ζ1 and α2 transition from G– to G+ as the intercalation occurs and Solvent-Accessible Surface Area (S.A.S.A.) decreases. Figure was drawn with Grace 5.1.23 and Avogadro.66
The intercalations occurred simultaneously with sharp decreases in total Solvent-Accessible Surface Area114 (S.A.S.A.) for both ff10 (Figure 8) and parmTor. This possibly indicates that base–base interactions within the RNA are too strong12,45 and/or that nucleotide–solvent interactions are not strong enough compared to water–water interactions.115
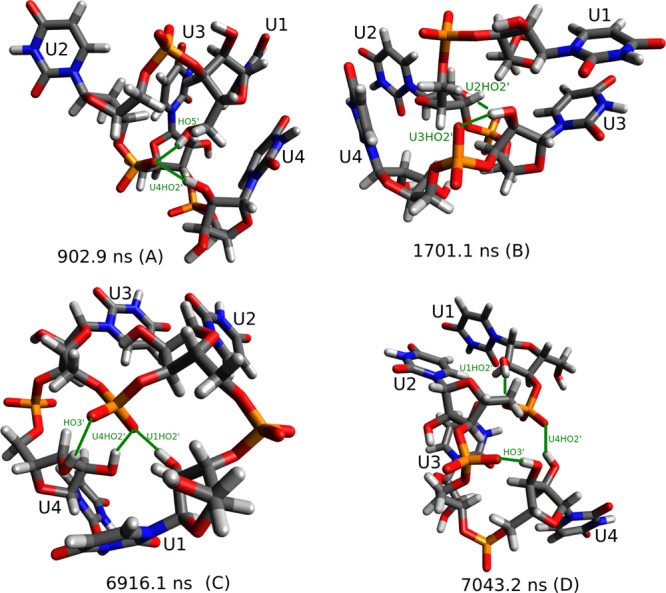
Inspection of the intercalated r(CAAU) ff10 structure at 5996.0 ns (Figure 8) shows two principal probable causes for this structure’s longevity: (i) a hydrogen bond between C1’s amino group and a U4 phosphate nonbridging oxygen and (ii) two hydrogen bonds between A3 phosphate nonbridging oxygens and C1’s HO5′ and U4’s HO3′. The defect in hydrogen bonding may be especially significant when modeling splicing reactions, which depend on the positioning of the phosphate backbone.116−118 Such base–phosphate interactions are present in biological RNAs.119
The hydrogen bonds observed for r(CAAU) were also seen with r(AAAA) (cf. Figure 9). Simulations of r(CCCC) also generated amino to phosphate hydrogen bonds.90 Unlike r(CCCC),90 however, in r(CAAU) there were no carbonyl-amino group electrostatic attractions favoring intercalation.
Figure 9.

r(AAAA) with ff10 and N-syn starting structure has a very similar intercalation as r(CAAU) in Figure 8. Unlike r(CAAU), the intercalation was present at the beginning of the production run and broke free at 7.5 μs.
Comparisons between predicted and observed sugar puckers and various torsion angles provide additional insight into strengths and weaknesses of force fields. Huang et al.120 noted that “molecular mechanics simulations fail to adequately describe ... ribose ring puckers.” Nevertheless, parm99χ_Yil,42 ff10,43 and parmTor44 all improved sugar puckers relative to parm99 and parmbsc0 simulations of r(CAAU) and r(GACC) (cf. Tables 8 and 9). Presumably, this improvement reflects the close coupling between χ and sugar pucker65,121−124 so that quantum mechanical reparameterization of χ also lowered the RMSD between measured and predicted ribose 3J scalar coupling. Even with this improvement, however, only a plurality of C3′–endo structures are predicted instead of the majority C3′–endo seen in NMR (cf. Supporting Information Section 8).
LNAs have a CH2 bridge connecting ribose O2′ and C4′ atoms, which restricts the sugar to a C3′–endo conformation and simplifies computations. The agreement with NMR for r(CAAU) simulations can be compared to that for simulations of the LNA, L(CAAU).91 In a 3 μs simulation starting with the A-form structure of L(CAAU), no intercalations were observed, and NMR agreement was 66% with the parm99_LNA force field. The latter had partial charges and χ reparametrized for LNA. This can be roughly compared to the 36% NMR agreement for r(CAAU) with A-form starting structure and parm99χ_Yil force field (Table 4). The comparison implies AMBER sugar parameters can be improved.120
Tables 6–9 compare predicted and measured 3J scalar couplings for β, ϵ, and γ. The parmbsc0,41 parm99χ_Yil,42 and ff1043 force fields use the same parameters for these torsions. ParmTor44 revised β, ϵ, and ζ via MP2/6-31G(d) quantum calculations (cf. Table 1) and the revision of β resulted in poor agreement between measured 3JH5′–P5′ and 3JH5″–P5′ couplings and those predicted with eqs 6. In general, the range in differences between measured and predicted 3J couplings is too small to choose between the parmbsc0, parm99χ_Yil, and ff10 force fields, especially because of uncertainties in the Karplus equations (eqs 4–7) as discussed in Supporting Information Section 4.5.
4. Discussion
RNA has many functions6 and increasingly is being targeted with therapeutics.125−128 Accurate determination of RNA secondary structure is relatively rapid,129−134 but determination of 3D structure and dynamics is slow. While double helical regions can be reasonably modeled as A-form RNA, accurately modeling loop regions remains a challenge.135 Accurate force fields for RNA would facilitate modeling loop structures, dynamics, and docking with other molecules.
Practical force fields must approximate well the many interactions driving RNA folding.136 These include stacking, hydrogen bonding, solvation, counterion interactions, and torsion potentials. The tetramers presented here are too short to have base–base hydrogen bonds and counterion condensation.137,138 Thus, the benchmarks presented here focus on other interactions.
Parametrization of torsions is the main difference between the force fields tested (Table 1). ParmTor had the most modifications (Table 1) but least agreement with NMR (Tables 4 and 5). The ParmTor β reparametrization gave the most dramatic change in energy vs torsion angle.44 In particular, the β energy landscape is much flatter for parmTor than for the other force fields. While parmTor gives a worse performance here, it gave essentially the same agreement as parm99χ_Yil and better agreement than parm99 when less extensive comparisons were made between simulations and NMR spectra of r(CCCC).90 In a comparison of force fields to predict differences in ΔG27° for forming tetramer duplexes with all GC or isoG–isoC base pairs, parmTor gave better agreement with experiment than parm99 and parm99χ_Yil.44 Because parameters for different components of a force field are interdependent,12 it is not clear that the new β parametrization is fundamentally worse than the parm99 one, also employed in parmbsc0, parm99χ_Yil, and ff10.
The parmbsc0, parm99χ_Yil, and ff10 simulations had similar agreement with NMR observables (Tables 4 and 5), although none had means > 40%. The structural ensembles, however, are somewhat different (Tables 6–9). For example, parmbsc0 generates the fewest intercalated structures for r(AAAA), r(CAAU), and r(GACC). Because there is no NMR evidence for intercalated structures, parmbsc0 therefore has the fewest absent NOEs lowering NMR agreement with MD via eq 8. Parm99χ_Yil and ff10 both differ from parmbsc0 by having χ reparametrized, which favors an anti conformation over a syn conformation. Predicted intercalated bases have anti conformations. In a different benchmark, the χ reparametrization in ff10 improved predictions of UUCG and GNRA hairpins relative to parmbsc0.83 Evidently, the force fields must be tested against multiple benchmarks.
For the parm99χ_Yil and ff10 simulations of r(AAAA), r(CAAU), and r(GACC), the most common structures not in agreement with NMR (Tables 6, 8, and 9) are 1–3–2 and 3–1–4 intercalations. Both have been seen in previous simulations of r(GACC),47−49 and 3–1–4 was seen in r(CCCC) simulations.90 Figures 8 and 9 show examples for r(CAAU) and r(AAAA). Therefore, r(UUUU) is the only sequence thus far which is predicted not to have very favorable intercalation. It is also the only sequence lacking amino groups. Evidently, amino to phosphate interactions are one key for stabilizing predicted intercalations (Figures 8 and 9).
In addition to hydrogen bonds from the intercalated base amino group, there are hydrogen bonds from 5′-terminal HO and 3′-terminal HO groups to phosphate nonbridging oxygens that stabilize the intercalated structures generated by MD (Figures 8 and 9). Moreover, for r(AAAA), r(CAAU), and r(GACC), intercalation is also accompanied by a decrease in Solvent-Accessible Surface Area (Figure 8).
Parm99χ_Yil and ff10 predict that there is more 2–3 stacking than 1–2 or 3–4 stacking in r(AAAA), r(CAAU), and r(GACC). This is reasonable because the middle two nucleotides can be held in place by two stacking interactions while the terminal nucleotides have water on one side. r(GACC) is special in having more predicted 1–4 stacking than other sequences, which suggests extra favorable stacking between G and C. Total stacking and intercalation are least for r(UUUU) as expected from studies of poly(U).54,55 Nevertheless, r(UUUU) has the largest number of absent NOEs, suggesting the simulations predict a relatively disordered, but collapsed, structure not consistent with NMR of r(UUUU), experiments on poly(U),54,55 or r(U40).56
The parm99χ_Yil and ff10 simulations of r(AAAA), r(CAAU), and r(GACC) reveal predicted stacking and hydrogen-bonding interactions not consistent with NMR spectra. There are several possible reasons for this. The AMBER force field may have base–base van der Waals interactions that are too strong.12 Alternatively, or in addition, nucleotide–water and water–water interactions may not be balanced well. The same reasons may explain the collapsed structures observed for r(UUUU). Approximating all the forces driving RNA conformations is difficult.136
RNA force fields are often used to refine 3D structures determined by NMR and crystallography or to predict 3D structure and/or dynamics when only secondary structure is known. Often, the RNA is complexed with protein. In all these cases, MD simulations are likely to perform better than reported here for unrestricted tetramers because of experimental and/or covalent restraints and additional volume exclusion. Thus, the tetramers provide a particularly rigorous benchmark for testing the approximations inherent in a classical force field.
Acknowledgments
We are grateful to the University of Rochester’s Center for Integrated Research Computing. This research was supported by National Institutes of Health (NIH) Grant R01 GM22939 (to D.H.T.).
Supporting Information Available
Detailed information on RNA X-ray structures used for NMR and base stacking analysis and the perl scripts used to create the tables, how C2′–C3′–endo ratios are calculated, scale constant calculation, 1H/13C/31P chemical shift assignments, derivation of new Karplus functions, detailed NMR spectra and acquisition parameters, AMBER input files, starting structure accuracy, NMR scoring program C source code, and simulation performance. All of this material is available free of charge via Internet at http://pubs.acs.org.
The authors declare no competing financial interest.
Supplementary Material
References
- Chow L. T.; Gelinas R. E.; Broker T. R.; Roberts R. J. Cell 1977, 12, 1–8. [DOI] [PubMed] [Google Scholar]
- Berget S. M.; Moore C.; Sharp P. A. Proc. Natl. Acad. Sci. U.S.A. 1977, 74, 3171–3175. [DOI] [PMC free article] [PubMed] [Google Scholar]
- Kruger K.; Grabowski P. J.; Zaug A. J.; Sands J.; Gottschling D. E.; Cech T. R. Cell 1982, 31, 147–157. [DOI] [PubMed] [Google Scholar]
- Guerrier-Takada C.; Gardiner K.; Marsh T.; Pace N.; Altman S. Cell 1983, 35, 849–857. [DOI] [PubMed] [Google Scholar]
- Fire A.; Xu S.; Montgomery M. K.; Kostas S. A.; Driver S. E.; Mello C. C. Nature 1998, 391, 806–811. [DOI] [PubMed] [Google Scholar]
- RNA Worlds: From Life’s Origins to Diversity in Gene Regulation; Atkins J. F., Gesteland R. F., Cech T. R., Eds.; Cold Spring Harbor Laboratory Press: 2011. [Google Scholar]
- Good P.; Krikos A.; Li S.; Bertrand E.; Lee N.; Giver L.; Ellington A.; Zaia J.; Rossi J.; Engelke D. Gene Ther. 1997, 4, 45–54. [DOI] [PubMed] [Google Scholar]
- Van Nuffel A.; Corthals J.; Neyns B.; Heirman C.; Thielemans K.; Bonehill A.. Methods in Molecular Biology Molecular Biology; In RNA Therapeutics; Sioud M., Ed.; Humana Press: New York, NY, 2010; Vol. 629, pp 403–450. [DOI] [PubMed] [Google Scholar]
- Kole R.; Krainer A. R.; Altman S. Nat. Rev. Drug Discovery 2012, 11, 125–140. [DOI] [PMC free article] [PubMed] [Google Scholar]
- Barry G. Mol. Psychiatry 2014, 19, 410–416. [DOI] [PubMed] [Google Scholar]
- Broderick J.; Zamore P. Mol. Cell 2014, 54, 711–713. [DOI] [PubMed] [Google Scholar]
- Chen A. A.; García A. E. Proc. Natl. Acad. Sci. U.S.A. 2013, 110, 16820–16825. [DOI] [PMC free article] [PubMed] [Google Scholar]
- Kührová P.; Banáš P.; Best R. B.; Šponer J.; Otyepka M. J. Chem. Theory Comput. 2013, 9, 2115–2125. [DOI] [PubMed] [Google Scholar]
- Carvalho A. T. P.; Fernandes P. A.; Ramos M. J. J. Chem. Theory Comput. 2011, 7, 1177–1188. [DOI] [PubMed] [Google Scholar]
- Yildirim I.; Park H.; Disney M. D.; Schatz G. C. J. Am. Chem. Soc. 2013, 135, 3528–3538. [DOI] [PMC free article] [PubMed] [Google Scholar]
- Zhang X.; Walker R. C.; Phizicky E. M.; Mathews D. H. J. Chem. Theory Comput. 2014, 10, 3473–3483. [DOI] [PMC free article] [PubMed] [Google Scholar]
- Juneja A.; Villa A.; Nilsson L. J. Chem. Theory Comput. 2014, 10, 3532–3540. [DOI] [PubMed] [Google Scholar]
- Rastädter D.; Biswas M.; Burghardt I. J. Phys. Chem. B 2014, 118, 8478–8488. [DOI] [PubMed] [Google Scholar]
- Warshel A.; Levitt M. J. Mol. Biol. 1976, 103, 227–249. [DOI] [PubMed] [Google Scholar]
- Karplus M.; McCammon A. J. Nat. Struct. Mol. Biol. 2002, 9, 646–652. [DOI] [PubMed] [Google Scholar]
- Šponer J.; Banáš P.; Jurečka P.; Zgarbová M.; Kührová P.; Havrila M.; Krepl M.; Stadlbauer P.; Otyepka M. J. Phys. Chem. Lett. 2014, 5, 1771–1782. [DOI] [PubMed] [Google Scholar]
- Mustoe A. M.; Al-Hashimi H. M.; Brooks C. L. J. Phys. Chem. B 2014, 118, 2615–2627. [DOI] [PMC free article] [PubMed] [Google Scholar]
- Harvey S.; Prabhakaran M.; Mao B.; McCammon J. Science 1984, 223, 1189–1191. [DOI] [PubMed] [Google Scholar]
- Hermann T.; Auffinger P.; Westhof E. Eur. Biophys. J. 1998, 27, 153–165. [DOI] [PubMed] [Google Scholar]
- Srinivasan J.; Miller J.; Kollman P. A.; Case D. A. J. Biomol. Struct. Dyn. 1998, 16, 671–682. [DOI] [PubMed] [Google Scholar]
- Schneider C.; Sühnel J. Biopolymers 1999, 50, 287–302. [DOI] [PubMed] [Google Scholar]
- Sibille N.; Pardi A.; Simorre J.-P.; Blackledge M. J. Am. Chem. Soc. 2001, 123, 12135–12146. [DOI] [PubMed] [Google Scholar]
- Réblová K.; Špačková N.; Štefl R.; Csaszar K.; Koča J.; Leontis N. B.; Šponer J. Biophys. J. 2003, 84, 3564–3582. [DOI] [PMC free article] [PubMed] [Google Scholar]
- Krasovska M. V.; Sefcikova J.; Réblová K.; Schneider B.; Walter N. G.; Šponer J. Biophys. J. 2006, 91, 626–638. [DOI] [PMC free article] [PubMed] [Google Scholar]
- Ding F.; Sharma S.; Chalasani P.; Demidov V. V.; Broude N. E.; Dokholyan N. V. RNA 2008, 14, 1164–1173. [DOI] [PMC free article] [PubMed] [Google Scholar]
- Réblová K.; Rázga F.; Li W.; Gao H.; Frank J.; Šponer J. Nucleic Acids Res. 2010, 38, 1325–1340. [DOI] [PMC free article] [PubMed] [Google Scholar]
- Beššeová I.; Réblová K.; Leontis N. B.; Šponer J. Nucleic Acids Res. 2010, 38, 6247–6264. [DOI] [PMC free article] [PubMed] [Google Scholar]
- Shen L.; Johnson T. L.; Clugston S.; Huang H.; Butenhof K. J.; Stanton R. V. J. Chem. Inf. Model. 2011, 51, 1957–1965. [DOI] [PubMed] [Google Scholar]
- Allnér O.; Nilsson L.; Villa A. RNA 2013, 19, 916–926. [DOI] [PMC free article] [PubMed] [Google Scholar]
- Weiner S. J.; Kollman P. A.; Case D. A.; Singh U. C.; Ghio C.; Alagona G.; Profeta S.; Weiner P. J. Am. Chem. Soc. 1984, 106, 765–784. [Google Scholar]
- Jones J. E. Proc. R. Soc. London, Ser. A 1924, 106, 463–477. [Google Scholar]
- Brooks B. R.; Bruccoleri R. E.; Olafson B. D.; States D. J.; Swaminathan S.; Karplus M. J. Comput. Chem. 1983, 4, 187–217. [Google Scholar]
- Bayly C. I.; Cieplak P.; Cornell W. D.; Kollman P. A. J. Phys. Chem. 1993, 97, 10269–10280. [Google Scholar]
- Cornell W. D.; Cieplak P.; Bayly C. I.; Gould I. R.; Merz K. M.; Ferguson D. M.; Spellmeyer D. C.; Fox T.; Caldwell J. W.; Kollman P. A. J. Am. Chem. Soc. 1995, 117, 5179–5197. [Google Scholar]
- Case D. A.; Darden T. A.; Cheatham T. E.; Simmerling C. L.; Wang J.; Duke R. E.; Luo R.; Crowley M.; Walker R. C.; Zhang W.; Merz K. M.; Roberts B.; Hayik S.; Roitberg A.; Seabra G.; Swails J.; Götz A. W.; Kolossváry I.; Wong K. F.; Paesani F.; Vanicek J.; Wolf J.; Wu X.; Brozell S. R.; Steinbrecher T.; Gohlke H.; Cai Q.; Ye X.; Wang J.; Hsieh M.-J.; Cui D. R.; Roe D. R.; Mathews D. H.; Seetin M. G.; Salomon-Ferrer R.; Sagui C.; Babin V.; T L.; Gusarov S.; Kovalenko A.; Kollman P. A.. AMBER 12; University of California: San Francisco, 2012. [Google Scholar]
- Pérez A.; Marchán I.; Svozil D.; Šponer J.; Cheatham T. E. III; Laughton C. A.; Orozco M. Biophys. J. 2007, 92, 3817–3829. [DOI] [PMC free article] [PubMed] [Google Scholar]
- Yildirim I.; Stern H. A.; Kennedy S. D.; Tubbs J. D.; Turner D. H. J. Chem. Theory Comput. 2010, 6, 1520–1531. [DOI] [PMC free article] [PubMed] [Google Scholar]
- Zgarbová M.; Otyepka M.; Šponer J.; Mládek A.; Banáš P.; Cheatham T. E.; Jurečka P. J. Chem. Theory Comput. 2011, 7, 2886–2902. [DOI] [PMC free article] [PubMed] [Google Scholar]
- Yildirim I.; Kennedy S. D.; Stern H. A.; Hart J. M.; Kierzek R.; Turner D. H. J. Chem. Theory Comput. 2012, 8, 172–181. [DOI] [PMC free article] [PubMed] [Google Scholar]
- Morgado C. A.; Jurečka P.; Svozil D.; Hobza P.; Šponer J. Phys. Chem. Chem. Phys. 2010, 12, 3522–3534. [DOI] [PubMed] [Google Scholar]
- Brown R. F.; Andrews C. T.; Elcock A. H. J. Chem. Theory Comput. 2015, 10.1021/ct501170h. [DOI] [PMC free article] [PubMed] [Google Scholar]
- Yildirim I.; Stern H. A.; Tubbs J. D.; Kennedy S. D.; Turner D. H. J. Phys. Chem. B 2011, 115, 9261–9270. [DOI] [PMC free article] [PubMed] [Google Scholar]
- Henriksen N. M.; Roe D. R.; Cheatham T. E. J. Phys. Chem. B 2013, 117, 4014–4027. [DOI] [PMC free article] [PubMed] [Google Scholar]
- Bergonzo C.; Henriksen N. M.; Roe D. R.; Swails J. M.; Roitberg A. E.; Cheatham T. E. J. Chem. Theory Comput. 2014, 10, 492–499. [DOI] [PMC free article] [PubMed] [Google Scholar]
- Wickstrom L.; Okur A.; Simmerling C. Biophys. J. 2009, 97, 853–856. [DOI] [PMC free article] [PubMed] [Google Scholar]
- Beauchamp K. A.; Lin Y.-S.; Das R.; Pande V. S. J. Chem. Theory Comput. 2012, 8, 1409–1414. [DOI] [PMC free article] [PubMed] [Google Scholar]
- Kierzek E.; Christensen S. M.; Eickbush T. H.; Kierzek R.; Turner D. H.; Moss W. N. J. Mol. Biol. 2009, 390, 428–442. [DOI] [PMC free article] [PubMed] [Google Scholar]
- Dewey T. G.; Turner D. H. Biochemistry 1979, 18, 5757–5762. [DOI] [PubMed] [Google Scholar]
- Richards E. G.; Flessel C. P.; Fresco J. R. Biopolymers 1963, 1, 431–446. [Google Scholar]
- Inners L.; Felsenfeld G. J. Mol. Biol. 1970, 50, 373–389. [DOI] [PubMed] [Google Scholar]
- Chen H.; Meisburger S. P.; Pabit S. A.; Sutton J. L.; Webb W. W.; Pollack L. Proc. Natl. Acad. Sci. U.S.A. 2012, 109, 799–804. [DOI] [PMC free article] [PubMed] [Google Scholar]
- Watson J. D.; Crick F. H. C. Nature 1953, 171, 737–738. [DOI] [PubMed] [Google Scholar]
- Moore P. B. Annu. Rev. Biochem. 1999, 68, 287–300. [DOI] [PubMed] [Google Scholar]
- Krasilnikov A. S.; Yang X.; Pan T.; Mondragon A. Nature 2003, 421, 760–764. [DOI] [PubMed] [Google Scholar]
- Ban N.; Nissen P.; Hansen J.; Moore P. B.; Steitz T. A. Science 2000, 289, 905–920. [DOI] [PubMed] [Google Scholar]
- Wimberly B. T.; Brodersen D. E.; Clemons W. M.; Morgan-Warren R. J.; Carter A. P.; Vonrhein C.; Hartsch T.; Ramakrishnan V. Nature 2000, 407, 327–339. [DOI] [PubMed] [Google Scholar]
- Kennedy S. D.; Kierzek R.; Turner D. H. Biochemistry 2012, 51, 9257–9259. [DOI] [PMC free article] [PubMed] [Google Scholar]
- Morgado C. A.; Jurečka P.; Svozil D.; Hobza P.; Šponer J. J. Chem. Theory Comput. 2009, 5, 1524–1544. [DOI] [PubMed] [Google Scholar]
- Saenger W.Principles of Nucleic Acid Structure; Springer-Verlag: 1984. [Google Scholar]
- Altona C.; Sundaralingam M. J. Am. Chem. Soc. 1972, 94, 8205–8212. [DOI] [PubMed] [Google Scholar]
- Hanwell M.; Curtis D.; Lonie D.; Vandermeersch T.; Zurek E.; Hutchison G. J. Cheminform. 2012, 4, 17. [DOI] [PMC free article] [PubMed] [Google Scholar]
- Cornell W. D.; Cieplak P.; Bayly C. I.; Kollman P. A. J. Am. Chem. Soc. 1993, 115, 9620–9631. [Google Scholar]
- Møller C.; Plesset M. S. Phys. Rev. 1934, 46, 0618–0622. [Google Scholar]
- Hehre W. J.; Ditchfield R.; Pople J. A. J. Chem. Phys. 1972, 56, 2257–2261. [Google Scholar]
- Réblová K.; Fadrná E.; Sarzynska J.; Kulinski T.; Kulhánek P.; Ennifar E.; Koča J.; Šponer J. Biophys. J. 2007, 93, 3932–3949. [DOI] [PMC free article] [PubMed] [Google Scholar]
- Lang P. T.; Brozell S. R.; Mukherjee S.; Pettersen E. F.; Meng E. C.; Thomas V.; Rizzo R. C.; Case D. A.; James T. L.; Kuntz I. D. RNA 2009, 15, 1219–1230. [DOI] [PMC free article] [PubMed] [Google Scholar]
- Mlýnský V.; Banáš P.; Hollas D.; Réblová K.; Walter N. G.; Šponer J.; Otyepka M. J. Phys. Chem. B 2010, 114, 6642–6652. [DOI] [PMC free article] [PubMed] [Google Scholar]
- Réblová K.; Střelcová Z.; Kulhánek P.; Beššeová I.; Mathews D. H.; van Nostrand K.; Yildirim I.; Turner D. H.; Šponer J. J. Chem. Theory Comput. 2010, 6, 910–929. [PMC free article] [PubMed] [Google Scholar]
- Wang Y.; Shen J. K.; Schroeder S. J. J. Phys. Chem. Lett. 2012, 3, 1007–1010. [DOI] [PubMed] [Google Scholar]
- Spasic A.; Serafini J.; Mathews D. H. J. Chem. Theory Comput 2012, 8, 2497–2505. [DOI] [PMC free article] [PubMed] [Google Scholar]
- Borkar A. N.; Simone A. D.; Montalvao R. W.; Vendruscolo M. J. Chem. Phys. 2013, 138, 215103. [DOI] [PubMed] [Google Scholar]
- Meyer S.; Jost D.; Theodorakopoulos N.; Peyrard M.; Lavery R.; Everaers R. Biophys. J. 2013, 105, 1904–1914. [DOI] [PMC free article] [PubMed] [Google Scholar]
- Wilson T.; Costa P. J.; Félix V.; Williamson M. P.; Thomas J. A. J. Med. Chem. 2013, 56, 8674–8683. [DOI] [PMC free article] [PubMed] [Google Scholar]
- Maláč K.; Barvík I. J. Mol. Graphics Modell. 2013, 44, 81–90. [DOI] [PubMed] [Google Scholar]
- Halkier A.; Helgaker T.; Jorgensen P.; Klopper W.; Koch H.; Olsen J.; Wilson A. K. Chem. Phys. Lett. 1998, 286, 243–252. [Google Scholar]
- Halkier A.; Helgaker T.; Jorgensen P.; Klopper W.; Olsen J. Chem. Phys. Lett. 1999, 302, 437–446. [Google Scholar]
- Klamt A.; Schuurmann G. J. Chem. Soc., Perkin Trans. 2 1993, 799–805. [Google Scholar]
- Banáš P.; Hollas D.; Zgarbová M.; Jurečka P.; Orozco M.; Cheatham T. E.; Šponer J.; Otyepka M. J. Chem. Theory Comput. 2010, 6, 3836–3849. [DOI] [PMC free article] [PubMed] [Google Scholar]
- Wüthrich K. J. Biol. Chem. 1990, 265, 22059–22062. [PubMed] [Google Scholar]
- Summers M. F.; Marzilli L. G.; Bax A. J. Am. Chem. Soc. 1986, 108, 4285–4294. [DOI] [PubMed] [Google Scholar]
- Bax A.; Ikura M.; Kay L. E.; Torchia D. A.; Tschudin R. J. Magn. Reson. 1990, 86, 304–318. [Google Scholar]
- Fonville J. M.; Swart M.; Vokáčová Z.; Sychrovsk’y V.; Šponer J. E.; Šponer J.; Hilbers C. W.; Bickelhaupt F. M.; Wijmenga S. S. Chem.—Eur. J. 2012, 18, 12372–12387. [DOI] [PubMed] [Google Scholar]
- Delaglio F.; Grzesiek S.; Vuister G. W.; Zhu G.; Pfeifer J.; Bax A. J. Biomol. NMR 1995, 6, 277–293. [DOI] [PubMed] [Google Scholar]
- Kneller D. G.; Kuntz I. D. J. Cell. Biochem. 1993, 254–254. [Google Scholar]
- Tubbs J. D.; Condon D. E.; Kennedy S. D.; Hauser M.; Bevilacqua P. C.; Turner D. H. Biochemistry 2013, 52, 996–1010. [DOI] [PMC free article] [PubMed] [Google Scholar]
- Condon D. E.; Yildirim I.; Kennedy S. D.; Mort B. C.; Kierzek R.; Turner D. H. J. Phys. Chem. B 2014, 118, 1216–1228. [DOI] [PMC free article] [PubMed] [Google Scholar]
- Altona C.; Sundaralingam M. J. Am. Chem. Soc. 1973, 95, 2333–2344. [DOI] [PubMed] [Google Scholar]
- Jenkins A. D. Pure Appl. Chem. 1981, 53, 733–752. [Google Scholar]
- Moss G. P. Pure Appl. Chem. 1996, 68, 2193–2222. [Google Scholar]
- Richardson J. S.; Schneider B.; Murray L. W.; Kapral G. J.; Immormino R. M.; Headd J. J.; Richardson D. C.; Ham D.; Hershkovits E.; Williams L. D.; Keating K. S.; Pyle A. M.; Micallef D.; Westbrook J.; Berman H. M. RNA 2008, 14, 465–481. [DOI] [PMC free article] [PubMed] [Google Scholar]
- The PyMOL Molecular Graphics System, Version 1.3r1; Schrödinger: New York, NY, 2010. [Google Scholar]
- Case D. A.; Darden T. A.; Cheatham T. E. III; Simmerling C. L.; Wang J.; Duke R. E.; Luo R.; Merz K. M.; Pearlman D. A.; Crowley M.; Walker R. C.; Zhang W.; Wang B.; Hayik S.; Roitberg A.; Seabra G.; Wong K. F.; Paesani F.; Wu X.; Brozell S.; Tsui V.; Gohlke H.; Yang L.; Tan C.; Mongan J.; Hornak V.; Cui G.; Beroza P.; Mathews D. H.; Schafmeister C.; Ross W. S.; Kollman P. A.. AMBER 9; 2006.
- Jorgensen W. L.; Chandrasekhar J.; Madura J. D.; Impey R. W.; Klein M. L. J. Chem. Phys. 1983, 79, 926–935. [Google Scholar]
- Wüthrich K.NMR of Proteins and Nucleic Acids; Wiley-Interscience: New York, NY, 1986. [Google Scholar]
- Obika S.; Nanbu D.; Hari Y.; ichiro Morio K.; In Y.; Ishida T.; Imanishi T. Tetrahedron Lett. 1997, 38, 8735–8738. [Google Scholar]
- Marino J. P.; Schwalbe H.; Griesinger C. Acc. Chem. Res. 1999, 32, 614–623. [Google Scholar]
- Haasnoot C.; de Leeuw F.; Altona C. Tetrahedron 1980, 36, 2783–2792. [Google Scholar]
- Wijmenga S. S.; van Buuren B. N. Prog. Nucl. Magn. Res. Spectrosc. 1998, 32, 287–387. [Google Scholar]
- Nozinovic S.; Fürtig B.; Jonker H. R. A.; Richter C.; Schwalbe H. Nucleic Acids Res. 2010, 38, 683–694. [DOI] [PMC free article] [PubMed] [Google Scholar]
- Richter C.; Griesinger C.; Felli I.; Cole P.; Varani G.; Schwalbe H. J. Biomol. NMR 1999, 15, 241–250. [DOI] [PubMed] [Google Scholar]
- Davies D. B. Prog. Nucl. Magn. Res. Spectrosc. 1978, 12, 135–225. [Google Scholar]
- Hruska F. E. In Conformations of Biological Molecules and Polymers; Bergmann E. D., Pullman B., Eds.; Academic Press: New York, NY, 1973; p 345. [Google Scholar]
- Lankhorst P. P.; Haasnoot C. A.; Erkelens C.; Altona C. J. Biomol. Struct. Dyn. 1984, 1, 1387–1405. [DOI] [PubMed] [Google Scholar]
- Mooren M. M.; Wijmenga S. S.; van der Marel G. A.; van Boom J. H.; Hilbers C. W. Nucleic Acids Res. 1994, 22, 2658–2666. [DOI] [PMC free article] [PubMed] [Google Scholar]
- Fletcher R. W.; Fletcher S. W.. Clinical Epidemiology: The Essentials, 4th ed.; Lippincott Williams & Wilkins: Baltimore, MD, 2005; p 45. [Google Scholar]
- Burkard M. E.; Kierzek R.; Turner D. H. J. Mol. Biol. 1999, 290, 967–982. [DOI] [PubMed] [Google Scholar]
- Leonard G. A.; Mcauleyhecht K. E.; Ebel S.; Lough D. M.; Brown T.; Hunter W. N. Structure 1994, 2, 483–494. [DOI] [PubMed] [Google Scholar]
- Schneider B.; Moravek Z.; Berman H. M. Nucleic Acids Res. 2004, 32, 1666–1677. [DOI] [PMC free article] [PubMed] [Google Scholar]
- Weiser J.; Shenkin P. S.; Still W. C. J. Comput. Chem. 1999, 20, 217–230. [DOI] [PubMed] [Google Scholar]
- Kührová P.; Otyepka M.; Šponer J.; Banšá P. J. Chem. Theory Comput. 2014, 10, 401–411. [DOI] [PubMed] [Google Scholar]
- Zirbel C. L.; Šponer J. E.; Šponer J.; Stombaugh J.; Leontis N. B. Nucleic Acids Res. 2009, 37, 4898–4918. [DOI] [PMC free article] [PubMed] [Google Scholar]
- Zgarbová M.; Jurečka P.; Banáš P.; Otyepka M.; Šponer J. E.; Leontis N. B.; Zirbel C. L.; Šponer J. J. Phys. Chem. A 2011, 115, 11277–11292. [DOI] [PubMed] [Google Scholar]
- Šponer J.; Mládek A.; Šponer J. E.; Svozil D.; Zgarbová M.; Banáš P.; Jurečka P.; Otyepka M. Phys. Chem. Chem. Phys. 2012, 14, 15257–15277. [DOI] [PubMed] [Google Scholar]
- Ulyanov N. B.; James T. L. New J. Chem. 2010, 34, 910–917. [DOI] [PMC free article] [PubMed] [Google Scholar]
- Huang M.; Giese T. J.; Lee T.-S.; York D. M. J. Chem. Theory Comput. 2014, 10, 1538–1545. [DOI] [PMC free article] [PubMed] [Google Scholar]
- Sundaralingam M. Biopolymers 1969, 7, 821–860. [Google Scholar]
- Arnott S.; Hukins D. W. L. Nature 1969, 224, 886–888. [DOI] [PubMed] [Google Scholar]
- Low J. N.; Tollin P.; Wilson H. R. Nucleic Acids Res. 1982, 10, 5599–5604. [DOI] [PMC free article] [PubMed] [Google Scholar]
- Sokoloski J. E.; Godfrey S. A.; Dombrowski S. E.; Bevilacqua P. C. RNA 2011, 17, 1775–1787. [DOI] [PMC free article] [PubMed] [Google Scholar]
- Warf M. B.; Nakamori M.; Matthys C. M.; Thornton C. A.; Berglund J. A. Proc. Natl. Acad. Sci. U.S.A. 2009, 106, 18551–18556. [DOI] [PMC free article] [PubMed] [Google Scholar]
- Kumar A.; Park H.; Fang P.; Parkesh R.; Guo M.; Nettles K. W.; Disney M. D. Biochemistry 2011, 50, 9928–9935. [DOI] [PMC free article] [PubMed] [Google Scholar]
- Parkesh R.; Childs-Disney J. L.; Nakamori M.; Kumar A.; Wang E.; Wang T.; Hoskins J.; Tran T.; Housman D.; Thornton C. A.; Disney M. D. J. Am. Chem. Soc. 2012, 134, 4731–4742. [DOI] [PMC free article] [PubMed] [Google Scholar]
- Childs-Disney J. L.; Stepniak-Konieczna E.; Tran T.; Yildirim I.; Park H.; Chen C. Z.; Hoskins J.; Southall N.; Marugan J. J.; Patnaik S.; Zheng W.; Austin C. P.; Schatz G. C.; Sobczak K.; Thornton C. A.; Disney M. D. Nat. Commun. 2013, 4, 2044. [DOI] [PMC free article] [PubMed] [Google Scholar]
- Mathews D. H.; Disney M. D.; Childs J. L.; Schroeder S. J.; Zuker M.; Turner D. H. Proc. Natl. Acad. Sci. U.S.A. 2004, 101, 7287–7292. [DOI] [PMC free article] [PubMed] [Google Scholar]
- Mathews D. H.; Moss W. N.; Turner D. H. Cold Spring Harbor Perspect. Biol. 2010, 2, a003665. [DOI] [PMC free article] [PubMed] [Google Scholar]
- Lucks J. B.; Mortimer S. A.; Trapnell C.; Luo S.; Aviran S.; Schroth G. P.; Pachter L.; Doudna J. A.; Arkin A. P. Proc. Natl. Acad. Sci. U.S.A. 2011, 108, 11063–11068. [DOI] [PMC free article] [PubMed] [Google Scholar]
- Hajdin C. E.; Bellaousov S.; Huggins W.; Leonard C. W.; Mathews D. H.; Weeks K. M. Proc. Natl. Acad. Sci. U.S.A. 2013, 110, 5498–5503. [DOI] [PMC free article] [PubMed] [Google Scholar]
- Bellaousov S.; Reuter J. S.; Seetin M. G.; Mathews D. H. Nucleic Acids Res. 2013, 41, W471–W474. [DOI] [PMC free article] [PubMed] [Google Scholar]
- Ding Y.; Tang Y.; Kwok C. K.; Zhang Y.; Bevilacqua P. C.; Assmann S. M. Nature 2014, 505, 696–700. [DOI] [PubMed] [Google Scholar]
- Cruz J. A.; Blanchet M.-F.; Boniecki M.; Bujnicki J. M.; Chen S.-J.; Cao S.; Das R.; Ding F.; Dokholyan N. V.; Flores S. C.; Huang L.; Lavender C. A.; Lisi V.; Major F.; Mikolajczak K.; Patel D. J.; Philips A.; Puton T.; Santalucia J.; Sijenyi F.; Hermann T.; Rother K.; Rother M.; Serganov A.; Skorupski M.; Soltysinski T.; Sripakdeevong P.; Tuszynska I.; Weeks K. M.; Waldsich C.; Wildauer M.; Leontis N. B.; Westhof E. RNA 2012, 18, 610–625. [DOI] [PMC free article] [PubMed] [Google Scholar]
- Ditzler M. A.; Otyepka M.; Sponer J.; Walter N. G. Acc. Chem. Res. 2010, 43, 40–47. [DOI] [PMC free article] [PubMed] [Google Scholar]
- Manning G. S. Q. Rev. Biophys. 1978, 11, 179–246. [DOI] [PubMed] [Google Scholar]
- Manning G. S. Physica A 1996, 231, 236–253. [Google Scholar]
Associated Data
This section collects any data citations, data availability statements, or supplementary materials included in this article.