Abstract
With the recent results of promising cancer vaccines and immunotherapy1–5, immune monitoring has become increasingly relevant for measuring treatment-induced effects on T cells, and an essential tool for shedding light on the mechanisms responsible for a successful treatment. Flow cytometry is the canonical multi-parameter assay for the fine characterization of single cells in solution, and is ubiquitously used in pre-clinical tumor immunology and in cancer immunotherapy trials. Current state-of-the-art polychromatic flow cytometry involves multi-step, multi-reagent assays followed by sample acquisition on sophisticated instruments capable of capturing up to 20 parameters per cell at a rate of tens of thousands of cells per second. Given the complexity of flow cytometry assays, reproducibility is a major concern, especially for multi-center studies. A promising approach for improving reproducibility is the use of automated analysis borrowing from statistics, machine learning and information visualization21–23, as these methods directly address the subjectivity, operator-dependence, labor-intensive and low fidelity of manual analysis. However, it is quite time-consuming to investigate and test new automated analysis techniques on large data sets without some centralized information management system. For large-scale automated analysis to be practical, the presence of consistent and high-quality data linked to the raw FCS files is indispensable. In particular, the use of machine-readable standard vocabularies to characterize channel metadata is essential when constructing analytic pipelines to avoid errors in processing, analysis and interpretation of results. For automation, this high-quality metadata needs to be programmatically accessible, implying the need for a consistent Application Programming Interface (API). In this manuscript, we propose that upfront time spent normalizing flow cytometry data to conform to carefully designed data models enables automated analysis, potentially saving time in the long run. The ReFlow informatics framework was developed to address these data management challenges.
Keywords: Flow cytometry, data management, metadata, data provenance, reproducible analysis, laboratory informatics, REST API, automated analysis
Introduction
With the recent results of promising cancer vaccines and immunotherapy,1–5 immune monitoring has become increasingly relevant for measuring treatment-induced effects on T cells, and an essential tool for shedding light on the mechanisms responsible for a successful treatment. Flow cytometry is the canonical multi-parameter assay for the fine characterization of single cells in solution, and is ubiquitously used in preclinical tumor immunology and in cancer immunotherapy trials. Applications in cancer immune monitoring include characterizing the tumor-antigen specificity of a patient’s T cells by peptide–MHC multimers, intracellular staining for effector cytokines, evaluating cytotoxicity, measuring proliferation and assessing immune regulatory cells, including regulatory T cells and complex myeloid populations.5,6
Flow cytometry assays differentiate human immune cells via a combination of physical properties and fluorescent markers such as labeled monoclonal antibodies (mAb) targeting cell-specific molecules. Current state-of-the-art polychromatic flow cytometry involves multi-step, multi-reagent assays followed by sample acquisition on sophisticated instruments capable of capturing up to 20 parameters per cell at a rate of tens of thousands of cells per second.7 Advances in technology such as fluorescent dyes with less spectral overlap,8 improved deconvolution methods for resolving complex emission spectra, and the use of new mass spectrometry approaches means that the number of measurable parameters will continue to increase in the near future.9
Given the complexity of flow cytometry assays, reproducibility is a major concern, especially for multi-center studies. This has been demonstrated in proficiency testing, where participating laboratories receive identical blood samples and report the results of pre-specified analysis to the coordinating center. These proficiency panels have shown large variations in the performance of T-cell assays among the flow community, especially for the quantification of low frequency cell subsets.10,11 The flow community has made great strides in reproducibility, with notable advances being the establishment of data standards,12–14 the development of standardized panels to characterize known basic cell subsets by the Human Immune Profiling Consortium (HIPC),15 sharing of rigorously developed panels via the optimized multicolor immunofluorescence panels (OMIP) initiative,16 and widespread participation in proficiency testing programs that aim to harmonize procedures across laboratories.17–19
However, flow cytometry data used in immune monitoring are often loosely annotated, with the metadata necessary for interpretation distributed over multiple sources (eg, file naming conventions, spreadsheets, presentations). Hence, much pre-processing may be necessary to coerce the data into a form suitable for automated processing, often via error-prone ad-hoc programming scripts. The effort required for pre- processing data is typically disproportionately larger when the data come from different laboratories. In this manuscript, we propose that upfront time spent normalizing flow cytometry data to conform to carefully designed data models enables automated analysis, potentially saving time in the long run.
Strategies for achieving reproducible data acquisition in flow cytometry are similar to other research domains. It is critical that detailed standard operating procedures (SOPs) that accurately reflect the current practices within a laboratory are drafted for panel development, cytometer calibration, reagent qualification, and sample preparation. Further, staff must be regularly trained on those SOPs, and stringent quality management practices must be in place.10,11,17,18,20 However, even when laboratory procedures are followed, data management remains a significant impediment. Flow cytometry data are often stored on local computer systems or shared network drives, with users frequently creating separate copies to review the data in specialized software applications installed on local workstations. In addition, calibration data, usually obtained on a daily basis, may be stored in a different location.
Reproducibility in the analysis of flow cytometry data is also a major challenge. The process of selecting groups of events within a flow cytometry standard (FCS) file, representing different cell subsets, is referred to as gating strategy. This selection is influenced by many factors including the analyst’s understanding of the parameters’ relationship to cell subsets, the data transformation applied to view the data, the compensation applied to correct for fluorescent spillover, the order in which the gates are placed, analyst subjectivity in the placement of gate boundaries, and the use of different gating shapes (polygons, ellipses, quadrants, etc.). As is now widely recognized, manual gating is poorly suited for the analysis of multi-dimensional data, both because of our lack of intuition for higher dimensional spaces and the inefficiency of selecting events using a sequence of two-dimensional scatter plots.
A promising approach for improving reproducibility is the use of automated analysis borrowing from statistics, machine learning, and information visualization,21–23 as these methods directly address the subjectivity, operator dependence, labor intensiveness, and low fidelity of manual analysis. However, it is quite time-consuming to investigate and test new automated analysis techniques on large data sets without some centralized information management system.
Automated analysis requires structured data formats, typically in the form of a data matrix. However, annotation inconsistencies of most flow laboratories require extensive pre-processing and dialog between the bioinformatician and the clinical researcher to prepare data for automated analysis. Further, multi-center data tend to introduce larger time gaps between the data acquisition and the analysis, increasing the chance for errors because of miscommunication. Inconsistencies common in flow cytometry data include different names for the same antibody or fluorochrome, the use of different fluorochromes conjugated to the same antibody in different laboratories, or data acquired with extra parameters not present in samples from other laboratories.
The FCS defines the file format for data acquired from a cytometer. However, FCS does not define standard values for labeling individual channels,24 hence data annotation practices can vary greatly between and within flow cytometry laboratories. In some cases, marker and/or fluorochrome names are either implied based on global instrument configuration labels or absent entirely, making it impossible for the bio informatician to map the appropriate marker to its corresponding parameter. The metadata necessary to interpret these flow cytometry data sets may only be available in a spreadsheet or presentation slide, requiring time-consuming and error-prone cross-referencing.
For large-scale automated analysis to be practical, the presence of consistent and high-quality data linked to the raw FCS files is indispensable. In particular, the use of machine-readable standard vocabularies to characterize channel meta-data is essential when constructing analytic pipelines to avoid errors in processing, analysis, and interpretation of results. For automation, these high-quality metadata need to be programmatically accessible, implying the need for a consistent application programming interface (API).
Finally, it is indispensable for multi-center flow cytometry studies to accrue sufficient samples in order to search for complex cellular biomarkers effectively, which poses even greater challenges for data management, annotation, and analysis. For comparative analysis, it is necessary that all the centers performing flow cytometry analysis have consistent methods to identify and quantify these cell subsets. Such consistency can be achieved in a distributed fashion via harmonization or standardization programs, or analysis can be performed at a central location.17,23,25,26 Distributed analysis is often preferred because it preserves the autonomy of local laboratories, and avoids the complex and potentially expensive logistics of having to process, cryopreserve, and ship the samples in a timely fashion to the central laboratory. In this case, the management, reconciliation, and analysis of flow cytometry data from multiple laboratories can be extremely challenging, as different laboratories will have their own protocols for the annotation of FCS files. In our experience with the EQAPOL project, even when laboratories are given a standard annotation protocol to follow, the FCS metadata still varied across laboratories. The ReFlow informatics framework was developed to address these data management challenges.
The ReFlow Framework for Reproducible Flow Analysis
Constraints and requirements
We developed the ReFlow framework to address the challenge of inconsistent FCS meta-data annotation so that data can be processed by automated analysis routines without time-consuming and error-prone manual pre-processing. Since there is no way for bioinformaticians to control individual laboratory practices, ReFlow was designed to store FCS data regardless of specific annotation, as long as the needed information could be provided by the flow operator at the time of upload. However, ReFlow will also take advantage of consistent and complete annotation in the FCS metadata to automate data categorization, streamlining the upload process for laboratories with good annotation practices.
Based on the above considerations, a summary of the core requirements for the ReFlow framework is listed below:
Automate the analysis of flow cytometry data to identify potential cell subsets without manual processing (gating)
Avoid requiring changes to individual laboratory practices – as this is not a feasible option for many labs
Manage data from multi-center clinical trials as well as proficiency testing programs, both of which share a multi-center design but with different emphasis (single-center data are a simpler, special case)
Allow remote labs to conveniently share flow cytometry data with a coordinating center
Restrict user access to data by project as well as to laboratory data within a project
Restrict data modification and analysis actions to specific users
Allow a project administrator to pre-define the required parameters for flow cytometry panels
Provide a user-friendly interface for a typical immunology researcher or flow cytometry analyst
Design considerations
Most of the design considerations emerged naturally from the project requirements. Since the flow analysts, researchers, or clinicians generating the data are most familiar with their data annotation, a major focus of ReFlow was to allow flow cytometry experts to categorize data within ReFlow rather than bioinformaticians. In order to provide a streamlined process for researchers to categorize and upload their own data, we designed data models to reflect real-world flow cytometry concepts and terms, created a user interface with responsive feedback, enforced consistent use of standard terminology, and avoided any local installation of software packages.
At the heart of the domain model is the panel, a flow cytometry concept that refers to the specific combination of markers (eg, mAbs), light scatter, and fluorochromes used in an experiment. In multi-center trials or proficiency testing programs, the parameters required for a panel are specified by the coordinating center. In standardized situations, participating laboratories have to meet the requirements exactly; in harmonized situations, participating laboratories must meet preselected mandatory requirements but have some flexibility in the choice of reagents and additional parameters to record.
We also wanted to ensure that ReFlow is scalable to future needs, while also being easy to maintain and extend. To this end, we took a “do one thing, and do it well” philosophy for the individual components. To facilitate deployment in multiple environments, we chose technology allowing ReFlow to be operating system and database agnostic. We wanted the data consumption via clients to be language agnostic as well, so that a user could use any programming language to interact with the system.
While ReFlow provides an easily accessible and modern web interface, it was not designed as Software as a Service (SaaS). This was intentional, as many laboratories and institutions cannot store their data on external servers because of Health Insurance Portability and Accountability Act (HIPAA) concerns. Furthermore, the resources to store and process the entire flow community’s data would be prohibitively expensive. Since ReFlow is developed by and for nonprofit academic institutions this structure is not feasible. As a freely available, open-source software project, ReFlow is available for any group to install and use as a standalone cytometry informatics management system, or as a front end for ensuring consistent data annotation.
Implementation
Summary of approach
ReFlow consists of a back end relational database server and a front end web interface designed as a single page application, with an intermediary web framework providing an object-relational mapping (ORM) interface to the database and controlling client-side access to resources. Communication between clients and the web framework takes place via a representational state transfer (REST) API, decoupling data from presentation. An overview of the connections between these system components is shown in Figure 1.
Figure 1.
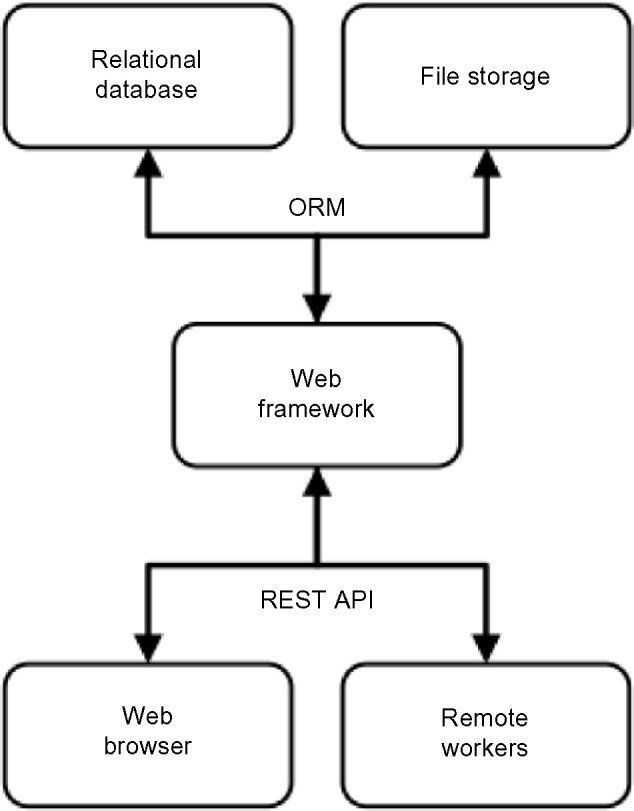
Overview of ReFlow hardware components.
To minimize extra memory or processing burdens on the ReFlow server, the processing workload is decoupled from the web server. Analysis pipelines are executed by remotely distributed worker clients that also utilize the REST API for communicating to a central ReFlow server. ReFlow workers can be deployed as needed or available, with each worker polling the central server at regular intervals using token authentication to check for available jobs. This pull-based scheme was chosen to avoid network issues such as dynamic IP addresses and firewalls, as the workers may be distributed over many different locations and networks.
The software developed for the ReFlow project is divided into several independent packages, each with its own version control repository (Fig. 2). The main ReFlow repository contains the web application developed in the Python-based Django web framework and the JavaScript-based AngularJS client-side framework. The ReFlowRESTClient package is a reference implementation in Python for client-side interaction with the REST API exposed by the ReFlow web application. All processing for the analysis pipeline is performed by the ReFlowWorker package, which employs the ReFlowREST-Client for interacting with the ReFlow server. In addition, there are three helper libraries independent of the ReFlow system used for interacting with FCS files: FlowIO, for reading and writing FCS files; FlowUtils, containing utility functions for transforming and compensating flow cytometry data; and FlowStats, which contains the statistical functions used for clustering multi-dimensional flow cytometry data. These independent flow cytometry libraries are based on previous work in our lab.21,27–31
Figure 2.
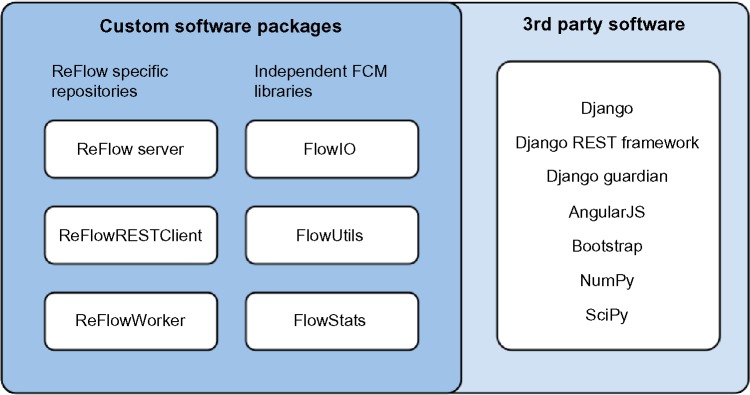
Overview of ReFlow software components.
Web framework and file storage
We chose the Django web framework as it provided a convenient ORM that met our design consideration for a database agnostic platform and was compatible with our existing Python code base for processing FCS files. It also provided a rich set of third party libraries, such as a library for creating REST APIs and a library for the management of granular object-level user permissions.
The back end stores the data and metadata for every uploaded FCS data file. The actual FCS binary files are stored as a Django FileField, which stores the files on a file system with a database reference to the file’s path. An SHA–1 checksum is generated and stored for every uploaded FCS file to ensure data integrity and prevent duplication of files within the same project. The metadata within each FCS file is recorded in a separate table for more efficient searching. On upload, the data for each FCS file are sub-sampled at 10,000 events with the sub-sampled event indices recorded. The sub-sampled data is then saved as a NumPy data file in a separate Django FileField that allows clients to quickly access the flow data in either NumPy or CSV format. Note that the original full data set is also always available; the sub-sampled data are a convenience for rapid analysis and plotting.
Data models for domain-specific concepts
Many tables in the database are fairly straightforward and capture the relationships between a project and its sites (laboratories), subject groups, subjects, samples, and so on. The most complex data models center on the concept of flow cytometry panels, which specify how the channels of FCS data files are mapped to ReFlow naming conventions and also enable verification that the project’s requirements for the panel design are met. Other tables handle administrative concerns such as tracking users and their permissions, as well as the input and output of analytic processes. A summary of the main database schema is shown in Figure 3.
Figure 3.
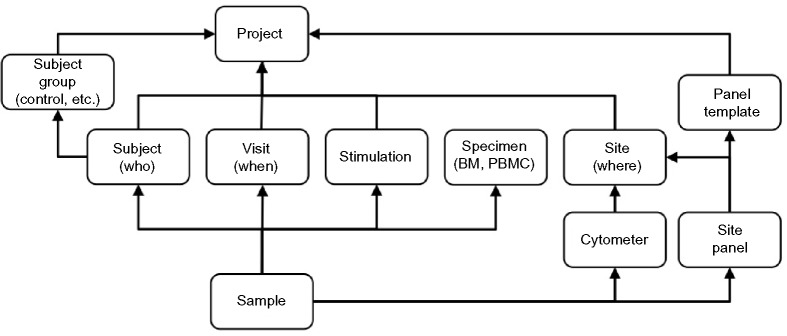
Data schema for ReFlow showing the mapping of table names to flow cytometry domain concepts. Arrows indicate foreign key relationships between database tables.
Reflecting the need to mandate specific panel requirements, a two-tiered panel schema is employed. The top level Panel Template captures the abstract requirements of an experiment – for example, that the antibodies against CD3 and CD8 must be present, that CD3 is conjugated to the FITC fluorochrome, and that only the area “-A” measurement for each antibody–fluorochrome pair is required. At a minimum, each data set must be associated with a Full Stain template; there may also be related partial templates such as Fluorescence Minus One (FMO) or Isotype Control templates that are defined and interpreted in relation to a Full Stain panel.32 In contrast, the lower tier, called the Site Panel, captures the actual measurements made in an experiment and how they map to data columns in the matrix of measured values in the FCS file. Site Panels may have additional parameters in addition to those specified in the Panel Template; however, any FCS file lacking a parameter specified in its parent Panel Template will be rejected. The panel concept embodies the most complex set of relationships in the schema, and was developed with extensive feedback from flow cytometry users and experts.
Both the Panel Template and Site Panel models are assembled using related parameter models, the Panel Template Parameter and Site Panel Parameter, respectively. Each of these parameter models was built using data in the Marker and Fluorochrome models, which contain pre-defined markers and fluorochromes serving to control the vocabulary used for mapping to FCS file channel annotation. The parameter models also have relationships for defining the function (Forward Scatter, Side Scatter, Fluorochrome Conjugated Marker, Unstained, Isotype Control, Exclusion, Viability, Isotope Conjugated Marker, Time, Compensation Bead, Null) and value type (Area, Height, Width, Time) for each channel (Fig. 4).
Figure 4.
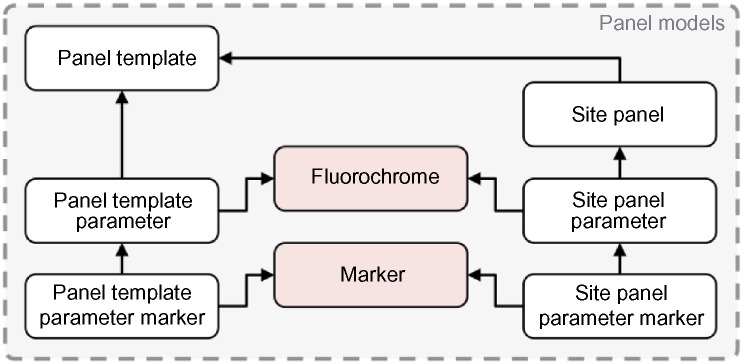
Data schema detail for ReFlow showing the relationships that define the Panel Template and Site Panel domain concepts.
Data models for automated analysis
The data models for defining analysis pipelines and capturing the inputs/outputs for process requests were designed to permit flexibility for future additions or modifications without requiring changes to the existing database schema. To accomplish this, two main design concepts were employed: (1) an abstraction to separate the distinct operations that comprise a processing pipeline and (2) a data modeling scheme that requires any pipeline to classify all events in all analyzed samples as belonging to some category.
The Sub-process Category model defines classes for processing steps used to build a complete analysis pipeline. Currently, these include transformation, filtering, and clustering operations. The Sub-process Implementation model defines concrete instances of sub-process operations. For example, one implementation for the clustering category may be “HDP” for the hierarchical Dirichlet Process clustering algorithm.28 Finally, each implementation must define its inputs in the Sub-process Input model. The sub-process inputs provide the details for the type of value allowed for each implementation input. Continuing with the HDP implementation example, there is an input for the cluster count that is defined as a required field with a positive integer value.
The Process Request model captures individual process requests submitted by users. The Process Request Input model is a key-value design, where each key is the Sub-process Input used to identify the input. The user specifies the value corresponding to this key during the creation of the process request. The inputs do not specify the FCS samples to be included for processing in the process request; a separate Sample Collection model that provides a many-to-many relationship with the FCS sample model captures the FCS samples selected by the user for analysis (Fig. 5).
Figure 5.
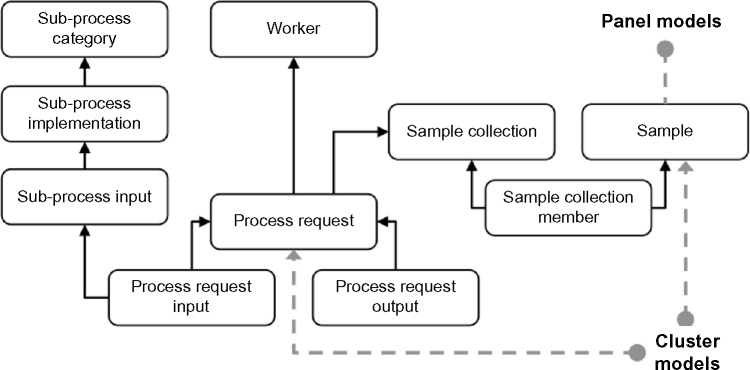
Data schema for ReFlow showing the process request models.
The ReFlow Worker model contains the names and credentials of the remote workers. For security, a ReFlow administrator must register each remote worker in the Worker model, and only a registered worker can request assignment of an individual process request. Since the ReFlow server does not contain any information about the analysis implementation, the actual worker can be implemented in any programming language, provided the implementation follows the web service contract via the appropriate web API calls. We provide a reference implementation for a ReFlow worker in the ReFlow-Worker software package.
When an assigned ReFlow worker completes a process request, the clustering output data used for visualizing and reporting analysis results is sent to the ReFlow server along with the optional algorithm-specific Process Request Output data files. The clustering output is stored in a structured collection of data models where every event is assigned to a sample cluster via the Events Classification and Sample Cluster tables. Sample Clusters belong to a parent Cluster that is shared among all samples in the process request, allowing the possibility of identifying aligned clusters over different samples. A future refinement of this scheme will use the adjacency list model to capture biological lineage hierarchies (Fig. 6).
Figure 6.
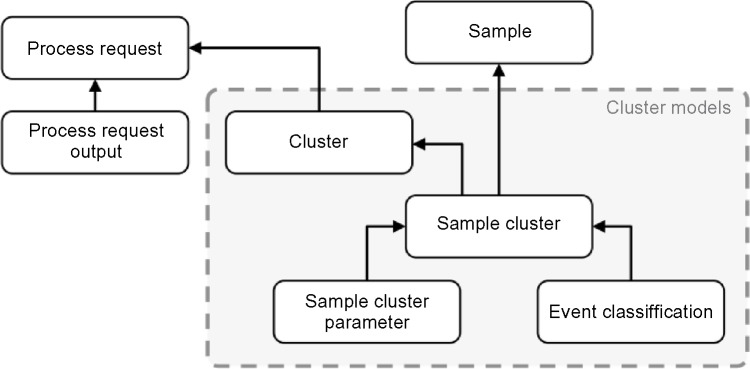
ReFlow data schema illustrating clustering models used to store process request results.
The Process Request Output model is a key-value table containing implementation-specific details beyond what is captured in the cluster models. These output files are intended to capture details of the implementation to enable reproducibility of the analysis pipeline outside of the ReFlow ecosystem, but are not directly used by ReFlow for visualization and reporting.
Authentication and user permissions
ReFlow is designed for use by a central laboratory processing FCS files from several different laboratories, for example, to coordinate proficiency testing programs or a multi-center study. Hence there are different user roles requiring customized access – for example, the central laboratory staff must be able to view data from all laboratories, but participating laboratories should only have access to their own data for review, editing, and analysis. Interactive access is governed by standard username/password session authentication, and the site will automatically log users out beyond a specified duration of inactivity. The REST API allows session or token authentication. For programmatic access via the REST API, token authentication is recommended as a compromised token can easily be revoked and re-generated without resetting a user’s password. The use of token authentication for programmatic access also allows users to avoid storing passwords within their local script files.
Each project and site has administrative and user level permissions. A project administrator may have full access to their specific project or site content, as well as the capability to manage users for that project or site. Object level permissions are provided by Django Guardian (https://github.com/lukaszb/django-guardian), and custom permissions can be set for users to view, add, or modify data for individual sites or projects. There are also superusers with the ability to create new projects, as well as add or modify the controlled vocabulary models such as the Marker and Fluorochrome tables.
To allow deployed ReFlowWorker clients access to data for automated analysis yet keep data from being accessible by the general public, worker access also requires authentication. Workers are assigned user accounts, however, unlike regular users, workers are restricted to only token authentication and are not allowed to use session authentication. Since workers do not have a password and are barred from authenticating via the web interface, they are less likely to become compromised and used for nefarious purposes. In addition, the use of encryption via the Hypertext Transfer Protocol Secure (HTTPS) is encouraged for all ReFlow server deployments to protect data communications from eavesdropping.
REST API and client reference implementation
ReFlow uses the Django REST Framework (http://www.django-rest-framework.org) to provide a REST API for communications between clients and the Django ORM using the Hypertext Transfer Protocol (HTTP). We also use the Django REST Framework Docs package to provide a web-based description of the REST API structure. The REST API is utilized for communication with the single-page application front end and for programmatic access to ReFlow data stores. Standard HTTP request methods are used to perform specific actions on ReFlow resources. The resource model for the ReFlow REST API is designed to be consistent and predictable, and uses a common pattern for accessing the various ReFlow resources (Fig. 7).
Figure 7.

ReFlow REST API URL schema illustrating various component labels.
The protocol and domain are determined by the web server configuration for a particular ReFlow deployment. The URL path for all ReFlow REST API resources begin with the “/api/repository/” sub-path. Resources are grouped into two categories: singletons and collections. Singleton resources represent a single database record, whereas collections provide a list of singleton resources. All collections within the ReFlow REST API are homogeneous, meaning they are lists of the same resource type (eg, a list of sites). Resources can be retrieved via their primary keys, and collections may additionally be filtered using a standard HTTP query string with multiple query parameters separated by the “&” character. The example URL in Figure 7 returns the site collection resource filtered by project and site name using an HTTP GET request. All resources are returned in the JavaScript Object Notation (JSON) data format.
In addition to retrieving records via an HTTP GET request, the REST API also allows the creation, modification, and deletion of resources using the HTTP actions POST, PUT, and DELETE, respectively. All actions that use the interactive single-page application front end are realized via the REST API; thus any interactive user operation done via the web interface can also be performed programmatically via the REST API, provided the authenticating user has the appropriate privileges.
The ReFlowRESTClient, a client reference implementation for interacting with the ReFlow REST API and freely available as an open source library on GitHub, is implemented in the Python programming language. The ReFlowWorker software package utilizes this client library for communicating all process request related information to and from the ReFlow server. However, since ReFlow utilizes a standard HTTP-based API, any software HTTP library can be used for programmatic access to a ReFlow server’s resources for any task ranging from the simple retrieval of resources to the construction of complex analysis pipelines that post results back to the ReFlow server.
Single-page application
As some flow cytometry users do not have software installation privileges, we designed ReFlow so that the whole user interaction could occur via the web. Although Django is a full-stack web framework, we chose to use the AngularJS library for interactive web access. Because of the complex requirements for user interaction, such as the creation of panels or categorizing multiple FCS files for concurrent uploading, the standard Django forms infrastructure became quite tedious and fragile. Our first attempt at combining Django forms and jQuery for user interactions negatively impacted the user experience because of the lack of responsiveness caused by multiple HTTP request–response cycles. With AngularJS, we were able to create a single-page application to provide a user experience that is similar to interacting with a desktop application. In the single-page application design, the web page changes dynamically in response to user-generated events similar to desktop graphical user interfaces (GUI), and any needed data are transferred asynchronously from the server to the browser client via the REST API.
Workflow
The main use cases for ReFlow are (1) a project coordinator/administrator specifies the project panels, manages site users, and reviews uploaded data from each site participating in the project; (2) a site user uploads and categorizes FCS data files using a standard vocabulary, and (3) an analyst runs analytic pipelines and generates reports about some subset of FCS files within the project. Of course, any particular user may play multiple roles. Here, we describe the workflow for these use cases.
Project setup
A project administrator pre-populates the range of sites, cytometers, panel templates, subjects, and visit codes via the single-page application web interface. These operations typically only need to be done once per project, although updates and revisions are of course possible.
Uploading data
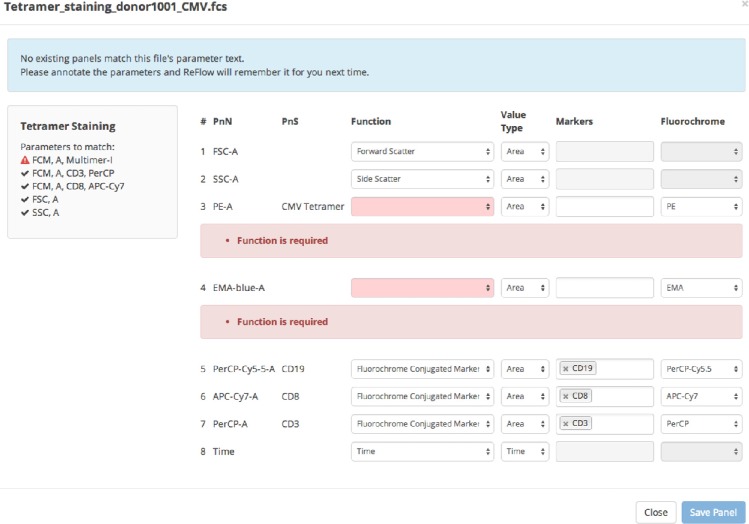
Users upload FCS files via the web using the HTML5 multiple file upload feature. A primary goal of ReFlow is to ensure consistent naming conventions for data parameters across multiple centers. All FCS files must be fully categorized during this upload process (see Fig. 8). Every effort was made so that users could adequately and efficiently describe FCS files, making full use of the dynamic updating afforded by AngularJS. For example, the drop-down selections are dynamically updated – since all FCS uploads are initiated within a project, only parameters compatible with that particular project are available for selection. After a site is selected, the selection choices are further whittled down. This reduces both the burden for the user and the risk of incorrectly categorizing project data.
Figure 8.
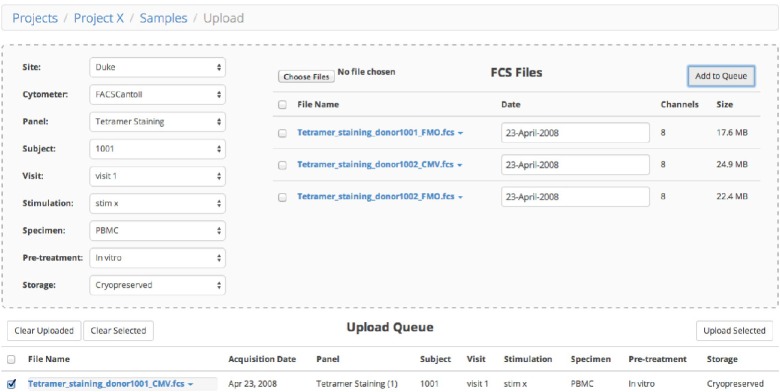
Sample upload snapshot.
When FCS files are dragged to the upload area, they are immediately read by a custom JavaScript FCS parser to extract the metadata, which is immediately viewable by clicking on the filename and choosing View Metadata or View Channels. The file metadata is used to automatically populate the Date field (which is still editable). The FCS metadata values in the $PnN and $PnS fields are validated against the existing site panels matching the user-selected Project Template. ReFlow automatically searches for an exact Site Panel match – if no matching site panel is available, the user is guided through the process to create a new site panel (Fig. 9).
Figure 9.
Panel creation snapshot.
Creating a site panel from an FCS file requires the user to properly identify all the channels present in the file. The site panel effectively acts as a map between the file’s annotation and the naming conventions used by ReFlow. The site panel dialog window is semi-guided as ReFlow attempts to match any text found in the channel annotation with existing markers and fluorochromes. The user can, of course, override these pre-filled default values. Laboratories that have included meaningful channel names will have little additional work to do beyond accepting the proposed mapping. Once ReFlow has “learned” the file’s annotation, subsequent FCS files with the same annotation will be automatically matched when added to the file upload area.
Once files are fully categorized, they can be added to the Upload Queue, which provides a summary of the categories selected for each FCS file. After reviewing their choices, the user can select multiple files for concurrent upload to ReFlow, with an option to send incorrectly annotated files back to the annotation tool for revision. In our testing sessions, once users get familiar with the ReFlow interface, it only takes a few minutes to categorize a new batch of FCS files.
Data analysis
While the focus of the manuscript is on data management, the ultimate goal of ReFlow is to provide a front end for reproducible unsupervised or semi-supervised automated analysis. As proof of concept, ReFlow currently provides a convenient interface to perform multi-sample clustering using our hierarchical Dirichlet Gaussian mixture model.28 The intention is to eventually generalize the analysis interface to accommodate new algorithms implemented in any programming language.22
A process request is generated via a dynamic “wizard” interface that guides the user through sample selection via property filters, selection of FCS channels to be included, pre-processing options, and parameters for the statistical mixture model. New requests are posted to the process queue and processed by remote workers as previously described. Critically, a complete record of all process parameters is recorded in the ReFlow database, facilitating tracking and review of process requests for reproducible analysis.
When a user submits a request to analyze a selected data set, ReFlow updates the request status on a process dashboard to Pending, and puts it in a process request queue. The queue is polled by remote workers registered with ReFlow (using token authentication), and the request is assigned on a first come, first served basis. A registered worker requests assignment, and once ReFlow grants the assignment, the process request status is updated to Working. When the worker completes the task, the results are posted, and the ReFlow server updates the status to Completed.
Visualizing analysis results
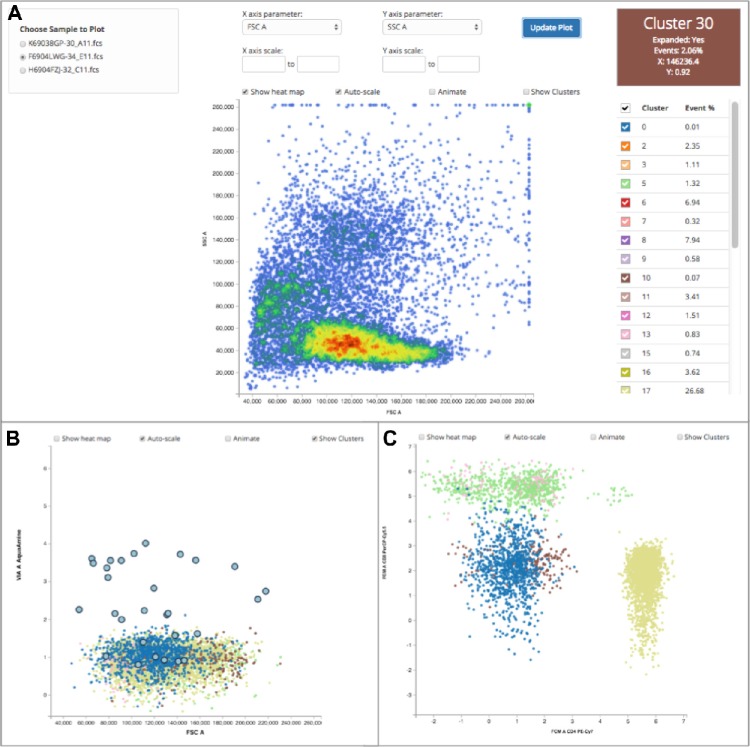
The detail view for a completed process request contains a link to visualize the clustering results stored in the cluster models as an interactive scatterplot. The interactive visualization is implemented in the D3.js JavaScript library (http://d3js.org) and provides a more intuitive interface for understanding the relationships between cluster events in high-dimensional data than is available in traditional static images. Samples are compensated within the web client using the same compensation matrices used for the analysis, and fluorescence channels are transformed using an inverse hyperbolic sine transformation. For each sample, the sample events can be viewed superimposed on their corresponding cluster representations.
Figure 10A shows the main visualization display, with the left panel for choosing samples analyzed in the process request, the middle panel for visualizing clustering and event data, and the right panel for selecting and interrogating individual clusters. In the left panel, choosing a sample retrieves the clustering and event data for that sample from the back end database. The main component of the middle panel is the interactive scatterplot, which displays events colored by local density (heat-map) or by cluster assignment. Clicking on a cluster centroid in a sample toggles the display of its associated events. When animation is enabled, the transition path for each centroid and event is shown dynamically as the user selects different FCS parameters. Above the scatterplot are options for changing the parameters displayed, specifying the axes scale values, toggling the heat map display, disabling the transition animations, as well as toggling the visibility of cluster centroids. The right panel contains a table of the clusters present within the scatterplot along with a color-coded checkbox for controlling the display of events within that cluster. The event data for each cluster can also be viewed by simply clicking on a cluster. All events can be viewed by clicking on the checkbox in the header row of the cluster table. Finally, in the upper right there is a color-coded cluster information panel, updated when the user hovers their mouse over a cluster centroid, showing the event percentage and location of the selected cluster.
Figure 10.
ReFlow screen shot demonstrating the visualization of clustering data. A detailed explanation of the viewing options is presented in the main text.
Figure 10B demonstrates how a user can select for clusters corresponding to viable lymphocytes and display their assigned events colored by cluster by clicking on the appropriate cluster centroids. In Figure 10C, a different projection of these viable lymphocytes (on CD4 and CD8) is shown, now with cluster centroids toggled off to better see the distribution of individual events. This interactive display makes it simple for laboratory users to evaluate the results of the clustering algorithm and identify clusters corresponding to subsets of interest.
User testing
The data management aspects of the ReFlow framework were beta tested by a group of eight flow cytometry laboratories in Europe and USA to evaluate workflow, functionality, and usability by typical flow analysts. Laboratories participated in focused tasks, including uploading FCS files using the web interface, creation of site panels, creation of project panels, and creation of project metadata. Each laboratory was asked to provide directed feedback to specific questions about the functionality and usability of the system.
As an example of critical early feedback, we initially developed a desktop application for file upload and annotation, but two laboratories were not able to use it because of institutional firewall protocols, driving us toward a solution that did not require local software installation. The creation of the single-page application web interface using AngularJS was investigated and ultimately used to avoid local software installation, with the added benefit of eliminating cross-platform development of the FCS upload tool.
Another example where useful feedback led to a much improved user experience was the overall consensus that the site panel creation process was tedious and time-consuming. The process was initially implemented in such a way that required potentially large FCS files to first be uploaded in order for the ReFlow back end to parse the FCS metadata for the channel annotation. In response, we developed a JavaScript-based FCS file reader to avoid having to upload files prior to creating a site panel. Again, the use of AngularJS allowed a dynamic web interface where site panels could be created on the fly during FCS uploads. The result was a much more efficient workflow.
In addition to the questionnaires, we also benefited from group discussions with the participating laboratories over video conferencing sessions. The data model schema and many of the features described in this manuscript resulted from the valuable serial feedback provided by our testers. Examples of the testing instructions and feedback questionnaires are provided in Supplementary materials.
Conclusion
We describe a flow cytometry informatics system organized around domain concepts that simplifies and validates flow cytometry data annotation for multi-center studies. The frame work is currently being developed for use in managing flow cytometry proficiency test data from the Cancer Immuno guiding Program of the Association for Cancer Immunotherapy (CIP/CIMT) with support from the Wal-lace Coulter Foundation and the External Quality Assurance Program Oversight Laboratory (EQAPOL), a NIH-funded program to standardize immunological assays in HIV clinical research laboratories. As we have described above, the design of ReFlow leverages standards to provide a modern web user interface with defined user roles and granular permissions, decouples data models from the interface by having a well-designed REST API, and is scalable to large-scale analysis.
Because ReFlow generates a semantic mapping from marker/antibody to channel number for every FCS file, it provides a simple and reproducible mechanism to analyze data with a common panel template across multiple laboratories. The ReFlow interface is expected to greatly reduce the pre-processing burden for multi-center data from proficiency testing programs, and this together with the automatic capture of process request parameters in the database results in a more robust pipeline for analysis of flow cytometry data.
Future developments will include expansion of the data analysis pipeline to incorporate a richer set of algorithms, more flexible management of remote workers and load-balancing, export of annotated FCS files for use in third party software, enhancements in the visualization of analysis results using D3.js, and template-guided automated generation of reports.
Software availability
The ReFlow software is under an open-source BSD license and freely available for download from GitHub. A ReFlow server may be deployed using a traditional web server such as Apache or Microsoft IIS, and configured to use either the standard HTTP or HTTPS for more secure communication.
ReFlow web application: https://github.com/whitews/ReFlow
ReFlow REST client (Python): https://github.com/whitews/ReFlowRESTClient
ReFlow Worker: https://github.com/whitews/ReFlowWorker
FlowUtils: https://github.com/whitews/FlowUtils
FlowStats: https://github.com/whitews/FlowStats
Supplementary Materials
The following materials include the instructions provided to the test groups for the first four phases of testing as well as the annotation guides for the test data:
data_annotation.pdf - Guide for categorizing the test data within ReFlow
lab_parameters.pdf - The channel metadata found within the FCS files used for testing.
ReFlow_Testing_Phase_01_Procedure.pdf The test procedure for the first test phase.
ReFlow_Testing_Phase_02_Procedure.pdf - The test procedure for the second test phase.
ReFlow_Testing_Phase_03_Procedure.pdf The test procedure for the third test phase.
ReFlow_Testing_Phase_04_Procedure.pdf The test procedure for the fourth test phase.
Acknowledgments
We would like to thank the following individuals for graciously assisting with the testing of ReFlow over the last year or providing FCS files for user testing and evaluation (in alphabetical order): Angelica Cazaly, Sine Reker Hadrup, Sonja Heidu, Pia Kvistborg, Dominik Maurer, Christian Ottensmeier, Graham Pawelec, Daisy Philips, Steffen Walter, and Jasmin Ziegler.
Footnotes
ACADEMIC EDITOR: JT Efird, Editor in Chief
FUNDING: CG, MW, SvdB, and CB are members of the steering committee of the CIMT Immunoguiding Program (CIP). The CIP, CC, and SW are supported by a grant of the Wallace Coulter Foundation (Miami, Florida). CG is supported by a grant of the Deutsche Forschungsgemeinschaft SFB685. SW, CC, JS, and KW are supported by grants to the Duke University Center for AIDS Research and EQAPOL program funded by NIH grant 5P30 AI064518 and NIH contract HHSN272201000045C, respectively. The authors confirm that the funders had no influence over the study design, content of the article, or selection of this journal.
COMPETING INTERESTS: JS is a consultant for ImmusanT. Other authors disclose no potential conflicts of interest.
Paper subject to independent expert blind peer review by minimum of two reviewers. All editorial decisions made by independent academic editor. Upon submission manuscript was subject to anti-plagiarism scanning. Prior to publication all authors have given signed confirmation of agreement to article publication and compliance with all applicable ethical and legal requirements, including the accuracy of author and contributor information, disclosure of competing interests and funding sources, compliance with ethical requirements relating to human and animal study participants, and compliance with any copyright requirements of third parties. This journal is a member of the Committee on Publication Ethics (COPE).
Author Contributions
Conceived and designed the experiments: SW, KL, MJPW, NB, SHB, CMB, JE, JS, KJW, CG, CC. Wrote the first draft of the manuscript: CC. Contributed to the writing of the manuscript: SW, CC. Agree with manuscript results and conclusions: SW, KL, MJPW, NB, SHB, CMB, JE, JS, KJW, CG, CC. Jointly developed the structure and arguments for the paper: SW, CC. Made critical revisions and approved final version: SHB, CB, JS, CG. All authors reviewed and approved of the final manuscript.
REFERENCES
- 1.Higano CS, Schellhammer PF, Small EJ, et al. Integrated data from 2 randomized, double-blind, placebo-controlled, phase 3 trials of active cellular immunotherapy with sipuleucel-T in advanced prostate cancer. Cancer. 2009;115:3670–9. doi: 10.1002/cncr.24429. [DOI] [PubMed] [Google Scholar]
- 2.Hodi FS, O’Day SJ, McDermott DF, et al. Improved survival with ipilimumab in patients with metastatic melanoma. N Engl J Med. 2010;363:711–23. doi: 10.1056/NEJMoa1003466. [DOI] [PMC free article] [PubMed] [Google Scholar]
- 3.Kenter GG, Welters MJ, Valentijn AR, et al. Vaccination against HPV-16 oncoproteins for vulvar intraepithelial neoplasia. N Engl J Med. 2009;361:1838–47. doi: 10.1056/NEJMoa0810097. [DOI] [PubMed] [Google Scholar]
- 4.Topalian SL, Hodi FS, Brahmer JR, et al. Safety, activity, and immune correlates of anti-PD-1 antibody in cancer. N Engl J Med. 2012;366:2443–54. doi: 10.1056/NEJMoa1200690. [DOI] [PMC free article] [PubMed] [Google Scholar]
- 5.Walter S, Weinschenk T, Stenzl A, et al. Multipeptide immune response to cancer vaccine IMA901 after single-dose cyclophosphamide associates with longer patient survival. Nat Med. 2012;18:1254–61. doi: 10.1038/nm.2883. [DOI] [PubMed] [Google Scholar]
- 6.Fox BA, Schendel DJ, Butterfield LH, et al. Defining the critical hurdles in cancer immunotherapy. J Transl Med. 2011;9:214. doi: 10.1186/1479-5876-9-214. [DOI] [PMC free article] [PubMed] [Google Scholar]
- 7.Herzenberg LA, Tung J, Moore WA, Herzenberg LA, Parks DR. Interpreting flow cytometry data: a guide for the perplexed. Nat Immunol. 2006;7:681–5. doi: 10.1038/ni0706-681. [DOI] [PubMed] [Google Scholar]
- 8.Chattopadhyay PK, Gaylord B, Palmer A, et al. Brilliant violet fluorophores: a new class of ultrabright fluorescent compounds for immunofluorescence experiments. Cytometry A. 2012;81:456–66. doi: 10.1002/cyto.a.22043. [DOI] [PubMed] [Google Scholar]
- 9.Chattopadhyay PK, Roederer M. Cytometry: today’s technology and tomorrow’s horizons. Methods. 2012;57:251–8. doi: 10.1016/j.ymeth.2012.02.009. [DOI] [PMC free article] [PubMed] [Google Scholar]
- 10.McNeil LKPL, Britten CM, Jaimes M, et al. A harmonized approach to intracellular cytokine staining gating: results from an international multi-consortia proficiency panel conducted by the cancer immunotherapy consortium (CIC/CRI) Cytometry A. 2013;83(8):728–38. doi: 10.1002/cyto.a.22319. [DOI] [PMC free article] [PubMed] [Google Scholar]
- 11.Welters MJ, Gouttefangeas C, Ramwadhdoebe TH, et al. Harmonization of the intracellular cytokine staining assay. Cancer Immunol Immunother. 2012;61:967–78. doi: 10.1007/s00262-012-1282-9. [DOI] [PMC free article] [PubMed] [Google Scholar]
- 12.Britten CM, Janetzki S, Butterfield LH, et al. T cell assays and MIATA: the essential minimum for maximum impact. Immunity. 2012;37:1–2. doi: 10.1016/j.immuni.2012.07.010. [DOI] [PubMed] [Google Scholar]
- 13.Janetzki S, Britten CM, Kalos M, et al. “MIATA”-minimal information about T cell assays. Immunity. 2009;31:527–8. doi: 10.1016/j.immuni.2009.09.007. [DOI] [PMC free article] [PubMed] [Google Scholar]
- 14.Lee JA, Spidlen J, Boyce K, et al. International Society for Advancement of Cytometry Data Standards Task Force MIFlowCyt: the minimum information about a flow cytometry experiment. Cytometry A. 2008;73:926–30. doi: 10.1002/cyto.a.20623. [DOI] [PMC free article] [PubMed] [Google Scholar]
- 15.Maecker HT, McCoy JP, Nussenblatt R. Standardizing immunophenotyping for the human immunology project. Nat Rev Immunol. 2012;12:191–200. doi: 10.1038/nri3158. [DOI] [PMC free article] [PubMed] [Google Scholar]
- 16.Mahnke Y, Chattopadhyay P, Roederer M. Publication of optimized multicolor immunofluorescence panels. Cytometry A. 2010;77:814–8. doi: 10.1002/cyto.a.20916. [DOI] [PubMed] [Google Scholar]
- 17.van der Burg SH, Kalos M, Gouttefangeas C, et al. Harmonization of immune biomarker assays for clinical studies. Sci Transl Med. 2011;3:108s44. doi: 10.1126/scitranslmed.3002785. [DOI] [PubMed] [Google Scholar]
- 18.Britten CM, Gouttefangeas C, Welters MJ, et al. The CIMT-monitoring panel: a two-step approach to harmonize the enumeration of antigen-specific CD8+ T lymphocytes by structural and functional assays. Cancer Immunol Immunother. 2008;57:289–302. doi: 10.1007/s00262-007-0378-0. [DOI] [PMC free article] [PubMed] [Google Scholar]
- 19.Staats JS, Enzor JH, Sanchez AM, et al. Toward development of a comprehensive external quality assurance program for polyfunctional intracellular cytokine staining assays. J Immunol Methods. 2014;409C:44–53. doi: 10.1016/j.jim.2014.05.021. [DOI] [PMC free article] [PubMed] [Google Scholar]
- 20.Attig S, Price L, Janetzki S, et al. CRI-CIC Assay Working Group A critical assessment for the value of markers to gate-out undesired events in HLA-peptide multimer staining protocols. J Transl Med. 2011;9:108. doi: 10.1186/1479-5876-9-108. [DOI] [PMC free article] [PubMed] [Google Scholar]
- 21.Frelinger J, Ottinger J, Gouttefangeas C, Chan C. Modeling flow cytometry data for cancer vaccine immune monitoring. Cancer Immunol Immunother. 2010;59:1435–41. doi: 10.1007/s00262-010-0883-4. [DOI] [PMC free article] [PubMed] [Google Scholar]
- 22.Aghaeepour N, Finak G, Hoos H, et al. FlowCAP Consortium. DREAM Consortium Critical assessment of automated flow cytometry data analysis techniques. Nat Methods. 2013;10:228–38. doi: 10.1038/nmeth.2365. [DOI] [PMC free article] [PubMed] [Google Scholar]
- 23.O’Neill K, Aghaeepour N, Spidlen J, Brinkman R. Flow cytometry bioinformatics. PLoS Comput Biol. 2013;9:e1003365. doi: 10.1371/journal.pcbi.1003365. [DOI] [PMC free article] [PubMed] [Google Scholar]
- 24.Spidlen J, Shooshtari P, Kollmann TR, Brinkman RR. Flow cytometry data standards. BMC Res Notes. 2011;4:50. doi: 10.1186/1756-0500-4-50. [DOI] [PMC free article] [PubMed] [Google Scholar]
- 25.Britten CM, Janetzki S, van der Burg SH, Gouttefangeas C, Hoos A. Toward the harmonization of immune monitoring in clinical trials: quo vadis? Cancer Immunol Immunother. 2008;57:285–8. doi: 10.1007/s00262-007-0379-z. [DOI] [PMC free article] [PubMed] [Google Scholar]
- 26.Lewis SM. Standardization and harmonization of the blood count: the role of international committee for standardization in haematology (ICSH) Eur J Haematol Suppl. 1990;53:9–13. doi: 10.1111/j.1600-0609.1990.tb01520.x. [DOI] [PubMed] [Google Scholar]
- 27.Richards AJ, Staats J, Enzor J, et al. Setting objective thresholds for rare event detection in flow cytometry. J Immunol Methods. 2014;409:54–61. doi: 10.1016/j.jim.2014.04.002. [DOI] [PMC free article] [PubMed] [Google Scholar]
- 28.Cron A, Gouttefangeas C, Frelinger J, et al. Hierarchical modeling for rare event detection and cell subset alignment across flow cytometry samples. PLoS Comput Biol. 2013;9:e1003130. doi: 10.1371/journal.pcbi.1003130. [DOI] [PMC free article] [PubMed] [Google Scholar]
- 29.Lin L, Chan C, Hadrup SR, Froesig TM, Wang Q, West M. Hierarchical bayesian mixture modelling for antigen-specific T-cell subtyping in combinatorially encoded flow cytometry studies. Stat Appl Genet Mol Biol. 2013;12(3):309–31. doi: 10.1515/sagmb-2012-0001. [DOI] [PMC free article] [PubMed] [Google Scholar]
- 30.Chan C, Lin L, Frelinger J, et al. Optimization of a highly standardized carboxyfluorescein succinimidyl ester flow cytometry panel and gating strategy design using discriminative information measure evaluation. Cytometry A. 2010;77:1126–36. doi: 10.1002/cyto.a.20987. [DOI] [PMC free article] [PubMed] [Google Scholar]
- 31.Suchard MA, Wang Q, Chan C, Frelinger J, Cron A, West M. Understanding GPU programming for statistical computation: studies in massively parallel massive mixtures. J Comput Graph Stat. 2010;19:419–38. doi: 10.1198/jcgs.2010.10016. [DOI] [PMC free article] [PubMed] [Google Scholar]
- 32.Roederer M. Spectral compensation for flow cytometry: visualization artifacts, limitations, and caveats. Cytometry. 2001;45:194–205. doi: 10.1002/1097-0320(20011101)45:3<194::aid-cyto1163>3.0.co;2-c. [DOI] [PubMed] [Google Scholar]


