Abstract
Wave models that have been used to extract the biomechanical properties of the cornea from the propagation of an elastic wave are based on an assumption of thin-plate geometry. However, this assumption does not account for the effects of corneal curvature and thickness. This study conducts finite element (FE) simulations on four types of cornea-like structures as well as optical coherence elastography (OCE) experiments on contact lenses and tissue-mimicking phantoms to investigate the effects of curvature and thickness on the group velocity of an elastic wave. The elastic wave velocity as determined by FE simulations and OCE of a spherical shell section decreased from ∼2.8 m/s to ∼2.2 m/s as the radius of curvature increased from 19.1 mm to 47.7 mm and increased from ∼3.0 m/s to ∼4.1 m/s as the thickness of the agar phantom increased from 1.9 mm to 5.6 mm. Both the FE simulation and OCE results confirm that the group velocity of the elastic wave decreases with radius of curvature but increases with thickness. These results demonstrate that the effects of the curvature and thickness must be considered in the further development of accurate wave models for reconstructing biomechanical properties of the cornea.
Assessing the biomechanical properties of the cornea is of great importance for detecting and monitoring the progression of ocular diseases, such as keratoconus, as well as evaluating the effectiveness of therapies, such as UV-induced collagen cross-linking.1 In recent years, a number of noninvasive techniques have been proposed to characterize corneal biomechanical properties. For instance, the CorVis can image corneal dynamic responses from a strong air-puff stimulation,2 and Brillouin microscopy is able to show the depth-resolved Brillouin frequency shift distribution of the cornea.3 Although these methods can provide important measurements that reflect the biomechanical characteristics of the cornea, directly quantifying the viscoelasticity of the cornea by these techniques is still a challenge.
Optical coherence elastography (OCE) is a rapidly emerging method that can noninvasively measure the local biomechanical properties of tissues.4 OCE is similar to other elastographic techniques such as ultrasound elastography (USE),5 magnetic resonance elastography (MRE),6 and supersonic shear wave imaging (SSI)7–9 where an externally induced deformation is measured by the respective imaging modality. OCE has micrometer scale spatial resolution10 and millisecond temporal resolution but has a limited penetration depth of a few millimeters in scattering media such as tissue. However, penetration depth is not an issue for corneal imaging, and thus, OCE is specifically suitable for obtaining the biomechanical properties of the cornea. In our previous work, an OCE system comprised of an external noncontact loading device and an optical coherence tomography (OCT) system was utilized for tumor detection,11 lens,12 cornea,13 cartilage,14 and cardiac muscle15 elasticity estimations. Although we have utilized a focused air-pulse, an elastic wave has also been induced by other approaches such as by laser excitation,16 acoustic radiation force loading,17–19 magnetic nanoparticle modulation,20 and Lorentz force excitation.21
Accurately extracting the biomechanical properties of the cornea from various parameters of an elastic wave requires the utilization of appropriate mechanical models. Some examples of simple analytical models that have been previously employed are the shear wave equation,22 the surface wave equation,23 and the Rayleigh-Lamb wave model.24 Recently, we have proposed a modified Rayleigh-Lamb frequency equation to investigate the viscoelasticity of the cornea by incorporating the effects of the solid-fluid interface at the corneal posterior surface.25 However, most of these wave-related models are based on the assumption that the sample is a thin plate, which does not account for the curved shape of the cornea. Furthermore, variations in the corneal thickness are another important parameter that can affect the elastic wave propagation, but the effects of the curvature and thickness on the propagation of an elastic wave in the cornea are not well understood.
In this study, we have conducted finite element (FE) simulations as well as OCE experiments in which the curvature and thickness have been individually altered on materials with otherwise identical properties. The results will provide valuable insight for improving wave models for corneal viscoelasticity quantification.
To understand the changes in the group velocity of the elastic wave due to the variations in the curvature and thickness of a cornea-like structure, below we introduce two groups of FE simulations as well as three groups of OCE experiments.
The custom-built air-pulse OCE system is comprised of a phase-stabilized swept source OCT (PhS-SSOCT)26 system and a focused air-pulse delivery device. The PhS-SSOCT system was comprised of a broadband swept laser source (HSL2000, Santec, Inc., CA) with a central wavelength of ∼1310 nm, bandwidth of ∼130 nm, and A-scan rate of 30 kHz. A fiber-Bragg grating was utilized for A-scan acquisition triggering and phase stabilization. The focused air-pulse delivery system expelled a short duration (≤1 ms) air-pulse, which induced a small-amplitude displacement (order of μm), which propagated as an elastic wave. The elastic wave was imaged by synchronizing 501 successive M-mode images in a ∼6.1 mm line.27 The group velocity of the elastic wave was then obtained by linear fitting the wave propagation distances to the corresponding propagation time delays obtained by cross-correlation analysis for a given imaged in-depth layer15,28 where the curvature of the sample was taken into account. This procedure was repeated for each imaged in-depth layer, and the depth-wise mean was then utilized as the elastic wave group velocity for that given sample. The standard deviation for a given measurement was calculated from the velocities of all the imaged in-depth layers for a sample.
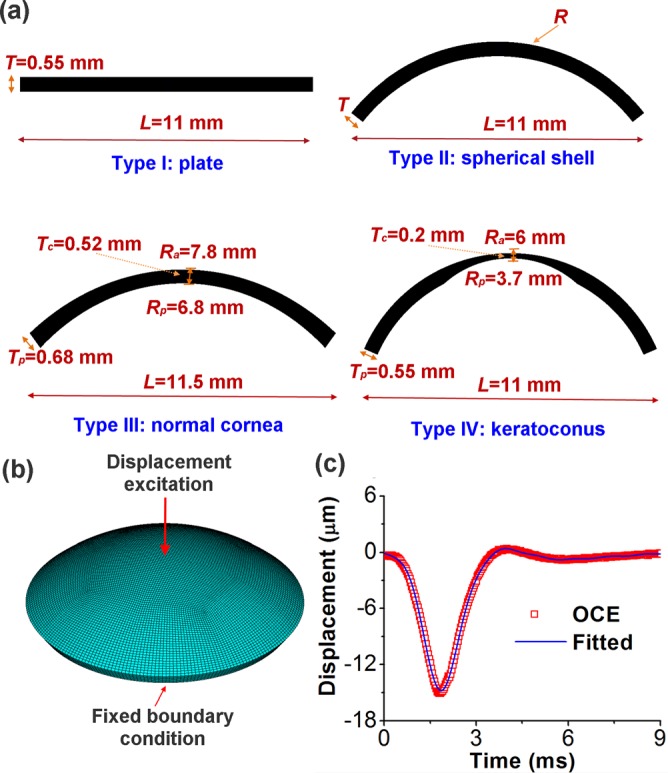
Finite element method was chosen to simulate the changes in group velocity due to its ability to incorporate complex sample geometries with varying thickness and curvature such as those of the cornea. In this study, four types of finite element models of cornea-based structures were constructed, as shown in Figure 1(a). Type I was a thin plate which simulated an infinite radius, with width L = 11 mm and thickness T = 0.55 mm. Type II was a section of a spherical shell with radius R, thickness T, and L = 11 mm. Type III was a standard normal human cornea model which was simplified as an ellipsoid,1 with anterior central radius Ra = 7.8 mm, posterior central radius Rp = 6.8 mm, and L = 11.5 mm. In type III, the central thickness Tc was 0.52 mm while the peripheral thickness Tp was 0.68 mm. Type IV modeled a keratoconic cornea with L = 11 mm, Tc = 0.2 mm, Tp = 0.55 mm, Ra = 6 mm, and Rp = 3.7 mm.
FIG. 1.

(a) Four types of cornea-based structures used in the finite element models with type I representing a plate, type II a spherical shell, type III a normal cornea, and type IV a keratoconic cornea; (b) schematic of a finite element model of cornea-like structure under central displacement excitation; and (c) the OCE-measured and mathematically fitted temporal profile of the displacement excitation.
To understand the influences of curvature and thickness, the values of thickness T and radius R in the type II model were varied individually. Group 1 tested the effects of curvature by fixing the thickness at T = 0.55 mm, while the radius R was changed from 6 mm to 8 mm at an increment of 0.5 mm. These dimensions were chosen as they are in the physiological range for human corneas. Group 2 was utilized for investigating the effects of variations in thickness as R was fixed as 7 mm. The thicknesses were T = 0.2 mm, 0.33 mm, 0.55 mm, 0.7 mm, and 1 mm, to ensure that the dimensions were within the range of the majority of physiological and pathological conditions.
The finite element models were constructed in the ANSYS 14.5 environment (ANSYS Inc., PA, USA), with one sample schematically shown in Figure 1(b). The models were perturbed by a displacement excitation modeled by a typical OCE-measured temporal displacement profile stimulated at the apical position. A free boundary condition was assumed at the bottom surface, and a fixed boundary condition was maintained at the edge adjacent to the bottom side, which was the same as in the OCE experiment. As shown in Figure 1(c), the displacement profile was successfully fitted by28
| (1) |
where A0, An, Bn (n = 1, 2,…,8), and ξ were unknown parameters to be determined and t was the time. For each model, all other parameters were identical: an 8-node solid 185 element was employed for the body mesh; the meshing size was 0.16 mm; the maximum time was tmax = 8 ms; the time step was Δt = 0.1 ms during calculation; the Young's modulus was E = 60 kPa; the Poisson's ratio was v = 0.49; no viscosity was considered for simplification; and the material density was 1062 kg/m3, which was the same as the cornea.29 The group velocity of the elastic wave was fitted using the displacement data from one radial direction on the model surface as each structure was modeled as axisymmetrically homogeneous.
Three groups of OCE experiments were conducted to investigate the how the group velocities of the elastic wave were affected by curvature and thickness. To investigate the effects of curvature, contact lenses (group 3) and tissue-mimicking agar phantoms (group 4, 1.5% w/w) were utilized. The effects of thickness on the elastic wave group velocity were analyzed on 2% (w/w) agar phantoms (group 5).
In group 3, the contact lenses (Alcon Inc., TX, USA; 67% delefilcon A, 33% water) used as corneal analogs were identical other than curvature. During the OCE experiments, the contact lenses were immobilized on a flat surface, and saline was used to fill the posterior gap between the contact lens and the mounting surface. The air-pulse was directed at the apex to induce a radially propagating elastic wave. In group 4, the OCE experiments were conducted on identical 1.5% agar phantoms (Becton, Dickinson and Company, NJ, USA) with dimensions of 12 mm × 80 mm × 2 mm. The phantoms were placed on water-filled balloons of different volumes in order to form various curvatures. In the group 5 experiments, 2% agar phantoms of 12 mm × 80 mm and different thicknesses (1 mm, 1.4 mm, 1.9 mm, 2.9 mm, 3.4 mm, 4 mm, and 5.6 mm) were placed on the same balloon to ensure that the radius of the curvature was constant at 23.8 mm. The radii of the contact lenses and phantoms were calculated from the OCT structural images.
For groups 3 and 4, FEM simulations were also conducted on samples of identical geometries as in the OCE experiments, and the group velocities obtained from the FEM simulations and OCE experiments were compared to inversely estimate the Young's modulus.
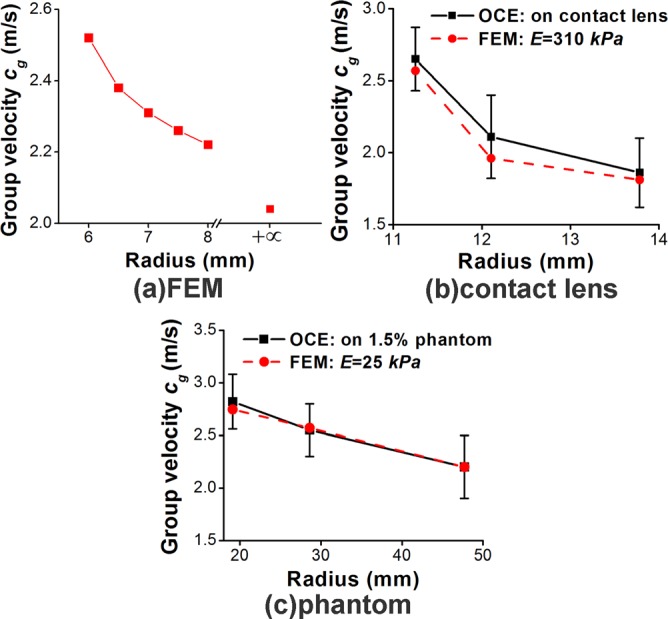
The relationships between the elastic wave group velocity and the radius, while other parameters were fixed, from the different groups are plotted in Figure 2. Figure 2(a) shows that according to the FEM simulation results from group 1, the elastic wave velocity decreased from 2.52 m/s to 2.04 m/s as the radius of curvature increased from 6 mm to infinite (thin plate model). This trend was also confirmed by the results from the OCE experiments on the contact lenses (group 3, Figure 2(b)) and agar phantoms (group 4, Figure 2(c)). In addition, the FE simulation results estimated the Young's modulus for the contact lens and 1.5% agar phantom as E = 310 kPa and E = 25 kPa, respectively.
FIG. 2.

Elastic wave group velocity vs radius obtained by (a) FE simulations of a section of a spherical shell (group 1), (b) FE simulations and OCE experiments on contact lenses (group 3), and (c) FE simulations and OCE experiments on 1.5% agar phantoms (group 4).
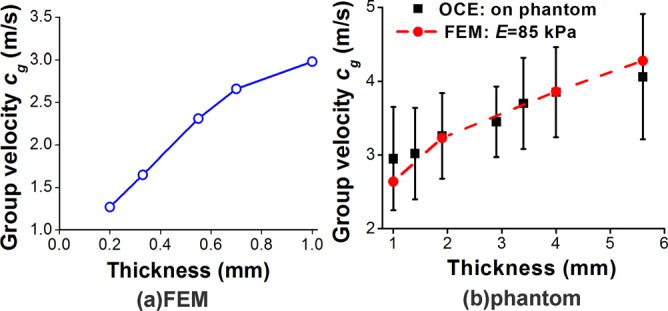
The group velocity versus the thickness is depicted in Figure 3. The FE results of group 2 shown in Figure 3(a) demonstrate that for a human cornea-like structure, the group velocity increased from 1.27 m/s to 2.98 m/s as the thickness increased from 0.2 mm to 1.0 mm when the other parameters were kept constant. The elastic wave velocity from the OCE experiments on agar phantoms of various thicknesses in group 5 also showed the same trend which as confirmed by FE simulations, and is plotted in Figure 3(b). Furthermore, the Young's modulus assessed by FEM was approximately E = 85 kPa for the 2% agar phantom.
FIG. 3.

Elastic wave group velocity vs thickness obtained by (a) FEM (group 2) and (b) OCE experiments on 2% agar phantoms (group 5).
The effects of Poisson's ratio and a free boundary condition of the edge on group velocities of the elastic wavers were also investigated with type II structure (T = 0.55 mm, R = 7 mm, and E = 60 kPa). The group velocities at v = 0.499999 as calculated by a displacement-pressure element and v = 0.49 by the standard element during fixed boundaries were the same as cg = 2.31 m/s. The group velocity slightly increased to cg = 2.33 m/s during free boundary condition at both Poisson ratios. These results demonstrate that the small variations in Poisson ratio and boundary conditions have no or little effect on the elastic wave speed for this particular geometry.
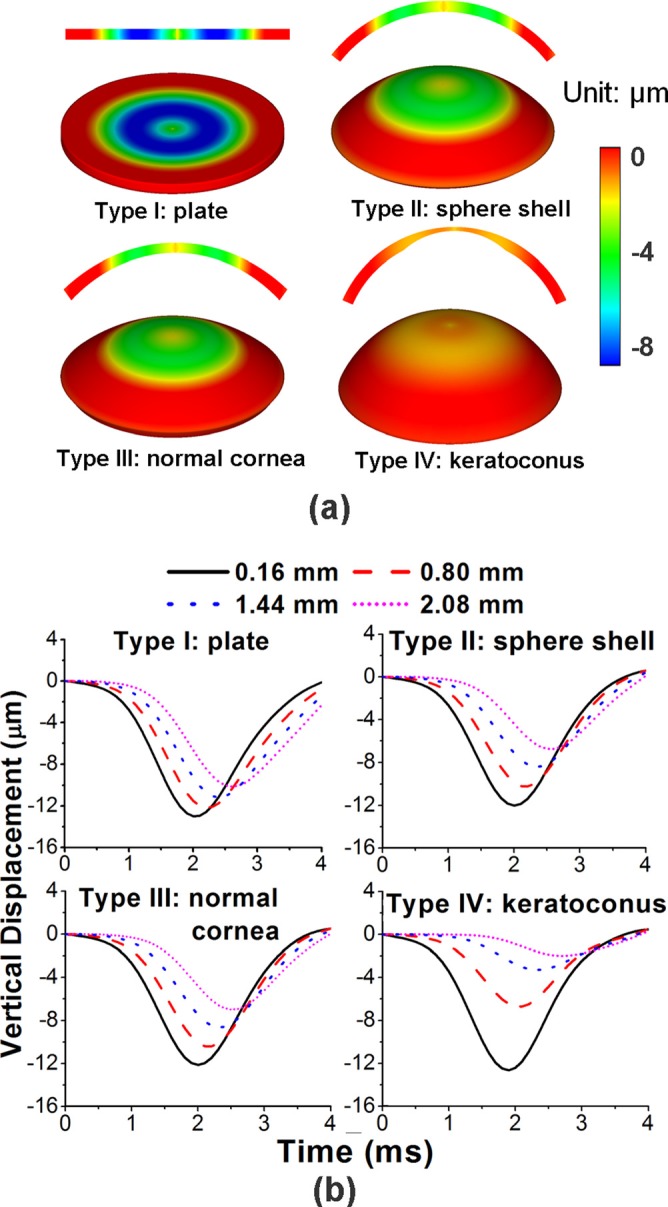
FEM simulated displacement contour maps of the different cornea models at t = 3.2 ms are shown in Figure 4(a). The types II and III cornea-based models had similar displacement distributions since their dimensions were also similar. In addition, the elastic wave group velocities were comparable (cg = 2.31 m/s for type II and cg = 2.35 m/s for type III). The elastic wave velocity for the FE model with an infinite radius (i.e., thin plate) was cg = 2.04 m/s. The type IV model, which had a thinner central region, as in keratoconus, also had an elastic wave velocity of cg = 2.04 m/s. However, the displacement contour maps for types I and IV were obviously different from that of types II and III, due to the changes in curvature and thickness. The FEM simulated vertical displacement temporal profiles extracted at 0.16 mm, 0.80 mm, 1.44 mm, and 2.08 mm away from the central excitation for each of the four types of structures are plotted in Figure 4(b). The data demonstrate the differences in the propagation of the elastic wave caused by the changes in curvature and thickness.
FIG. 4.

(a) FEM simulated displacement contour maps (2D and 3D views) at t = 3.2 ms for different cornea-shape models as type I: thin plate; type II: sphere shell (R = 7 mm, T = 0.55 mm); type III: normal cornea; type IV: keratoconus; (b) FEM simulated vertical displacement temporal profiles obtained at 0.16 mm, 0.80 mm, 1.44 mm, and 2.08 mm away from the central excitation for each of the four types of structures in (a).
This study utilized FE simulations as well as OCE experiments on cornea-like structures such as contact lenses and agar phantoms in order to understand the effects of curvature radius and thickness on the group velocity of an elastic wave. The results demonstrate that the group velocity decreases as the radius of curvature increases, and that the velocity increases as the thickness of the sample increases. These findings demonstrate that the curvature and thickness must be considered when improving wave models used for reconstructing the biomechanical properties of the cornea from OCE measurements.
Acknowledgments
This work was supported, in part, by Grant Nos. 1R01EY022362, 1R01HL120140, and U54HG006348 from the NIH and PRJ71TN from DOD/NAVSEA.
References
- 1. Han Z., Sui X., Zhou D., Zhou C., and Ren Q., J. Refractive Surg. 29(4), 282 (2013). 10.3928/1081597X-20130318-08 [DOI] [PubMed] [Google Scholar]
- 2. Han Z., Tao C., Zhou D., Sun Y., Zhou C., Ren Q., and Roberts C. J., J. Refractive Surg. 30(3), 208 (2014). 10.3928/1081597X-20140212-02 [DOI] [PubMed] [Google Scholar]
- 3. Scarcelli G., Kling S., Quijano E., Pineda R., Marcos S., and Yun S. H., Invest. Ophthalmol. Visual Sci. 54(2), 1418 (2013). 10.1167/iovs.12-11387 [DOI] [PMC free article] [PubMed] [Google Scholar]
- 4. Schmitt J., Opt. Express 3(6), 199 (1998). 10.1364/OE.3.000199 [DOI] [PubMed] [Google Scholar]
- 5. Ophir J., Cespedes I., Ponnekanti H., Yazdi Y., and Li X., Ultrason. Imaging 13(2), 111 (1991). 10.1177/016173469101300201 [DOI] [PubMed] [Google Scholar]
- 6. Muthupillai R., Lomas D., Rossman P., Greenleaf J., Manduca A., and Ehman R., Science 269(5232), 1854 (1995). 10.1126/science.7569924 [DOI] [PubMed] [Google Scholar]
- 7. Nguyen T.-M., Aubry J.-F., Fink M., Bercoff J., and Tanter M., Invest. Ophthalmol. Visual Sci. 55(11), 7545 (2014). 10.1167/iovs.14-15127 [DOI] [PubMed] [Google Scholar]
- 8. Couade M., Pernot M., Prada C., Messas E., Emmerich J., Bruneval P., Criton A., Fink M., and Tanter M., Ultrasound Med. Biol. 36(10), 1662 (2010). 10.1016/j.ultrasmedbio.2010.07.004 [DOI] [PubMed] [Google Scholar]
- 9. Nguyen T.-M., Aubry J.-F., Touboul D., Fink M., Gennisson J.-L., Bercoff J., and Tanter M., Invest. Ophthalmol. Visual Sci. 53(9), 5948 (2012). 10.1167/iovs.11-9142 [DOI] [PubMed] [Google Scholar]
- 10. Kennedy B. F., Kennedy K. M., and Sampson D. D., IEEE J. Sel. Top. Quantum Electron. 20(2), 272–288 (2014). 10.1109/JSTQE.2013.2291445 [DOI] [Google Scholar]
- 11. Wang S., Li J., Manapuram R. K., Menodiado F. M., Ingram D. R., Twa M. D., Lazar A. J., Lev D. C., Pollock R. E., and Larin K. V., Opt. Lett. 37(24), 5184 (2012). 10.1364/OL.37.005184 [DOI] [PMC free article] [PubMed] [Google Scholar]
- 12. Wu C., Han Z., Wang S., Li J., Singh M., Liu C.-H., Aglyamov S., Emelianov S., Manns F., and Larin K. V., Invest. Ophthalmol. Visual Sci. 56(2), 1292 (2015). 10.1167/iovs.14-15654 [DOI] [PMC free article] [PubMed] [Google Scholar]
- 13. Li J., Wang S., Singh M., Aglyamov S., Emelianov S., Twa M., and Larin K., Laser Phys. Lett. 11(6), 065601 (2014). 10.1088/1612-2011/11/6/065601 [DOI] [PMC free article] [PubMed] [Google Scholar]
- 14. Liu C., Skryabina M. N., Li J., Singh M., Sobol E. N., and Larin K. V., Quantum Electron. 44(8), 751 (2014). 10.1070/QE2014v044n08ABEH015506 [DOI] [Google Scholar]
- 15. Wang S., Lopez A. L., Morikawa Y., Tao G., Li J., Larina I. V., Martin J. F., and Larin K. V., Biomed. Opt. Express 5(7), 1980 (2014). 10.1364/BOE.5.001980 [DOI] [PMC free article] [PubMed] [Google Scholar]
- 16. Li C., Guan G., Huang Z., Johnstone M., and Wang R. K., Opt. Lett. 37(10), 1625 (2012). 10.1364/OL.37.001625 [DOI] [PubMed] [Google Scholar]
- 17. Krouskop T., Dougherty D., and Vinson F., J. Rehabil. Res. Dev. 24(2), 1–8 (1987). [PubMed] [Google Scholar]
- 18. Nightingale K., McAleavey S., and Trahey G., Ultrasound Med. Biol. 29(12), 1715 (2003). 10.1016/j.ultrasmedbio.2003.08.008 [DOI] [PubMed] [Google Scholar]
- 19. Kazakov V. and Klochkov B., Biophysics 34(4), 742–747 (1989). [PubMed] [Google Scholar]
- 20. Crecea V., Ahmad A., and Boppart S. A., J. Biomed. Opt. 18(12), 121504 (2013). 10.1117/1.JBO.18.12.121504 [DOI] [PMC free article] [PubMed] [Google Scholar]
- 21. Grasland-Mongrain P., Souchon R., Cartellier F., Zorgani A., Chapelon J. Y., Lafon C., and Catheline S., Phys. Rev. Lett. 113(3), 038101 (2014). 10.1103/PhysRevLett.113.038101 [DOI] [PubMed] [Google Scholar]
- 22. Touboul D., Gennisson J. L., Nguyen T. M., Robinet A., Roberts C. J., Tanter M., and Grenier N., Invest. Ophthalmol. Visual Sci. 55(3), 1976 (2014). 10.1167/iovs.13-13445 [DOI] [PubMed] [Google Scholar]
- 23. Li C., Guan G., Cheng X., Huang Z., and Wang R. K., Opt. Lett. 37(4), 722 (2012). 10.1364/OL.37.000722 [DOI] [PubMed] [Google Scholar]
- 24. Nenadic I. Z., Urban M. W., Aristizabal S., Mitchell S. A., Humphrey T. C., and Greenleaf J. F., Phys. Med. Biol. 56(20), 6723 (2011). 10.1088/0031-9155/56/20/014 [DOI] [PMC free article] [PubMed] [Google Scholar]
- 25. Han Z., Aglyamov S. R., Li J., Singh M., Wang S., Vantipalli S., Wu C., Liu C. H., Twa M. D., and Larin K. V., J. Biomed. Opt. 20(2), 20501 (2015). 10.1117/1.JBO.20.2.020501 [DOI] [PMC free article] [PubMed] [Google Scholar]
- 26. Manapuram R. K., Manne V. G. R., and Larin K. V., Laser Phys. 18(9), 1080 (2008). 10.1134/S1054660X08090144 [DOI] [Google Scholar]
- 27. Wang S. and Larin K. V., Opt. Lett. 39(1), 41 (2014). 10.1364/OL.39.000041 [DOI] [PMC free article] [PubMed] [Google Scholar]
- 28. Han Z., Li J., Singh M., Wu C., Liu C.-H., Wang S., Idugboe R., Raghunathan R., Sudheendran N., Aglyamov S. R., Twa M. D., and Larin K. V., Phys. Med. Biol. 60(9), 3531 (2015). 10.1088/0031-9155/60/9/3531 [DOI] [PMC free article] [PubMed] [Google Scholar]
- 29. Kampmeier J., Radt B., Birngruber R., and Brinkmann R., Cornea 19(3), 355 (2000). 10.1097/00003226-200005000-00020 [DOI] [PubMed] [Google Scholar]


