Abstract
Purpose:
To demonstrate that a “5DCT” technique which utilizes fast helical acquisition yields the same respiratory-gated images as a commercial technique for regular, mechanically produced breathing cycles.
Methods:
Respiratory-gated images of an anesthetized, mechanically ventilated pig were generated using a Siemens low-pitch helical protocol and 5DCT for a range of breathing rates and amplitudes and with standard and low dose imaging protocols. 5DCT reconstructions were independently evaluated by measuring the distances between tissue positions predicted by a 5D motion model and those measured using deformable registration, as well by reconstructing the originally acquired scans. Discrepancies between the 5DCT and commercial reconstructions were measured using landmark correspondences.
Results:
The mean distance between model predicted tissue positions and deformably registered tissue positions over the nine datasets was 0.65 ± 0.28 mm. Reconstructions of the original scans were on average accurate to 0.78 ± 0.57 mm. Mean landmark displacement between the commercial and 5DCT images was 1.76 ± 1.25 mm while the maximum lung tissue motion over the breathing cycle had a mean value of 27.2 ± 4.6 mm. An image composed of the average of 30 deformably registered images acquired with a low dose protocol had 6 HU image noise (single standard deviation) in the heart versus 31 HU for the commercial images.
Conclusions:
An end to end evaluation of the 5DCT technique was conducted through landmark based comparison to breathing gated images acquired with a commercial protocol under highly regular ventilation. The techniques were found to agree to within 2 mm for most respiratory phases and most points in the lung.
Keywords: 4DCT, breathing motion modeling
1. INTRODUCTION
Breathing-induced motion can cause errors in the delivery of therapeutic radiation to lung tumors.1 Currently, respiratory motion is managed in radiation therapy treatment planning through the acquisition of four-dimensional computed tomography (4DCT), a series of volumetric images at different breathing phases.2 Commercial 4D-CT image datasets are typically acquired using low-pitch helical3 or ciné4 sequences. The acquired projections or images are retrospectively grouped according to breathing phase or amplitude using simultaneously acquired breathing surrogate measurements. Sorting-based 4DCT techniques produce artifact-free and clinically useful images when the breathing rate and depth remain consistent throughout acquisition; however, breathing irregularities cause sorting artifacts with the potential to introduce errors in breathing amplitude estimations or tumor volume segmentation.5
The 5DCT data acquisition and analysis technique that utilizes fast helical CT scans presented by Low et al.6 and described in detail by Thomas et al.7 has been shown to provide quantitative 4DCT images free of sorting artifacts. In brief, 5DCT samples multiple breathing cycles with several scans and uses a voxel-based 5D respiratory motion model8 to describe lung tissue displacement as a function of tidal volume and airflow, equivalent to breathing depth and rate, which are measured during image acquisition using an abdominal bellows.
In addition to offering artifact-free breathing gated images, 5DCT potentially allows the entirety of the imaging dose to contribute to image quality. The aim of this study is an end to end validation of the 5D technique by demonstrating that it yields the same images as a commercial 4DCT protocol currently employed clinically for highly regular breathing cycles. This paper presents a comparison of images produced by the 5DCT technique and a Siemens 4DCT protocol on a mechanically ventilated anesthetized pig. Controlled ventilation provided ideal conditions for the commercial protocol to produce high quality, motion sorting artifact-free images that served as a reference against which the 5DCT reconstructions could be compared.
2. METHODS
2.A. Animal model
Procedures were conducted with approval from the Institutional Animal Care and Use Committee of University of Iowa. One farm-bred, wild-type pig (42.7 kg; male) was sedated with a preanesthetic mixture of telazol, ketamine, and xylazine and anesthetized with 3%–5% delivery of isoflurane via nose cone inhalation. The pig was mechanically ventilated with 100% oxygen using a volume-controlled ventilator (Model 613; Harvard Apparatus Bioscience Company, Holliston, MA). A tracheostomy was performed, and the animal was intubated with a 7.5-mm diameter cuffed endotracheal tube.
2.B. Image acquisition
A multidetector row CT scanner (Somatom Definition Flash; Siemens Healthcare, Forchheim, Germany) was used to acquire nine 4DCT sequences, with both the 5D technique and a Siemens amplitude-gated clinical protocol, of the anesthetized and mechanically ventilated pig. In order to gauge the relative performance of the two techniques over a range of periodic breathing conditions, sequences were acquired using 12.4, 17.1, and 24.1 bpm, approximately 450 and 650 ml tidal volumes. Experiments were done with typical clinical and low dose image acquisition protocols using 40 and 10 mAs/scan, respectively. CTDIvol values for the 5DCT acquisitions were 81.38 mGy for the standard protocol and 20.71 mGy for the low dose protocol. The commercial CTDIvol values were 256.29 and 64.07 mGy. The same medium smoothing kernel was used to reconstruct all scans.
Acquisition using the 5DCT technique consisted of 30 repeated fast helical scans, performed in succession with alternating directions, and simultaneous monitoring of the breathing cycle using a surrogate. A scan speed, defined as the rate of table movement, of 161.4 mm/s was used. The scan speed was much greater than the maximum rate of respiratory motion, which had a median value of 30.6 mm/s and a range of 83.2 mm/s; therefore, each axial slice was treated as a collection of instantaneous voxel positions at a single point in the breathing cycle, given by the surrogate measurement at the slice acquisition time. Each scan was approximately 2.5 s in duration, with a 2 s system-imposed delay between scans. Images were acquired with a total collimation width of 3.84 cm, a pitch of 1.2, and a scanner rotation period of 0.285 s which resulted in a table movement of 46.08 mm/rotation. The scans used 120 kVp and were reconstructed using the Siemens B30f medium smoothing kernel. Reconstructed images had a slice thickness of 1 mm and an in-plane resolution of 0.53 mm.
A pneumatic bellows device (Lafayette Instrument, Lafayette IN) consisting of an elastic hollow belt placed at the abdomen was used as the breathing surrogate for the 5DCT protocol. The bellows expanded and contracted during inhalation and exhalation, reducing and increasing the relative air pressure in the bellows, respectively. A pressure transducer was used to generate a voltage signal, which has been previously demonstrated to be proportional to tidal volume in humans.9 The derivative of the voltage signal with time (V/s) was used as the surrogate measurement of breathing rate. The bellows signal was synchronized to CT acquisition by simultaneously acquiring the CT-on signal from the scanner and correlating the signal to CT slice.
2.C. 5D motion model
For each 5DCT acquisition sequence, the first scan was arbitrarily selected as the reference scan and was deformably registered to the following 29 scans. Registration was done using the “deeds” algorithm, which employed a multilevel B-spline transform model, a similarity metric based on local selfsimilarity, and a discrete optimization framework.10,11 The deformable registration provided the positions of the tissues at each voxel in the reference image in each of the other 29 images. Deformation vectors to the reference scan geometry calculated by the deeds algorithm along with the corresponding breathing amplitude and rate measurements collected during each scan were used to independently calculate the per-voxel parameters for the 5D breathing motion model. The position of a voxel in the reference image was described by
| (1) |
where X was the displacement of the voxel, X0 its position at zero breathing amplitude, defined as the bellows pressure transducer voltage, selected to be the fifth percentile inhalation breathing amplitude, and zero breathing rate, v was the breathing amplitude, and f was the breathing rate. α and β were vector fields that related tissue motion to v and f, respectively. The 30 measured positions for each voxel along with 30 related breathing amplitude and rate measurements formed an over-determined system for the vector parameters α and β. α and β were solved independently for each voxel. The least squares solutions were found with QR factorization on a graphics processing unit (Tesla K40; Nvidia, Santa Clara, CA) using a cuBLAS routine. The motion model parameters were used to compute the displacement of each lung voxel, R, from the zero amplitude and rate reference phase, v0 = 0 and f0 = 0, to any user selected breathing phase, v1 and f1. The term 5DCT originates from the modeling of tissue displacement as a function of five degrees of freedom: position in the reference phase, breathing amplitude, and breathing rate,
| (2) |
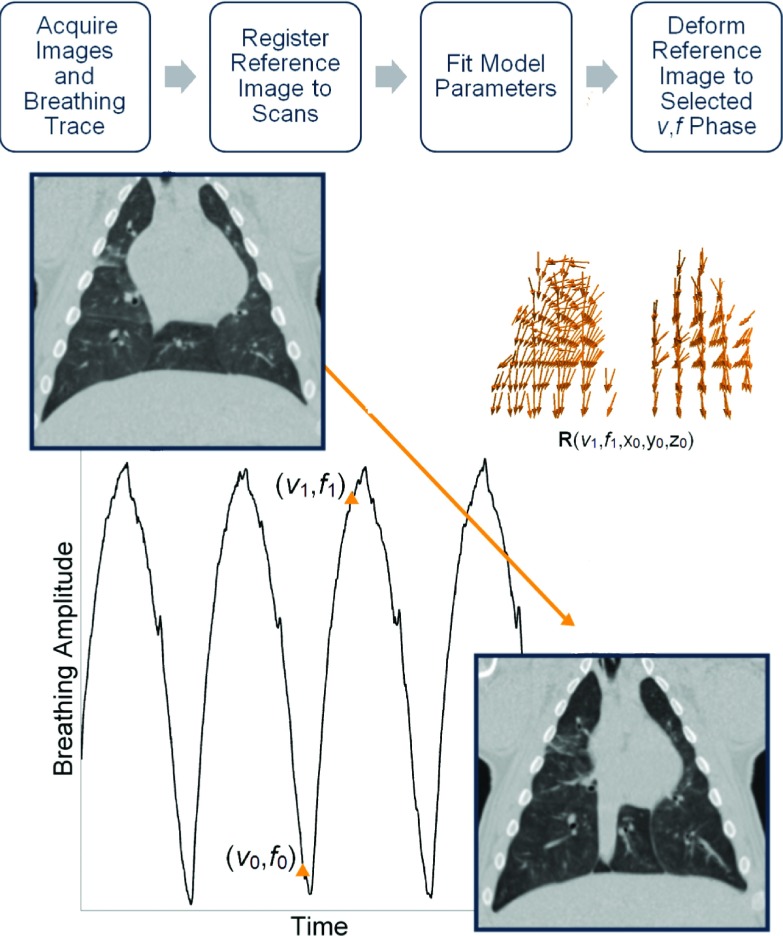
Images were then generated using the displacement field R to deform the reference image to the selected breathing phase. Each displacement vector was the sum of two independent functions of breathing amplitude and rate. Therefore, the trajectory of each voxel over the breathing cycle lay in a plane. Figure 1 shows a flowchart describing the image generation process. A low noise image in the reference geometry was created by averaging the deformably registered scans. For the acquisitions that employed the low dose CT protocol, the averaged image was used in place of the reference image for subsequent deformations and analysis against the Siemens commercial protocol. The 5D motion model residual was evaluated by measuring the distance between the tissue locations in the deformably registered 30 acquired images and the corresponding breathing motion model predicted tissue locations. Model accuracy was assessed by generating images at the breathing phase of each of the 30 originally acquired scans. Similarity between the model generated and original images was quantified by deformably registering the original images to their corresponding reconstructions and measuring deformation vector lengths.
FIG. 1.
Flowchart describing 5DCT image generation. Several scans were acquired with breathing surrogate measurements. One scan was chosen as the reference image and deformably registered to the others. A motion model was used to generate a deformation vector field, R, which gave each voxel’s displacement from the reference breathing phase (v0,f0) to a user selected phase (v1,f1) as a function of breathing amplitude v, rate f, and position x0,y0,z0. R was then used to deform the reference, creating a new image at breathing phase (v1,f1).
2.D. Commercial clinical protocol
Images generated using the 5DCT motion model were compared to reconstructions produced by a Siemens amplitude-gated 4DCT protocol. The Siemens protocol employed a single, low-pitch helical scan with simultaneous monitoring of intratracheal pressure, which was used as a breathing surrogate. Table feed per rotation was 3.40 mm and the total collimation width was 38.4 mm, resulting in a spiral pitch factor of 0.09. The scanner rotation time was 0.5 s and total scanning time was 42 s. CT data were reconstructed into ten respiratory phases according to pressure amplitude at the time of acquisition. Images were reconstructed with an in-plane resolution of 0.53 mm and a slice thickness of 3 mm.
2.E. Image generation
For each dataset, a direct comparison between the 5DCT technique and the Siemens 4DCT protocol was performed by using the 5D motion model to deform the reference image to the same breathing phases as the ten images comprising the clinical Siemens 4DCT. Each pair of in-phase images was then compared.
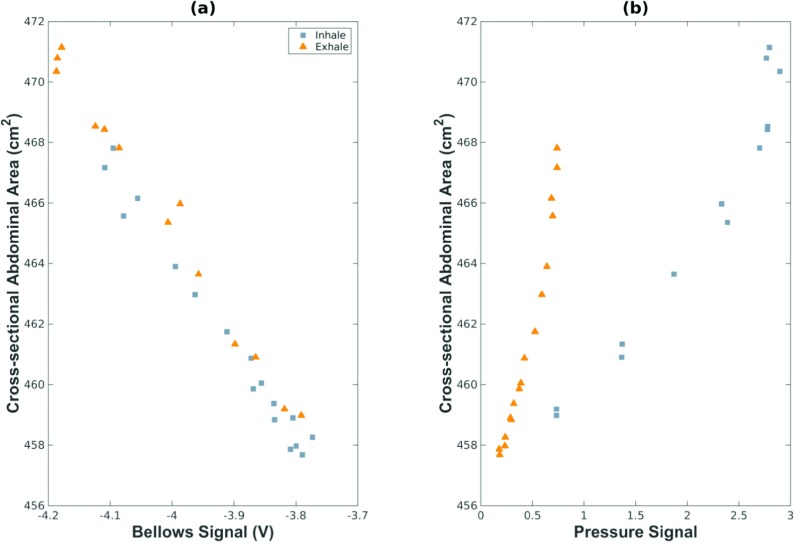
The intratracheal pressure and bellows-measured breathing amplitude were not measured at the same time, so a method was developed to synchronize the two different measurements of the breathing cycle. The complex relationship between intratracheal pressure, used as a breathing surrogate for the Siemens protocol, and the v and f definition of phase used by the 5D model was made evident by the lack of a one to one correspondence between the surrogate measurements. This was likely due to the interplay between intratracheal pressure and airflow into and out of the lungs. In order to relate the two breathing surrogate measurements to lung volume, the cross-sectional abdominal area at the level of the L2 vertebra was used as a common feature that, in humans, had been shown to correlate to breathing amplitude v.9 Figure 2 shows the relationship between the cross-sectional abdominal area and the bellows voltage [Fig. 2(a)] and the intratracheal pressure [Fig. 2(b)]. The bellows voltage exhibited the expected linear relationship to cross-sectional abdominal area, while intratracheal pressure had a cyclic relationship to abdomen cross-section with a dependence on airflow direction.
FIG. 2.
Relationship between abdominal cross-sectional area and (a) bellows signal, and (b) intratracheal pressure signal.
The v and f phases corresponding to the commercial reconstruction points were determined by generating images using the first 5DCT acquisition at relative breathing amplitudes from 0% to 100% in increments of 1%, for both inhalation and exhalation, and comparing to the commercial images. For each Siemens reconstruction in the first dataset, the v and f phases of the image which minimized the sum of squared intensity differences within the lung region were selected and used for all subsequent experiments. This matching process was performed in order to reduce the influence of the different definitions of breathing phase used by the two protocols on the landmark comparison.
2.F. Landmark analysis
The discrepancy between images produced by the commercial and 5DCT techniques was determined by measuring the displacement of landmarks between image pairs. One hundred landmark points in each of the commercial phase images (1000 landmarks per 4D-CT) were automatically identified using an algorithm published by Murphy et al.12 based on intensity gradient magnitude. The landmark points were distributed throughout the lungs and were reliably identified in the corresponding image. A semiautomatic software system, developed by Murphy et al.,12 was used to establish the correspondence of landmarks between commercial and 5DCT images. For each image pair, a subset of landmarks (30 or more) with the steepest intensity gradients was manually matched. The annotation software presented landmarks one at a time by displaying a coronal, sagittal, and axial slice view of the landmark in the commercial image as well as three orthogonal views of the 5D image. Landmark correspondence was determined by matching the three orthogonal slices or by clicking the appropriate point in any one slice. Based on the manually selected correspondences, a thin-plate-spline model13 of the deformation between the two images was created which was then used to automatically match the remaining points. The thin-plate-spline warping of the reference image was interpolated to estimate locations of the landmarks in the second image. For each estimated location, a block-matching search was conducted to select a final point which minimized the local sum of squared intensity differences. All landmark correspondences were visually inspected for accuracy. The mean, standard deviation, and 95th percentile distance between landmark positions across images were calculated for each 4D-CT dataset.
3. RESULTS
3.A. 5DCT error evaluation
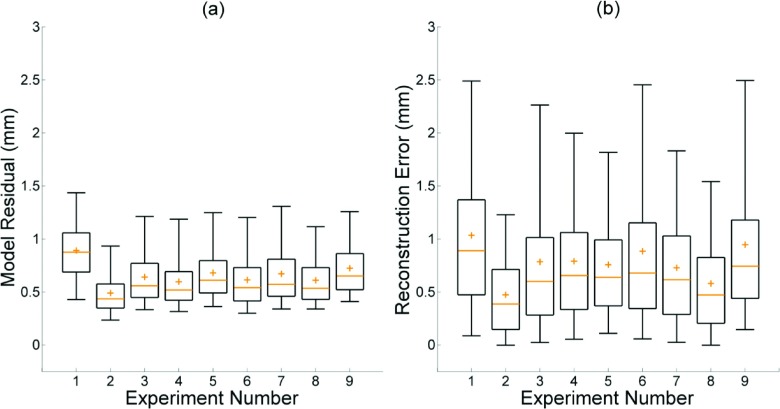
The 5D motion model residual, given by the difference between the model predicted and deformably registered positions of all lung voxels, had a mean value of 0.65 ± 0.28 mm across the nine datasets. The mean value of the 95th percentile differences was 1.22 ± 0.14 mm. The mean 5DCT reconstruction error, a measure of model accuracy defined by the length of deformation vectors from the originally acquired scans to images generated at the same breathing phase using the motion model after registration, was 0.78 ± 0.57 mm. The mean 95th percentile deformation magnitude value for all nine datasets was 1.79 ± 0.67 mm. Descriptions of the imaging protocol and breathing conditions for each experiment are given in Table I. Figure 3 shows box plots of the model residuals which describe the residual (a), and reconstruction error of the originally acquired scans (b). The medians, means, and interquartile ranges of both quantities were predominantly uniform. Neither model residual nor reconstruction error exhibited a significant dependence on respiratory rate, amplitude, or scan mAs.
TABLE I.
Scan mAs, breathing rate, and maximum lung tissue motion for each experiment. Two approximate tidal volumes were used. The maximum respiratory motion was calculated using the motion model by taking the 99th percentile tissue displacement from zero amplitude to the 99th percentile breathing amplitude for each experiment.
| Experiment | mAs | Breathing rate (bpm) | Maximum respiratory motion (mm) |
|---|---|---|---|
| 1 | 40 | 12.4 | 20.3 |
| 2 | 40 | 12.4 | 21.9 |
| 3 | 40 | 17.1 | 24.7 |
| 4 | 40 | 24.1 | 23.1 |
| 5 | 10 | 24.1 | 32.7 |
| 6 | 40 | 24.1 | 32.7 |
| 7 | 40 | 17.1 | 34.2 |
| 8 | 40 | 12.4 | 29.9 |
| 9 | 10 | 12.4 | 28.3 |
| Mean ± SD | 27.2 ± 4.6 |
FIG. 3.
Box plots displaying model residual (a) and error in reconstruction of the original scans (b). For each experiment, interquartile range is shown by the box, median by the line, and mean by the plus sign. Whiskers mark the 5th and 95th percentiles.
Calculation of voxel specific motion model parameters in parallel, using software written in matlab (version R2013a; Mathworks, Natick, MA) and cuda, took approximately 2.7 s/dataset. Image volumes were 270 × 270 × 314 voxels with isotropic 1 mm3 resolution. Each individual deformable registration, performed on the CPU, took approximately 12 min. The entire process required approximately 12 h, the bulk of which was due to image registration.
3.B. Comparison with commercial protocol
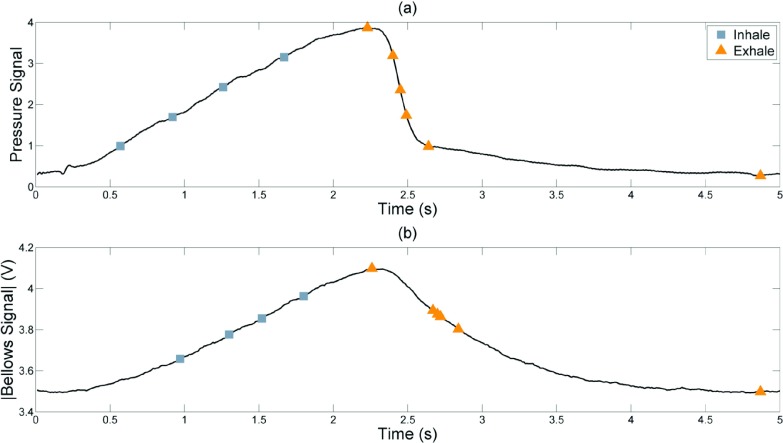
Figure 4(a) shows the time points where the intratracheal pressure based amplitudes were selected for reconstruction with the commercial protocol. The four inhalation phases were approximately evenly spaced on the pressure and bellows waveforms; but there were three exhalation phases within a short period of time due to the rapid falloff of the intratracheal pressure. The corresponding bellows voltages at those points are shown in Fig. 4(b). Because there were three time points in rapid succession and with little change in lung volume, only one of these (the middle point) was used in the analysis to avoid biasing the statistics to that bellows-defined phase.
FIG. 4.
Breathing amplitude points at which the Siemens images were reconstructed (a) and their corresponding bellows voltages (b). Peak intratracheal pressure buildup occurred slightly before peak lung volume and also fell off more rapidly, causing the abdominal bellows signal shown in (b) to lag behind the pressure waveform and have a different shape. Consequently, the first exhalation reconstruction point appears to be during inhalation on the bellows signal and subsequent exhalation points are not evenly spaced.
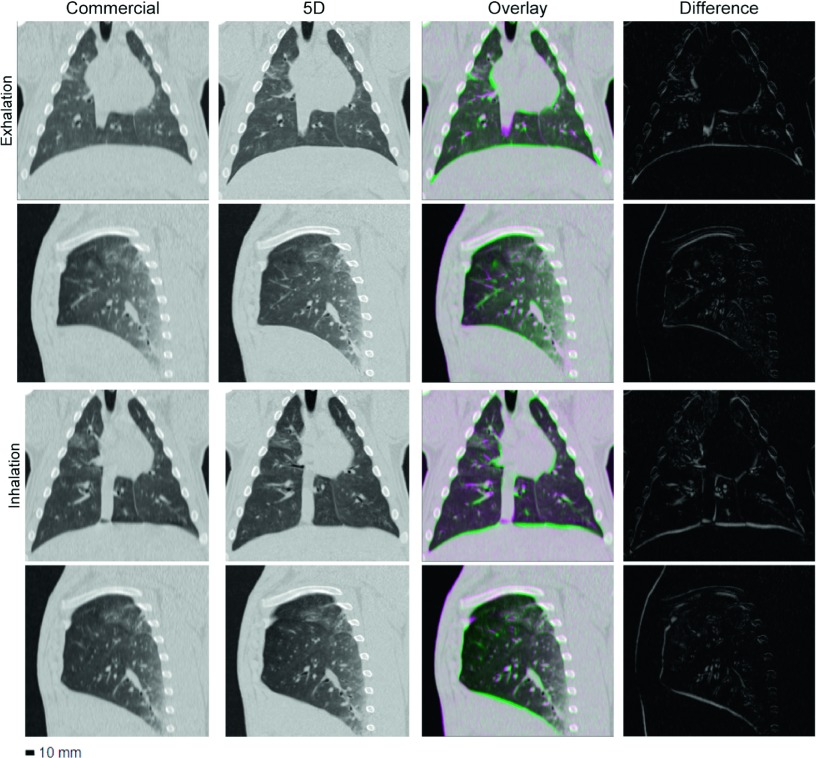
A side-by-side comparison, difference images, and overlays of the commercial protocol and 5DCT images for experiment 3 are shown in Fig. 5. Images at maximum expiration and inspiration were selected for display. Although the same reconstruction kernel was used, the 5DCT images appear sharper because of the increased temporal resolution and reduced motion blurring afforded by fast helical acquisition. During experiment 3 the animal was ventilated at a rate of 17.1 breaths/min, which falls within the typical rate for adult humans.14
FIG. 5.
Images generated using the commercial and 5D protocols for experiment 3. Columns, from left to right: commercial image, corresponding 5D image, the pair overlaid, and a difference image. The two upper rows show full exhalation and the two lower rows show maximum inspiration. With the exception of the difference images, window and level are 1700 and −300 HU, respectively.
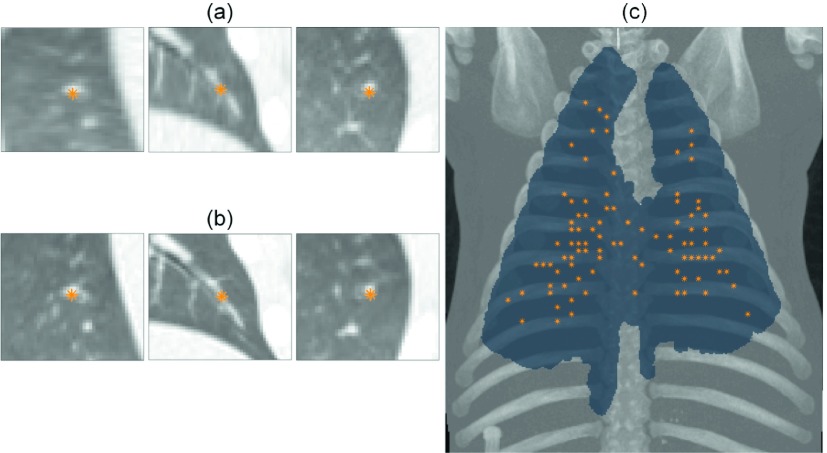
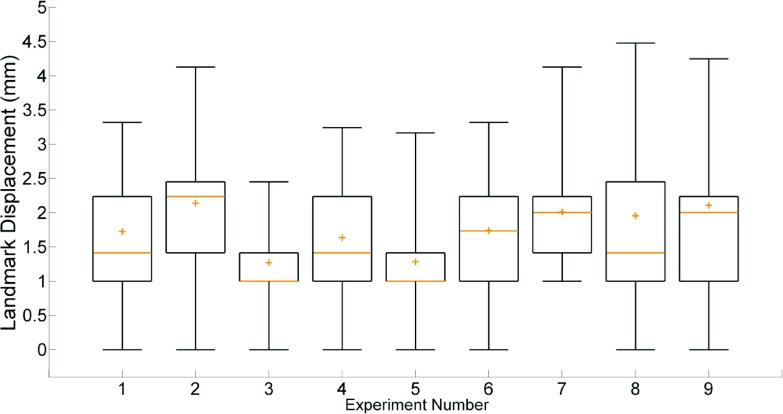
Mean landmark displacement, across the eight analyzed phases of all nine experiments, was 1.76 ± 1.25 mm. Figure 6 shows the distribution of landmark locations throughout the lung for experiment 1 and an example match. The results of the landmark analysis are summarized in Fig. 7. No significant trends were observed between landmark displacement and respiratory rate, amplitude, or scan mAs. Experiments 3 and 5 had the lowest mean and median displacements due to a large number of 1 mm displacements, which indicated a single voxel difference in landmark positions between image pairs. Experiment 7, where respiratory motion was the largest, had the fewest displacements of 1 mm or less, though the mean and median values remained similar to other experiments.
FIG. 6.
Orthogonal views of one of the 100 points selected in the commercial image (a) and the manually identified location of the landmark in the corresponding 5D image (b). Maximum intensity projection of the maximum inspiration image from experiment 1 and its lung segmentation with projected landmark locations marked (c).
FIG. 7.
Box plot showing the displacement of landmark points between the commercial images and corresponding 5D images. Whiskers mark the 5th and 95th percentiles.
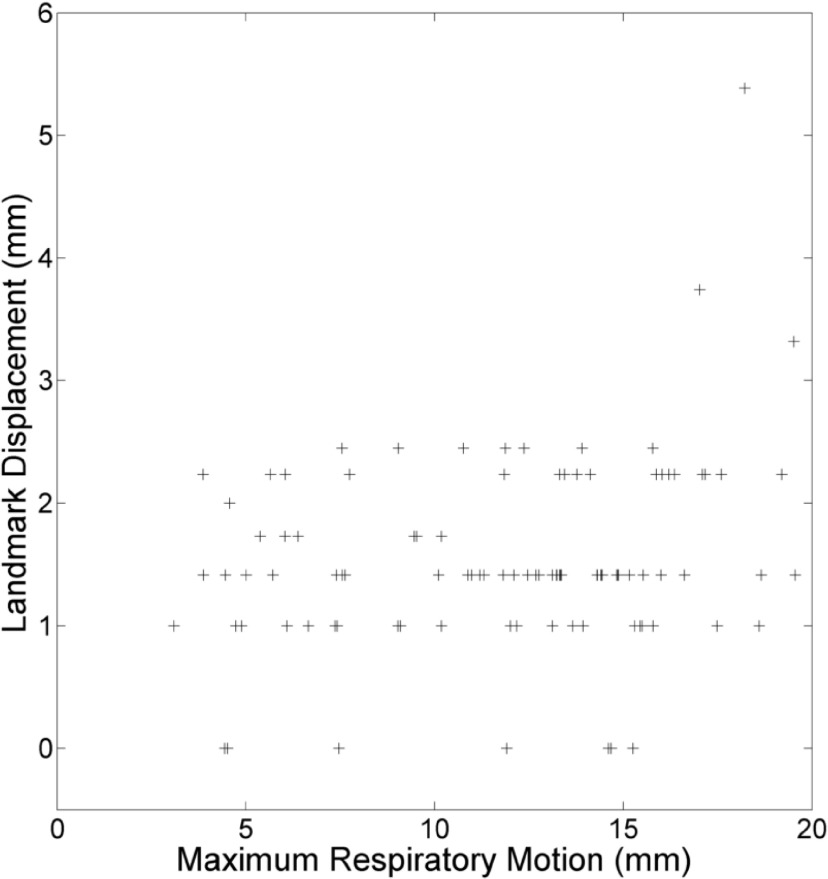
The relationship between landmark displacement and maximum tissue motion during the breathing cycle at the landmark position for experiment 4 is shown in Fig. 8. The maximum expiration was chosen to minimize the influence of discrepancy between the Siemens and v and f definitions of breathing phase. Landmark displacement was predominantly uniform with respect to tissue motion, though the largest displacements occurred in high motion regions.
FIG. 8.
Displacement of landmarks between images versus their voxel’s maximum motion during the breathing cycle for the maximum expiration phase of experiment 4.
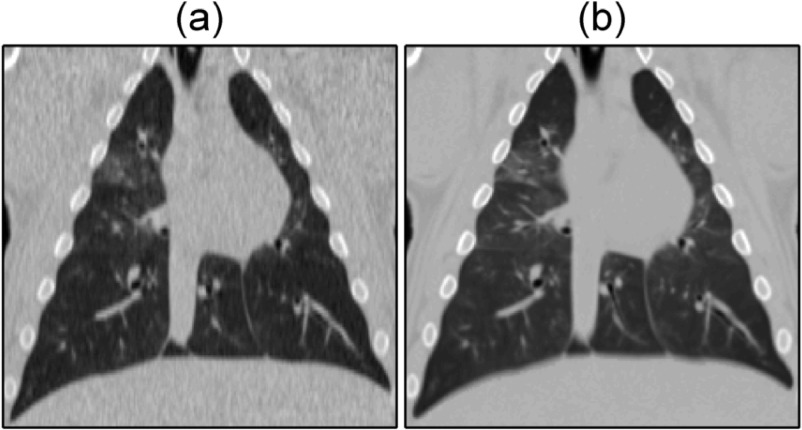
Experiments 5 and 9 were acquired using a low dose (10 mAs) protocol. The low dose protocol was only used in two experiments to limit the effect of noise in the commercial images on the landmark annotation accuracy. For these cases, the 5D motion model was used to deform an averaged image. Figures 9(a) and 9(b) show the commercial maximum inspiration image for experiment 5 and the averaged image deformed to the corresponding phase. Pixel-to-pixel noise in the heart was 31 HU in commercial image and 6 in the 5D reconstruction.
FIG. 9.
Commercial (a) and 5D reconstruction (b), created by deforming an averaged image in the reference geometry, maximum inspiration images for experiment 5. Images are shown with a window and level of 1700 and −300 HU, respectively.
4. DISCUSSION
The results presented here demonstrate that the 5DCT technique was able to generate respiratory-gated images at arbitrary breathing phases accurate to 0.78 ± 0.57 mm on average for the periodic breathing of a ventilated pig during nine experiments with varied respiratory rate, amplitude, and scan mAs. Images produced using the 5D technique agreed with images generated by a commercial, amplitude sorting based protocol to within 1.76 ± 1.25 mm on average. Error in the 5D images and discrepancy between them and the commercial reconstructed images was independent of respiratory rate, amplitude, and acquisition mAs.
While previous work6 has demonstrated advantages of 5DCT, such as its robustness to breathing irregularities and ability to generate images at arbitrary phases, this paper is the first to assess 5DCT results in terms of scan reconstruction accuracy and landmark based comparison to commercial 4DCT. Agreement between images generated by 5DCT and a commercial protocol, under conditions which allowed the commercial amplitude-based sorting technique to yield accurate and artifact-free results, is important for the acceptance of 5DCT as clinically useful.
Two measures of model error were reported, difference in predicted and registered tissue locations (model residual) and deformation vector magnitude between the originally acquired scans and model-based reconstructions. The former provided a metric of the motion model’s precision. The original scans provided a ground truth and a comparison against their recreation using the motion model was the strongest descriptor of reconstruction accuracy. Deformation vector length was used to quantify reconstruction error in place of landmark correspondence due to the large number of image reconstructions involved and the small magnitude of differences (less than 1 mm on average) between image pairs.
An initial clinical study of the 5DCT technique, described by Thomas et al.,7 achieved a mean model error of 1.19 ± 0.37 mm across ten patients. The quantity reported as model error by Thomas et al.7 is referred to as model residual in this study because similarity between the original scans and corresponding 5DCT reconstructions was subsequently adopted as the primary error metric. The mean model residual of 0.65 ± 0.2 was significantly lower (two sample t-test, p < 0.01) in this study, likely due to the use of mechanical ventilation.
The previous clinical study used 25 scans for each 5DCT acquisition to ensure that all tissues were observed at multiple, sufficiently distinct breathing amplitudes in order to accurately determine the voxel specific motion model parameters. In this study, additional scans were added to provide more datapoints for evaluating the technique’s accuracy. For clinical use, the acquisition protocol can employ fewer than 25 scans. Recently, Ruan et al.15 proposed a metric to quantify the spread in respiratory phase at which each tissue is observed. A scheme that appropriately selects scan start times using the proposed objective formulation can result in reconstructions with comparable image quality using as few as three scans. Selecting the most practical number of scans is a topic of ongoing research. While using only results of the three scans in the shortest acquisition and minimum dose, some redundancy is desirable and allows for a more comprehensive evaluation of model error.
Motion model errors were nonuniform throughout the lung region. Voxels with the largest magnitude errors were in the basal regions near the ribs. The breathing motion model was based on the assumption that tissue motion was linear with tidal volume and flow, which did not fully account for the nonlinear motion around the ribs. The trajectory of each voxel was approximated as being planar, which was based on the analysis of lung tumor motion presented by Seppenwoolde et al.16 Whether the inclusion of a third model parameter to allow for nonplanar trajectories would afford increased accuracy is a topic of future research. Additionally, a method to select the scan with the lowest tissue velocities for use as the reference image is currently being investigated as a way to further reduce model error.
Discrepancies between the 5D and Siemens reconstructions were smallest at the maximum and minimum inspiration phases which, as demonstrated in Fig. 4, occurred at stable regions of the pressure waveform. The commercial sorting method reconstructed individual phase images based on projections occurring within a window of pressure amplitudes while the 5D reconstructions were based on single time points at what were determined to be the mean of these windows. Discrepancy between the images, therefore, was influenced by the range of the pressure values which were included in the reconstruction of each phase image.
Disagreement between image pairs in Fig. 5 is most prominent in the region surrounding the heart, due to uncompensated cardiac motion, and at the lower lung, which underwent the largest displacement during the breathing cycle. Landmark displacement based error measurements and maximal tissue motion were largely uncorrelated, as shown in Fig. 8, but the greatest landmark displacements occurred in the basal regions of the lung. The instantaneous positions of these tissues, upon which the analysis was based, were the most sensitive to differences in the specification of respiratory phase. Larger discrepancies occurring at their locations suggest that the inherent difference in the v, f phase and corresponding pressure window definition used by the commercial protocol, which would be most exaggerated in the regions of highest motion, contribute substantially to the discrepancies between image pairs.
10.1% of landmark displacements were greater than 3 mm. The high error in these cases suggests that further accuracy evaluation is needed for some applications, particularly stereotactic body radiation therapy, a precise high dose and highly conformal treatment technique which is widely used to treat inoperable lung cancers. The large landmark displacements occurred in the regions of greatest motion. It is likely that the high tidal volumes used in the study increased the error in these regions. The lowest tidal volume used was approximately 450 ml, which is similar to average human tidal volume. However, the total lung capacity of the animal was about 2 l while the average human lung holds roughly 6 l of air. Large scale tissue motion due to the high tidal volumes likely degraded the quality of the vector field obtained from deformable image registration. Additionally, the 5DCT linear motion model is intended to approximate quiet respiration. Future experiments will focus on more precisely quantifying 5DCT accuracy, potentially using a motion phantom, and simulating breathing that is closer to what is typically seen during radiotherapy treatment.
Implementation of 5DCT requires a 64-slice scanner. Artifacts arise in free-breathing CT images when tissue motion is greater than the couch velocity during acquisition. 5DCT uses deformable image registration of free-breathing images to measure tissue motion. Artifacts in the free-breathing scans prevent accurate registration. Significant breathing motion artifacts were observed when applying the 5DCT technique on a 16-slice scanner, which are presently used by most radiation oncology departments.
All scans in this study were performed on a single healthy animal sample, therefore, factors such as anatomical variability and the influence of diseased lung tissue on respiratory motion were not accounted for. The rate and amplitude of ventilation were varied to simulate different breathing conditions, however, the ventilation remained highly regular in every experiment. Periodic breathing was necessary in this study to ensure that the commercial images were free of artifacts which would compromise the accuracy of the landmark comparison. The aim of the study was to establish that 5DCT closely agrees with the current clinical 4DCT for regular breathing. Future work will demonstrate the ability of 5DCT to better characterize irregular breathing through comparison to dynamic imaging modalities with greater temporal resolution, such as magnetic resonance.
5. CONCLUSION
This study demonstrated agreement between a commercial 4DCT acquisition technique which is used clinically and a fast helical-based 5DCT technique in a porcine model. The porcine model provided reproducible breathing conditions that allowed for direct comparison of images. Images produced by the techniques were found to agree within 2 mm for most points in the lungs and most phases and the agreement was independent of respiratory rate, breathing amplitude, and scan mAs.
ACKNOWLEDGMENTS
The authors would like to thank Dr. Keelin Murphy of the Image Sciences Institute at the University of Utrecht (Utrecht, The Netherlands) for use of the landmark selection and annotation software. The Tesla K40 used for this research was donated by the NVIDIA Corporation. This work was supported by NIH R01 CA0096679.
REFERENCES
- 1.Gierga D. P., Chen G. T. Y., Kung J. H., Betke M., Lombardi J., and Willett C. G., “Quantification of respiration-induced abdominal tumor motion and its impact on IMRT dose distributions,” Int. J. Radiat. Oncol., Biol., Phys. 58(5), 1584–1595 (2004). 10.1016/j.ijrobp.2003.09.077 [DOI] [PubMed] [Google Scholar]
- 2.Keall P. J. et al. , “The management of respiratory motion in radiation oncology report of AAPM Task Group 76a),” Med. Phys. 33(10), 3874–3900 (2006). 10.1118/1.2349696 [DOI] [PubMed] [Google Scholar]
- 3.Ford E. C., Mageras G. S., Yorke E., and Ling C. C., “Respiration-correlated spiral CT: A method of measuring respiratory-induced anatomic motion for radiation treatment planning,” Med. Phys. 30(1), 88–97 (2003). 10.1118/1.1531177 [DOI] [PubMed] [Google Scholar]
- 4.Pan T., “Comparison of helical and cine acquisitions for 4D-CT imaging with multislice CT,” Med. Phys. 32(2), 627–634 (2005). 10.1118/1.1855013 [DOI] [PubMed] [Google Scholar]
- 5.Chen G. T. Y., Kung J. H., and Beaudette K. P., “Artifacts in computed tomography scanning of moving objects,” Semin. Radiat. Oncol. 14, 19–26 (2004). 10.1053/j.semradonc.2003.10.004 [DOI] [PubMed] [Google Scholar]
- 6.Low D. A., White B. M., Lee P. P., Thomas D. H., Gaudio S., Jani S. S., Wu X., and Lamb J. M., “A novel CT acquisition and analysis technique for breathing motion modeling,” Phys. Med. Biol. 58(11), L31–L36 (2013). 10.1088/0031-9155/58/11/L31 [DOI] [PMC free article] [PubMed] [Google Scholar]
- 7.Thomas D., Lamb J., White B., Jani S., Gaudio S., Lee P., Ruan D., McNitt-Gray M., and Low D., “A novel fast helical 4D-CT acquisition technique to generate low-noise sorting artifact–free images at user-selected breathing phases,” Int. J. Radiat. Oncol., Biol., Phys. 89(1), 191–198 (2014). 10.1016/j.ijrobp.2014.01.016 [DOI] [PMC free article] [PubMed] [Google Scholar]
- 8.Low D. A., Parikh P. J., Lu W., Dempsey J. F., Wahab S. H., Hubenschmidt J. P., Nystrom M. M., Handoko M., and Bradley J. D., “Novel breathing motion model for radiotherapy,” Int. J. Radiat. Oncol., Biol., Phys. 63(3), 921–929 (2005). 10.1016/j.ijrobp.2005.03.070 [DOI] [PubMed] [Google Scholar]
- 9.Werner R., White B., Handels H., Lu W., and Low D. A., “Technical note: Development of a tidal volume surrogate that replaces spirometry for physiological breathing monitoring in 4D CT,” Med. Phys. 37(2), 615–619 (2010). 10.1118/1.3284282 [DOI] [PMC free article] [PubMed] [Google Scholar]
- 10.Heinrich H. P., Jenkinson M., Brady M., and Schnabel J. A., “Mrf-based deformable registration and ventilation estimation of lung CT,” IEEE Trans. Med. Imaging 32(7), 1239–1248 (2013). 10.1109/tmi.2013.2246577 [DOI] [PubMed] [Google Scholar]
- 11.Heinrich M. P., Jenkinson M., Bhushan M., Matin T., Gleeson F. V., Brady S. M., and Schnabel J. A., “Mind: Modality independent neighbourhood descriptor for multi-modal deformable registration,” Med. Image Anal. 16(7), 1423–1435 (2012). 10.1016/j.media.2012.05.008 [DOI] [PubMed] [Google Scholar]
- 12.Murphy K., van Ginneken B., Klein S., Staring M., de Hoop B. J., Viergever M. A., and Pluim J. P. W., “Semi-automatic construction of reference standards for evaluation of image registration,” Med. Image Anal. 15(1), 71–84 (2011). 10.1016/j.media.2010.07.005 [DOI] [PubMed] [Google Scholar]
- 13.Bookstein F. L., “Principal warps: Thin-plate splines and the decomposition of deformations,” IEEE Trans. Pattern Anal. Mach. Intell. 11(6), 567–585 (1989). 10.1109/34.24792 [DOI] [Google Scholar]
- 14.Cook C. D., Sutherland J. M., Segal S., Cherry R. B., Mead J., McIlroy M. B., and Smith C. A., “Studies of respiratory physiology in the newborn infant. iii. Measurements of mechanics of respiration,” J. Clin. Invest. 36(3), 440–448 (1957). 10.1172/JCI103441 [DOI] [PMC free article] [PubMed] [Google Scholar]
- 15.Ruan D., Thomas D., and Low D. A., “Objective function to obtain multiple representative waveforms for a novel helical CT scan protocol,” Med. Phys. 42(3), 1164–1169 (2015). 10.1118/1.4906128 [DOI] [PMC free article] [PubMed] [Google Scholar]
- 16.Seppenwoolde Y., Shirato H., Kitamura K., Shimizu S., van Herk M., Lebesque J. V., and Miyasaka K., “Precise and real-time measurement of 3d tumor motion in lung due to breathing and heartbeat, measured during radiotherapy,” Int. J. Radiat. Oncol., Biol., Phys. 53(4), 822–834 (2002). 10.1016/s0360-3016(02)02803-1 [DOI] [PubMed] [Google Scholar]


