Abstract
Purpose:
Developed herein is a three-dimensional (3D) flow contrast imaging system leveraging advancements in the extension of laser speckle contrast imaging theories to deep tissues along with our recently developed finite-element diffuse correlation tomography (DCT) reconstruction scheme. This technique, termed speckle contrast diffuse correlation tomography (scDCT), enables incorporation of complex optical property heterogeneities and sample boundaries. When combined with a reflectance-based design, this system facilitates a rapid segue into flow contrast imaging of larger, in vivo applications such as humans.
Methods:
A highly sensitive CCD camera was integrated into a reflectance-based optical system. Four long-coherence laser source positions were coupled to an optical switch for sequencing of tomographic data acquisition providing multiple projections through the sample. This system was investigated through incorporation of liquid and solid tissue-like phantoms exhibiting optical properties and flow characteristics typical of human tissues. Computer simulations were also performed for comparisons. A uniquely encountered smear correction algorithm was employed to correct point-source illumination contributions during image capture with the frame-transfer CCD and reflectance setup.
Results:
Measurements with scDCT on a homogeneous liquid phantom showed that speckle contrast-based deep flow indices were within 12% of those from standard DCT. Inclusion of a solid phantom submerged below the liquid phantom surface allowed for heterogeneity detection and validation. The heterogeneity was identified successfully by reconstructed 3D flow contrast tomography with scDCT. The heterogeneity center and dimensions and averaged relative flow (within 3%) and localization were in agreement with actuality and computer simulations, respectively.
Conclusions:
A custom cost-effective CCD-based reflectance 3D flow imaging system demonstrated rapid acquisition of dense boundary data and, with further studies, a high potential for translatability to real tissues with arbitrary boundaries. A requisite correction was also found for measurements in the fashion of scDCT to recover accurate speckle contrast of deep tissues.
Keywords: diffuse correlation tomography (DCT), speckle contrast, finite element method (FEM), blood flow
1. INTRODUCTION
Near-infrared (NIR) light enables the deep tissue investigation of microvascular hemodynamics.1,2 Blood flow is one such available observable promoting a wealth of physiological insight both individually and in combination with other metrics. Diffuse correlation spectroscopy (DCS) and, to a lesser extent, tomography (DCT) have received interest over the past two decades as noninvasive methods for blood flow recovery.3,4 In typical DCS implementations, the temporal fluctuations in individual speckles are measured by avalanche photodiodes (APDs) coupled to independent optical fibers. These impose a physical and monetary overhead limiting the potential sampling density and temporal resolution. In our previous work, we extended DCS into a noncontact lens-based system succeeded by noncontact DCT (ncDCT) within a finite element method (FEM) framework.1,5 These studies provided desirable operational attributes, especially the elimination of hemodynamic alterations due to contact compression and the ability to incorporate arbitrary tissue boundaries and compositions. Moreover, our FEM reconstruction method is based on readily available open source software for seamless integration of geometries and inversion algorithm techniques.6 The mechanical scanning of an optical fiber array in ncDCT to cover a region of interest (ROI) provides one solution to increasing sampling density and reducing cost, but increases measurement duration and may introduce motion artifacts. Another solution we outline here, recruitment of charge-coupled device (CCD) detection, promotes advantages including increased sampling density, decreased sampling times and equipment overhead, and geometry extraction potential.
CCD detection has frequently been utilized successfully in other flow monitoring techniques such as laser speckle contrast imaging.7 This modality applies a wide-field illuminating source to enable rapid collection of two-dimensional images depicting spatial vessel flow variations on superficial tissues. There have been a few recent advancements toward blood flow monitoring in deep tissue with NIR point-source illumination and CCD detection. Diffuse speckle contrast analysis and speckle contrast optical spectroscopy approach the problem by using the relationship between a speckle contrast parameter and DCS theory.8,9 Speckle contrast optical tomography (SCOT) extends the concept using an analytical Born approximation in the inverse problem on transmission-based measurement of parallel-plane tissue phantoms.10
We move forward from these studies in the direction of tomographic imaging by developing a robust technique combining the benefits of CCD detection and our FEM-based DCT flow reconstruction. In contrast to SCOT which formulates the inverse problem with a direct analytical relationship between the speckle contrast and mean-square-displacement of moving scatterers, we simplify the process by converting the speckle contrast to boundary flow indices and retaining our leverage of FEM-based DOT reconstruction advancements. Specifically, in this study we are able to take advantage of the nonlinear iterative algorithms, finite-element support functions, data filtering, and the many features included in the modified NIRFAST for DCT.5 This is due to the formal similarity between DOT and DCT as outlined in our previous publication.5 This unique method, termed speckle contrast DCT (scDCT), facilitates three-dimensional (3D) flow contrast imaging of complex turbid media. As this technique promotes incorporation of both heterogeneous optical properties and arbitrary tissue boundaries, scDCT can utilize highly representative sample characteristics in the recovery of accurate flow data. We apply this scDCT technique on a reflectance-based measurement which more adequately represents the situation encountered in larger subjects such as humans where transmission is not practical in most cases (due to the limited penetration depth of light), enhancing translatability. A smear correction algorithm is also incorporated in this study to resolve the influences on data uniquely incurred when using frame-transfer CCDs with the point-source illumination and reflectance setup.
2. METHODS AND MATERIALS
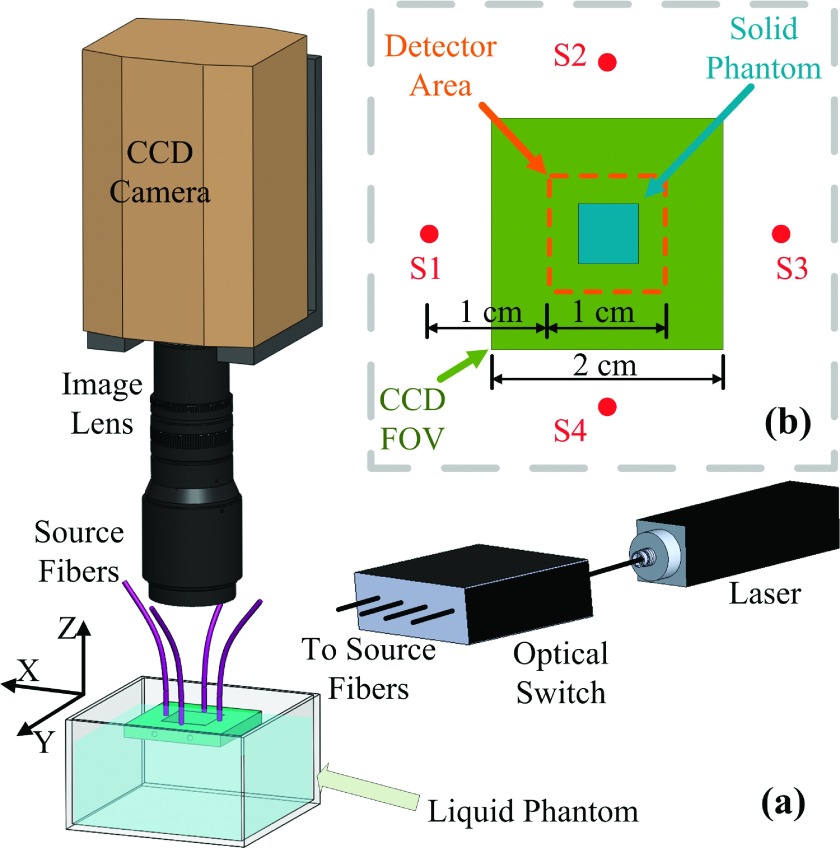
As shown in Fig. 1(a), the scDCT equipment and experimental setup involve a 785 nm long coherence laser (coherence length >5 m, CrystaLaser, NV) to emit photons into the sample. A fiber optic switch (VX500, Dicon, CA) with four-channel outputs delivered photons to four multimode optical fibers (FT200UMT, Thorlabs, NJ) individually. The fibers [S1–S4 in Fig. 1(b)] were located 1.5 cm from the field of view (FOV) edge centers. An electron-multiplying CCD (EMCCD; Cascade 1K, Photometrics, AZ) with a zoom lens (Zoom 7000, Navitar, NY) aligned concentrically to the FOV detected the speckle patterns due to the diffused light. The focal length of the image lens was 35 mm, making the focal plane on the surface of the liquid phantom. An F number of 8 was chosen to ensure the speckle size satisfied the Nyquist sampling criteria.11
FIG. 1.
(a) The EMCCD is focused onto a liquid phantom surface. A square metal holder positioned four fibers supporting their ferrule tips on the liquid surface. The holder provided a 2.4 × 2.4 cm open area. The optical switch distributed laser light into the four source fibers sequentially. (b) Configuration of the four sources, CCD FOV, solid phantom placement, and detector area.
In DCS theory, the unnormalized electric field temporal autocorrelation function, , is observed to propagate diffusely according to the following correlation diffusion equation (CDE) in biological tissues:3
| (1) |
with position vector r, tissue absorption reduced scattering , and photon diffusion coefficients, wavenumber k0, speed of light in vacuum c, light speed in tissue v, wavelength λ, correlation delay time τ, and source term as a point source in this study. The mean-square-displacement of dynamic scatterers (e.g., red blood cells) in autocorrelation delay time τ is denoted by . For the case of diffuse motion this can be modeled by , with denoting the heterogeneous effective diffusion coefficient. A unitless factor α accounts for the moving to static scatterer ratio and combines to produce a blood flow index (BFI) as . In our homogeneous liquid phantom experimentation, all scatterers are dynamic (α = 1) and we thus write DB. The CDE analytic solution for semi-infinite homogeneous media used herein establishes the form of the normalized G1 defined by and has been shown elsewhere.2
For a certain CCD camera exposure time, T, the speckle contrast, K, is defined as the ratio of the standard deviation, σ, to mean, μ, intensities across pixels in a chosen window, i.e., K = σ/μ. Using the Siegert relationship, this spatial speckle contrast parameter can be related to the temporal correlation function g1 by12
| (2) |
where β relates detector and speckle size. We substitute in the form of g1 from the analytical solution to Eq. (1) for semi-infinite geometry and find a nonlinear relationship between speckle contrast and BFI, i.e., where S − D is source-detector separation.8 We then minimize the squared difference between the experimentally measured speckle contrast and theoretical result, , with respect to the BFI. These calculated BFIs are then representative of the boundary measurements for insertion into the modified NIRFAST program as developed previously for flow contrast reconstructions.5,6
Briefly, for tomography we begin by populating the normalized semi-infinite solution to Eq. (1), , with the calculated boundary BFI measurements, known parameters, and a single delay time5 τ = 3.2 × 10⁻⁶ s. The S − D separation is determined for each effective detector as the center of the region covered by its associated pixels. This set of information is combined with the forward solution from NIRFAST [i.e., G1(r, 0)] using a homogeneous mesh to obtain boundary . The absorption coefficient is combined with a dynamic absorption coefficient defined by . Initially, the latter is determined using a measured or assumed background BFI. Reconstructions of the combined term, , are then carried out in NIRFAST using the “Standard” options for a single wavelength and continuous-wave application. A median filter built into NIRFAST is used for phantom test reconstructions as it assists in stabilizing inherent experimental noise. This is because in real measurements the inverse problem is likely to generate odd solutions in a few nodes which may not be encountered with ideal simulation.5,6 The median filter offers six-level smoothing from none to high (0–5) and we select level 2 in this study. The inverse problem is set up using modified-Tikhonov regularization with minimization with respect to optical properties and a biconjugate gradient stabilized iterative inversion scheme for Jacobian construction, as implemented in NIRFAST.6 The BFIs are then extracted from the reconstructed combined absorption coefficient using its definition above.
The speckle contrast obtained from a frame-transfer EMCCD camera may be deviated from the theoretical presence by intensity disorder from the frame transfer process.13 More specifically, visual stripes (smears) are induced extending from bright features in the image into the direction opposite that of the charge-transfer process. Along this direction, the smear can be corrected using an algorithm described by Eq. (3). The actual pixel intensity signal of the xth column and yth row can be restored by the measured value with
| (3) |
where tft is frame transfer time, np is number of pixel rows when the frame has moved to the readout buffer, and η is the efficiency with which photoelectrons are generated during the charge-transfer process relative to the efficiency with which photoelectrons are generated during the image capture period. Our EMCCD frame transfer time is ∼1 ms. We set 7 × 7 windows at the same distance to the source location for a symmetric intensity distribution, leading to η value of 0.67.
Preprocessing of raw EMCCD images is required as follows. Speckle contrast contributions due to hardware noise (i.e., shot noise and dark noise) are accounted for correcting the speckle contrast computation, , of windowed regions.9,14 Details of these corrections can be found elsewhere.9 Briefly, dark images are used to mitigate speckle contrast influences from dark noise, Ic = I − ID, where I is the original intensity of a single pixel and ID is the intensity of dark current. The shot noise of IC follows Poisson statistics, , which are incorporated into the correction calculation. The shot and dark corrected speckle contrast is then given by
| (4) |
For physical experimentation, a liquid phantom provided a homogeneous tissue-like model by a mixture of distilled water, India ink (Black India, MA), and Intralipid (Fresenius Kabi, Sweden).15 The property of real tissue was mimicked by setting μa = 0.05 cm−1, , and DB ≅ 1 × 10⁻⁸ cm2/s (assumed15). A cube-shaped solid phantom (μa = 0.05 cm−1, , and αDB, was measured by DCS to be about three orders of magnitude lower than the liquid background) of carbon black, titanium dioxide, silicone with 7 mm side length was submerged to a 2 mm depth beneath the surface of the FOV center.
3. RESULTS AND DISCUSSION
During both heterogeneity presence and absence experiments, the scDCT measurement protocol consisted of speckle contrast recovery over the liquid surface in a sequential manner for each of the four sources. For each source, 30 frames were acquired with an exposure time of 2 ms and frame rate of 8 frames/s. We defined 9 × 9 detectors centered in the FOV over 1.0 × 1.0 cm [Fig. 1(b)] surrounding the target surface. The resulting S − D separations were all 1.0–2.0 cm with 1.25 mm distance between detectors. Each detector (0.42 × 0.42 mm) included 3 × 3 windows and each window contained 7 × 7 pixels (8 μm pixel size). Measured speckle contrast was calculated per window and averaged across those corresponding to their associated detector. Localized speckle contrast averages were then calculated along obtained frames.
The homogeneous phantom was measured with scDCT first in the manner just described, followed by a standard DCS measurement for calibration purposes. Practically, the optical constant β is not available for measurement. A calibration factor was thus determined which equals to the ratio between speckle contrasts from scDCT and those calculated using Eq. (2) with the semi-infinite CDE analytical solution for g1 along with DCS (β = 0.5) measured BFI on the homogeneous phantom.
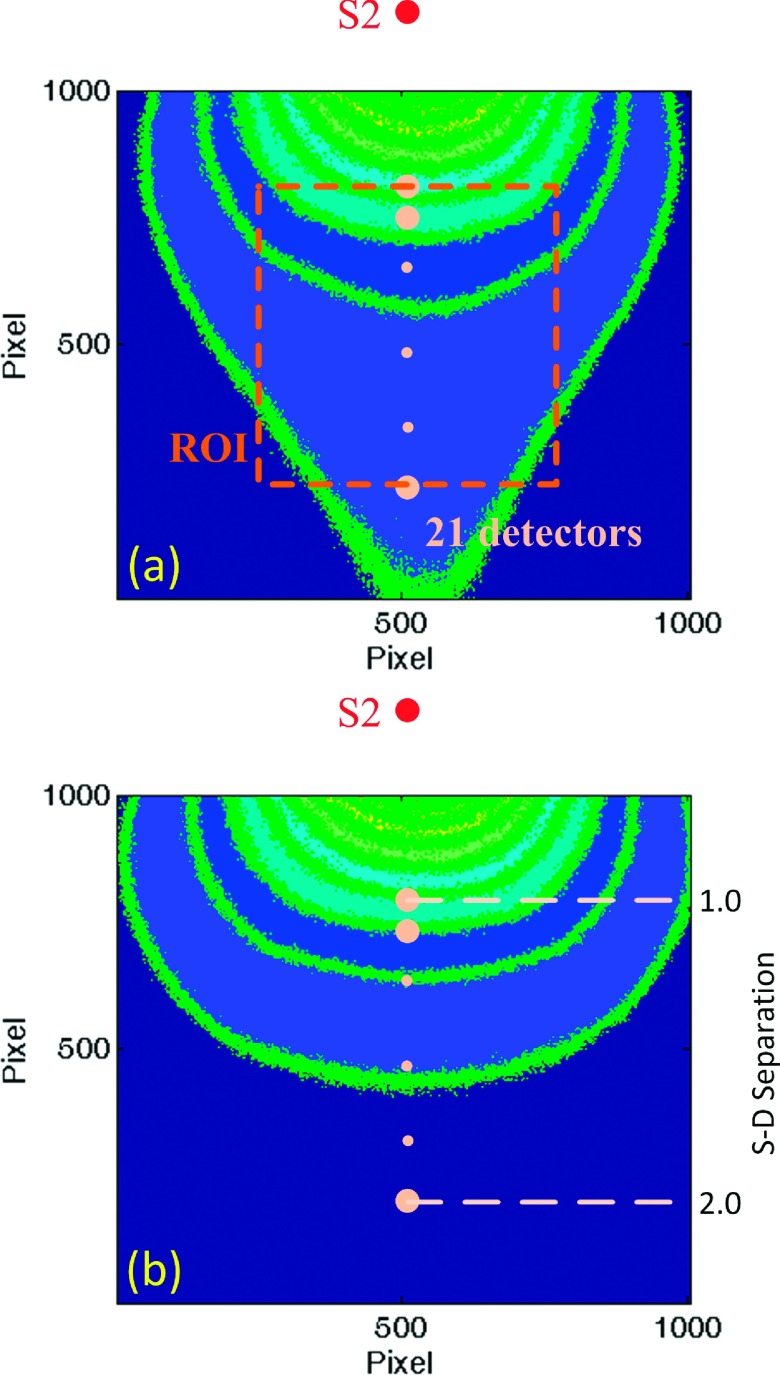
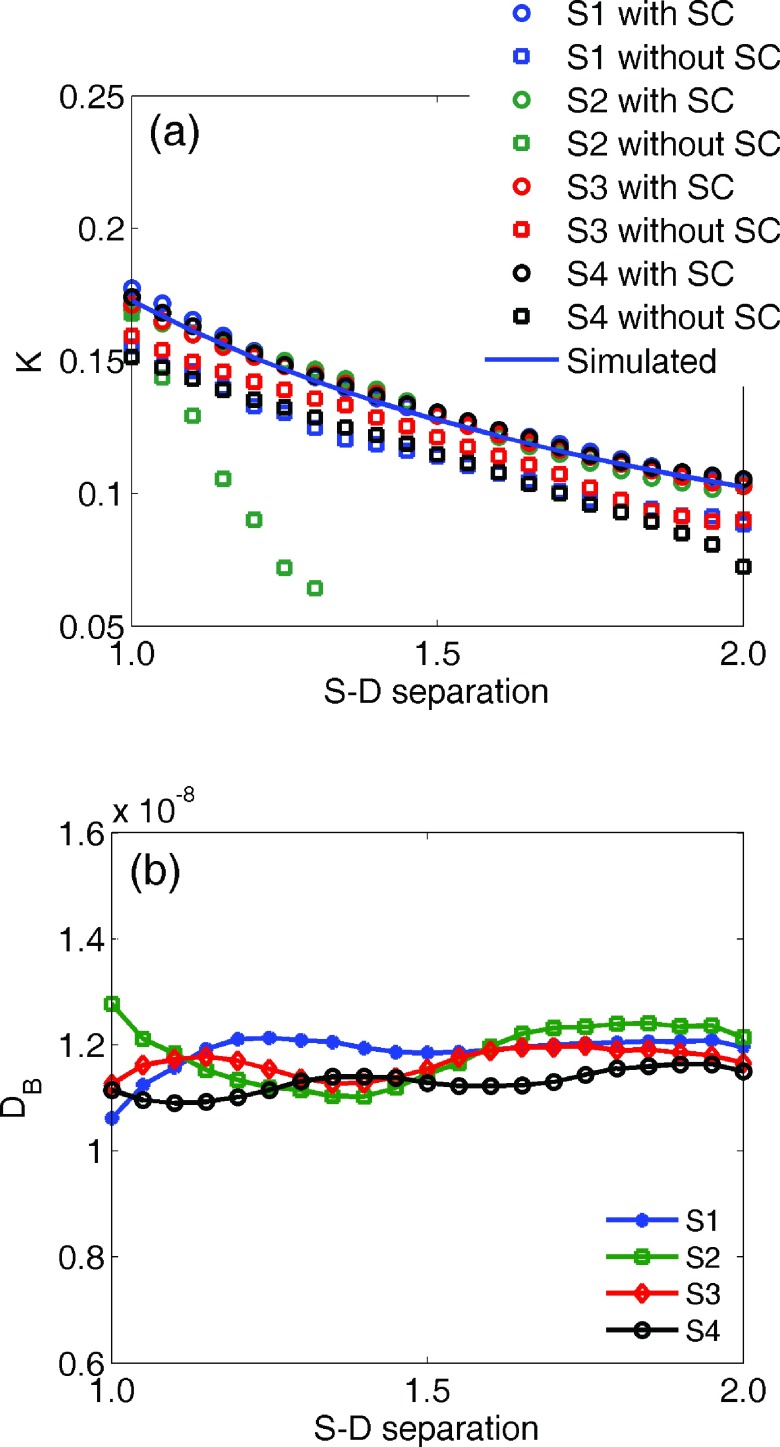
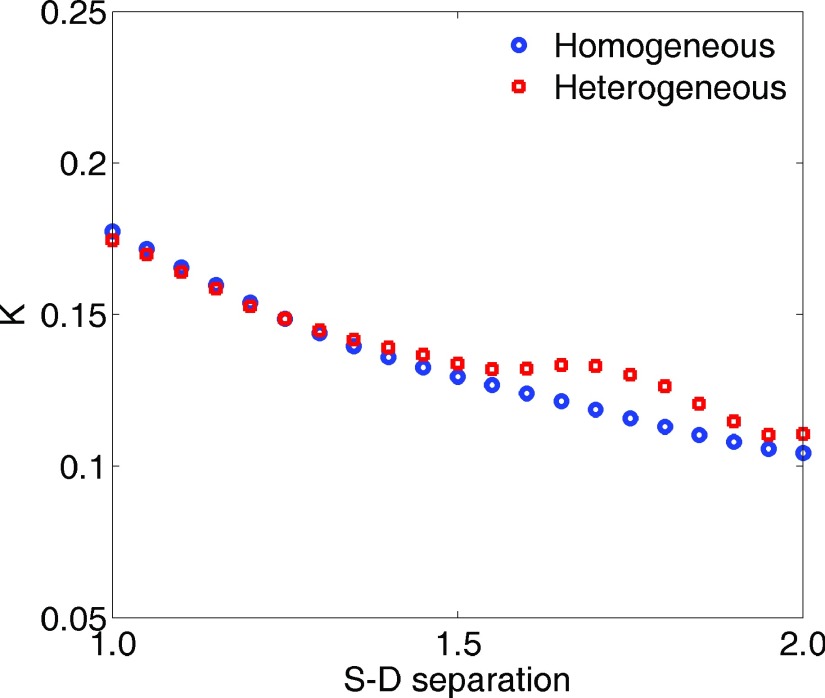
Figure 2(a) illustrates the intensity distribution with source S2 on the homogeneous phantom. Figure 2(b) shows the distribution after desmearing, demonstrating a normal presentation for point-source intensity. To quantify the desmearing influence, we consider an array of detectors defined along the center row in line with the source location as shown relative to S2 in Fig. 2(a). The S − D ranges from 1.0 to 2.0 cm. For each remaining source the detectors are defined similarly, but with different orientation based on the source location. The measured K for such detectors and each source with and without desmearing is shown in Fig. 3(a), along with the calculated K. To refine this depiction, we increased effective detectors along the center row to 21 [see the ROI and dots in Fig. 2(a)] while defining them the same way as done elsewhere in the experimentation. It can be seen that the desmeared K correlates with the calculation. The region of usable speckle contrast without desmearing is obviously limited with S2 most noticeably impacted. This is due to our system configuration in which frame transfer occurs in the direction from S2 to S4. The DB value across the center row of detectors is shown in Fig. 3(b). The DB value achieved from DCS at 2.0 cm S − D separation was 1.28 × 10⁻⁸ cm2/s. The independently averaged DB for S1–S4 at the 21 detectors were , , , and . These are in good agreement (within 12%) with the standard DCS measurement. The comparison of K distributions measured from S1 on the homogeneous and heterogeneous phantoms is shown in Fig. 4.
FIG. 2.
(a) Original intensity pattern for source S2 on the homogeneous phantom. (b) Desmeared intensity distribution of (a) with a corresponding S − D separation axis. These images depict contours of the intensity profiles with dots representing 21 effective detectors for demonstrating the K distribution with the S − D separations. Note that the dots are not to scale and the smaller dots serve as an ellipsis for the intermediate detectors.
FIG. 3.
(a) K for all sources from detectors defined along the center row with and without smear correction (SC) and numerically simulated K at the S − D separations. (b) DB for center row detectors.
FIG. 4.
Measured speckle contrast distributions from S1 on homogeneous and heterogeneous phantoms.
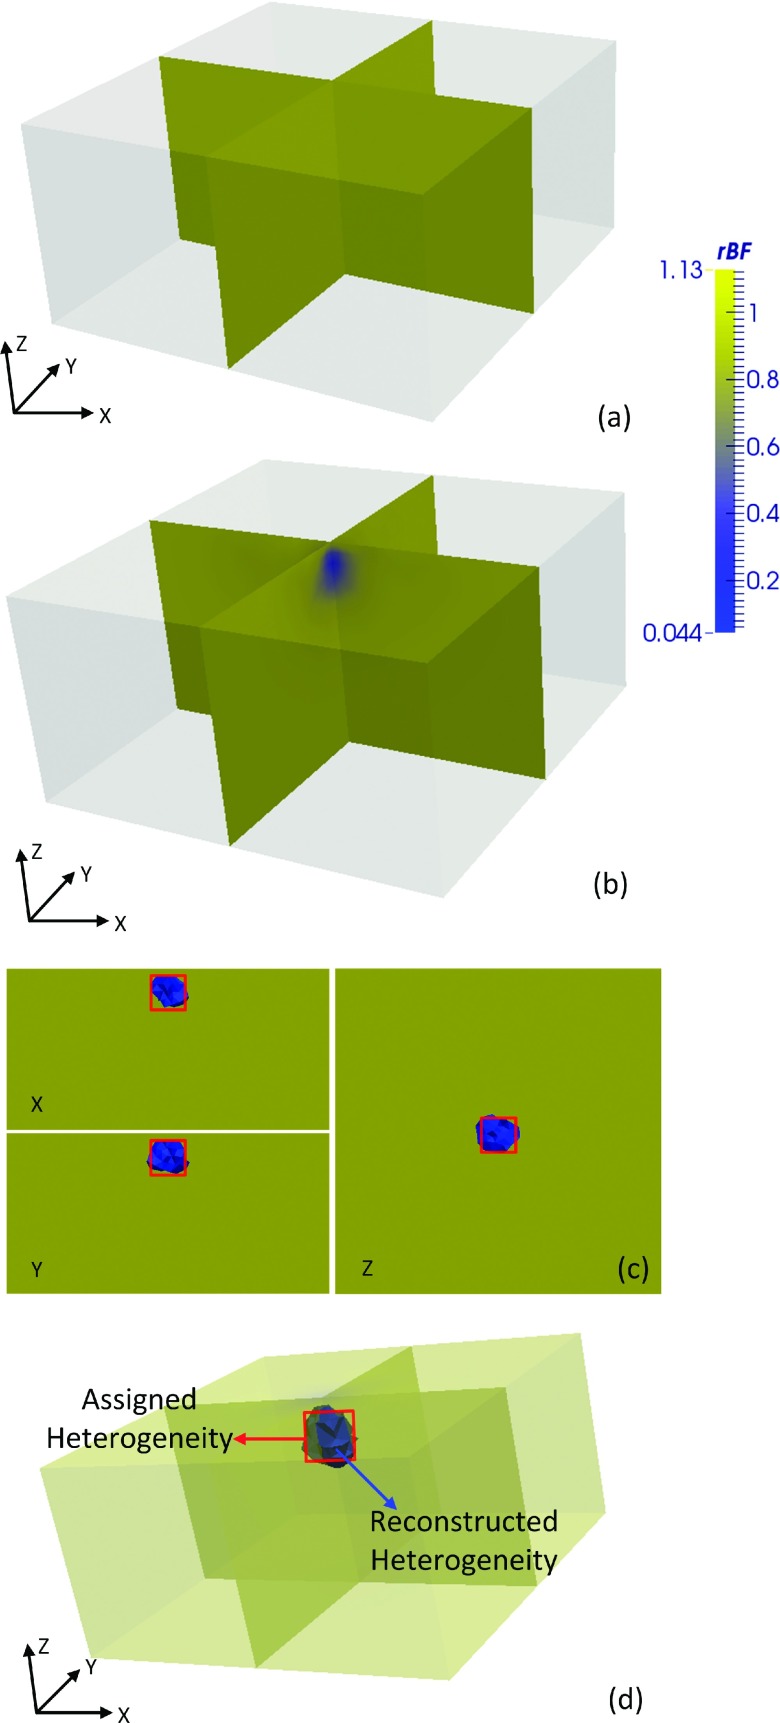
Next, we measured speckle contrast in the phantom with heterogeneity. The corresponding boundary BFIs were combined with the BFI obtained from the homogeneous phantom measurements for image reconstructions. We used a finite element mesh centered at with a 3 mm node distance.5 The mesh was refined in the known region of heterogeneity to improve detection resolution while not overwhelmingly increasing the number of nodes. Refinement was within a 15 mm radius (e.g., inclusive of five elements) centered from to a 1.5 mm node distance (total nodes: 10 307) using ANSY S® (ANSYS, PA). The relative blood flow, rBF, is used to denote the ratio of phantom with heterogeneity to homogeneous phantom αDB’s. As presented in our previous work,5 the algorithm based on an open software package NIRFAST6 was used to reconstruct rBF in 3D. The reconstructed image from homogeneous phantom and heterogeneous phantom is shown in Figs. 5(a) and 5(b). A reconstructed heterogeneity was clearly recognizable from the overlaid cross-sections compared between the two images. Figure 5(c) shows cross-sectional views of the heterogeneity extracted by half max contrast threshold criteria. The averaged heterogeneity rBF was 0.38 with center close to the actual center . Reconstructed heterogeneity side length was 7.2 mm with dimensions that were accurate compared to the true solid phantom.
FIG. 5.
Reconstructed 3D flow contrasts. Three-dimensional overlaid cross-sectional views of the slab phantom (a) without heterogeneity and (b) with heterogeneity. (c) Two-dimensional cross-sectional view (x and y through side centers; z at 24.5) of the region with heterogeneity as extracted by half max contrast threshold criteria. The true region with heterogeneity is depicted by centered squares. (d) The extracted (half max contrast threshold) region with heterogeneity obtained by computer simulation. Images displayed with ParaView (Kitware, NY).
We likewise simulated the phantom experiment by computer using identical parameters. The region with heterogeneity extracted by half max contrast threshold is shown in Fig. 5(d). The reconstructed heterogeneity averaged rBF was 0.37 with center , similar to phantom results (averaged rBF within 3% of phantom test results). Corresponding 3D flow distributions were also similar to the phantom experiment [Fig. 5(b)] and hence are not shown. We also performed two simulations with off-center locations, but otherwise similar setup, of the heterogeneity and found the reconstructed center and side length in agreement with the expectation.
In this study, an exposure time of 2 ms was selected to achieve a good contrast to noise ratio.16 The reconstruction and boundary data parameters of delay time τ and window size used herein have been discussed in detail elsewhere.5,11 We acknowledge that static scatterer contributions can degrade the current model. Ideally, recovered rBF would be zero. However, we only sought to validate 3D flow contrast detection using our new scDCT method rather than optimize flow recovery accuracy, and we produced sufficient contrast to identify and characterize the anomalous presence. The agreement between scDCT and DCS on a homogeneous phantom and between simulation and phantom in heterogeneity detection supports success. Furthermore, multiple two-dimensional S − D pairs provided by the CCD omit the probe scanning in ncDCT,5 and thus significantly improve the spatial and temporal resolution. In addition, due to decreasing signal with increased S − D separation using a point source we were limited to at most 2.2 cm after noise correction. Nevertheless, this S − D separation is still capable of probing tissues ∼1 cm depth.
We also note that although the FEM framework allows incorporating complex heterogeneities and boundaries, we chose to exemplify our technique in a straightforward setup. Further difficulties may be encountered when extending scDCT to real complex media. For example, surface curvature may result in modified light distributions and S − D separations potentially reducing the accuracy and reliability of reconstructed flow contrasts. These issues are beyond the scope of the current paper, but can be addressed in the future through computer simulations, possible free-space corrections,17 and telecentric zoom lens incorporation.18,19
4. CONCLUSIONS
We reported a cost-effective CCD-based reflectance 3D flow imaging system from laser speckle contrast with four target-contacted fibers serving as point sources. Beyond dark and shot noise corrections, we successfully incorporated an additional desmearing algorithm. This correction was found to be imperative for reflectance applications using a point source to obtain accurate deep tissue speckle contrast. Flow contrast was extracted using the relationship between a correlation diffusion equation solution and the speckle contrast. A FEM-based DCT framework was employed to reconstruct spatially distributed blood flow. This system was validated using a reflectance-based measurement on a liquid phantom with an internally placed heterogeneity. Compared to our previous ncDCT design,5 this system demonstrated potential for fast and dense boundary data acquisition and deep tissue hemodynamics tomography translating directly to human studies (e.g., burn/ulcerous tissue flow detection). In future work, quantitative analysis of 3D heterogeneity flow recovery accuracies with arbitrary tissue boundaries will be performed by computer simulations and phantom tests followed by in vivo validation.
ACKNOWLEDGMENTS
We acknowledge support from the National Institutes of Health (NIH) R01-CA149274 (G.Y.), R21-AR062356 (G.Y.), UL-1RR033173 Pilot Grant (G.Y.), and R25-CA153954 Predoctoral Traineeship (D.I.). The content herein is solely the responsibility of the authors and does not necessarily represent the official views of the NIH.
REFERENCES
- 1.Lin Y., He L., Shang Y., and Yu G., “Noncontact diffuse correlation spectroscopy for noninvasive deep tissue blood flow measurement,” J. Biomed. Opt. 17, 010502 (2012). 10.1117/1.JBO.17.1.010502 [DOI] [PMC free article] [PubMed] [Google Scholar]
- 2.Yu G., “Diffuse correlation spectroscopy (DCS): A diagnostic tool for assessing tissue blood flow in vascular-related diseases and therapies,” Curr. Med. Imaging Rev. 8, 194–210 (2012). 10.2174/157340512803759875 [DOI] [Google Scholar]
- 3.Boas D. A. and Yodh A. G., “Spatially varying dynamical properties of turbid media probed with diffusing temporal light correlation,” J. Opt. Soc. Am. A 14, 192–215 (1997). 10.1364/JOSAA.14.000192 [DOI] [Google Scholar]
- 4.Zhou C., Yu G., Furuya D., Greenberg J. H., Yodh A. G., and Durduran T., “Diffuse optical correlation tomography of cerebral blood flow during cortical spreading depression in rat brain,” Opt. Express 14, 1125–1144 (2006). 10.1364/OE.14.001125 [DOI] [PubMed] [Google Scholar]
- 5.Lin Y., Huang C., Irwin D., He L., Shang Y., and Yu G., “Three-dimensional flow contrast imaging of deep tissue using noncontact diffuse correlation tomography,” Appl. Phys. Lett. 104, 121103 (2014). 10.1063/1.4869469 [DOI] [PMC free article] [PubMed] [Google Scholar]
- 6.Dehghani H., Eames M. E., Yalavarthy P. K., Davis S. C., Srinivasan S., Carpenter C. M., Pogue B. W., and Paulsen K. D., “Near infrared optical tomography using NIRFAST: Algorithm for numerical model and image reconstruction,” Commun. Numer. Methods Eng. 25, 711–732 (2008). 10.1002/cnm.1162 [DOI] [PMC free article] [PubMed] [Google Scholar]
- 7.Fercher A. F. and Briers J. D., “Flow visualization by means of single-exposure speckle photography,” Opt. Commun. 37, 326–330 (1981). 10.1016/0030-4018(81)90428-4 [DOI] [Google Scholar]
- 8.Bi R., Dong J., and Lee K., “Deep tissue flowmetry based on diffuse speckle contrast analysis,” Opt. Lett. 38, 1401–1403 (2013). 10.1364/OL.38.001401 [DOI] [PubMed] [Google Scholar]
- 9.Valdes C. P., Varma H. M., Kristoffersen A. K., Dragojevic T., Culver J. P., and Durduran T., “Speckle contrast optical spectroscopy, a non-invasive, diffuse optical method for measuring microvascular blood flow in tissue,” Biomed. Opt. Express 5, 2769–2784 (2014). 10.1364/BOE.5.002769 [DOI] [PMC free article] [PubMed] [Google Scholar]
- 10.Varma H. M., Valdes C. P., Kristoffersen A. K., Culver J. P., and Durduran T., “Speckle contrast optical tomography: A new method for deep tissue three-dimensional tomography of blood flow,” Biomed. Opt. Express 5, 1275–1289 (2014). 10.1364/BOE.5.001275 [DOI] [PMC free article] [PubMed] [Google Scholar]
- 11.Boas D. A. and Dunn A. K., “Laser speckle contrast imaging in biomedical optics,” J. Biomed. Opt. 15, 011109 (2010). 10.1117/1.3285504 [DOI] [PMC free article] [PubMed] [Google Scholar]
- 12.Bandyopadhyay R., Gittings A. S., Suh S. S., Dixon P. K., and Durian D. J., “Speckle-visibility spectroscopy: A tool to study time-varying dynamics,” Rev. Sci. Instrum. 76, 093110 (2005). 10.1063/1.2037987 [DOI] [Google Scholar]
- 13.Ruyten W., “Smear correction for frame transfer charge-coupled-device cameras,” Opt. Lett. 24, 878–880 (1999). 10.1364/OL.24.000878 [DOI] [PubMed] [Google Scholar]
- 14.Yuan S., “Sensitivity, noise and quantitative model of laser speckle contrast imaging,” Ph.D. thesis,Tufts University, MA, 2008. [Google Scholar]
- 15.Irwin D., Dong L., Shang Y., Cheng R., Kudrimoti M., Stevens S. D., and Yu G., “Influences of tissue absorption and scattering on diffuse correlation spectroscopy blood flow measurements,” Biomed. Opt. Express 2, 1969–1985 (2011). 10.1364/BOE.2.001969 [DOI] [PMC free article] [PubMed] [Google Scholar]
- 16.Yuan S., Devor A., Boas D. A., and Dunn A. K., “Determination of optimal exposure time for imaging of blood flow changes with laser speckle contrast imaging,” Appl. Opt. 44, 1823–1830 (2005). 10.1364/AO.44.001823 [DOI] [PubMed] [Google Scholar]
- 17.Ripoll J., Schulz R. B., and Ntziachristos V., “Free-space propagation of diffuse light: Theory and experiments,” Phys. Rev. Lett. 91, 103901 (2003). 10.1103/PhysRevLett.91.103901 [DOI] [PubMed] [Google Scholar]
- 18.Zhang L., Zhao H., Dong W. B., Cao N., and Zhang P. F., “Design of an optical system consisting of a special telecentric lens for side-scattering measurement on individual cells,” Opt. Eng. 49, 053001 (2010). 10.1117/1.3425657 [DOI] [Google Scholar]
- 19.Watanabe M. and Nayar S. K., “Telecentric optics for focus analysis,” IEEE Trans. Pattern Anal. Mach. Intell. 19, 1360–1365 (1997). 10.1109/34.643894 [DOI] [Google Scholar]


