

Abstract
Therapeutic repair of myelin disorders may be limited by the relatively slow rate of human oligodendrocyte differentiation. To identify appropriate pharmacological targets with which to accelerate differentiation of human oligodendrocyte progenitors (hOPCs) directly, we used CD140a/O4-based FACS of human forebrain and microarray to hOPC-specific receptors. Among these, we identified CHRM3, a M3R muscarinic acetylcholine receptor, as being restricted to oligodendrocyte-biased CD140a+O4+ cells. Muscarinic agonist treatment of hOPCs resulted in a specific and dose-dependent blockade of oligodendrocyte commitment. Conversely, when hOPCs were cocultured with human neurons, M3R antagonist treatment stimulated oligodendrocytic differentiation. Systemic treatment with solifenacin, an FDA-approved muscarinic receptor antagonist, increased oligodendrocyte differentiation of transplanted hOPCs in hypomyelinated shiverer/rag2 brain. Importantly, solifenacin treatment of engrafted animals reduced auditory brainstem response interpeak latency, indicative of increased conduction velocity and thereby enhanced functional repair. Therefore, solifenacin and other selective muscarinic antagonists represent new adjunct approaches to accelerate repair by engrafted human progenitors.
Keywords: glia, human, microarray, oligodendrocyte
Introduction
Induction of myelin repair by stem cell transplantation in demyelinating diseases such as childhood leukodystrophies and multiple sclerosis represents a major therapeutic goal (Goldman et al., 2012). Because the extent of species-specific differences in the mechanisms of myelination and remyelination are largely unknown, the question remains whether strategies to augment rodent repair will be effective in human patients. In this study, we sought to characterize the molecular pathways that regulate the differentiation of human oligodendrocyte progenitor cells (hOPCs) directly and thereby identify drug candidates that improve the ability of transplanted human cells to myelinate axons in a hypomyelinating mouse model.
To identify targets for pharmacological manipulation, we first characterized the gene expression profiles of human oligodendroglia at various developmental stages. We used concurrent isolation of distinct human glial stages using CD140a and O4 antigens (Conway et al., 2012). CD140a/PDGFαR-expressing cells were bipotential OPCs in vitro and able to mediate extensive myelination after transplantation into hypomyelinated shiverer mice (Sim et al., 2011). The monoclonal O4 antibody recognizes an immature population of oligodendrocytes that gradually accumulate during the second trimester (Back et al., 2001). Because the appearance of CD140a expression precedes O4 (Sim et al., 2011), we hypothesized that O4 recognizes a later stage of human oligodendrocyte lineage and may be used together with CD140a/PDGFαR to isolate discrete populations of human oligodendroglia. In this study, we combined FACS sorting for CD140a and O4 antigens to identify three distinct stages of human glial lineage. We used whole-genome microarray to identify the transcriptional profile immediately after isolation to compare them with one another. We describe the identification and functional validation of M3R muscarinic acetylcholine receptor in hOPCs. Using solifenacin, an FDA-approved drug, we show that adjunct therapy increased the rate of myelination and auditory conduction velocity in transplanted shiverer mice, thereby improving the outcome of cell-based therapy.
Materials and Methods
Cell and tissue samples
Fetal brain tissue samples (17–22 weeks gestational age) were obtained from patients who consented to tissue use under protocols approved by the University at Buffalo Research Subjects Institutional Review Board. Forebrain tissue was minced and dissociated using papain and DNase as described previously (Conway et al., 2012). Cells were maintained in serum-free medium (SFM; formulation described in Sim et al., 2011) supplemented with 10 ng/ml FGF2 (Peprotech).
Fetal brain tissue preparation and analysis
Fresh fetal brain tissue was immersed in ice-cold 4% paraformaldehyde in 1× PBS for 30 min, washed twice in 1× PBS, and stored at 4°C before processing. Fixed tissue was cryoprotected before sectioning on a cryostat (14 μm; Leica). Forebrain sections contain both ventricular zone and overlying cortical mantle were collected onto charged slides (Azer Scientific). Slides were serially stained with primary antibodies against CD140a (1:100; BD PharMingen), O4 (1:100, gift from Dr. James Goldman, Columbia University), and Ki67 (1:250; Millipore), OLIG2 (1:1000; Millipore), or SOX10 (1:2500, gift from Dr. Michael Wegner, Universität Erlangen-Nürnberg, Germany) (Stolt et al., 2003). Alexa Fluor-488-, Alexa Fluor-594-, and Alexa Fluor-647-conjugated goat secondary antibodies were used at 1:500 (Invitrogen). Colocalization was assessed using both epifluorescence (IX51; Olympus) and confocal fluorescence microscopy (Leica). At least 25 fields in developing white matter were assessed for each antigen (40× objective). Only cells with CD140a or O4 staining surrounding an individual DAPI-labeled nucleus were counted. The proportions of Ki67-, OLIG2-, and SOX10-positive cells were determined among the CD140a- and O4-defined glial populations (n = 4 brain samples).
FACS and magnetic-based cell sorting
FACS was performed for CD140a and O4 antigens using a FACSAria (BD Biosciences). After recovery, cells were stained with CD140a PE-conjugated antibody, O4 IgM hybridoma supernatant, and goat anti-mouse IgM F(ab′) APC-conjugated secondary antibody (Jackson ImmunoResearch). Matched fluorescence minus-one controls were used to set appropriate gates after forward and side scatter-based gating and doublet discrimination to exclude dead cells and doublets, respectively. Sorted cells were plated at 5 × 10⁴/ml into 24-well plates coated with poly-l-ornithine and laminin in SFM in the presence or absence of thyroid hormone T3 (10 ng/ml; Sigma) and 1% platelet-depleted FBS. Cells were cultured for 4 d and then live immunostained for O4. After fixation, cells were colabeled with mouse IgG1 anti-GFAP (1:500, clone G-A-5; Sigma) or anti-myelin basic protein (MBP) antibodies (1:200; Abcam). Alexa Fluor-488-, Alexa Fluor-594-, and Alexa Fluor-647-conjugated goat secondary antibodies were used at 1:500 (Invitrogen). The number and proportion of stained cells was quantified in 20 random fields at 200× magnification (IX51; Olympus), representative of >250 random cells (n = 5 fetal brain preparations/samples).
RNA isolation and microarray
RNA was isolated using an EZNA Total RNA Kit I (Omega Bio-Tek) according to the manufacturer's protocol. Before array analysis, RNA was amplified using NuGEN WT-Ovation Pico RNA amplification system according to the manufacturer's instructions. Amplified product was hybridized onto Illumina HT-12v3 bead arrays according to manufacturer's instructions. All analyses were performed using R/Bioconductor (Gentleman et al., 2004). Full analysis code is available on request (fjsim@buffalo.edu). The complete microarray data are available at the National Center for Biotechnology Information Gene Expression Omnibus under GSE32589 and may be browsed via FINDdb (www.findDB.org).
Quantitative RT-PCR analyses
For quantitative PCR, cDNA was obtained using SuperScript III reverse transcriptase (Invitrogen) or via NuGen amplification (see above). Human-specific primers for SYBR green-based PCR, designed using NCBI Primer-BLAST or Primer Express (v1; Applied Biosystems) and Taqman assays were obtained from IDT and Invitrogen, respectively (Table 1). Samples were run in duplicate and gene expression was calculated by ΔΔCt analysis using 18S as a reference.
Table 1.
qPCR primers and Taqman assays used in this study
| Primer | Sequence (5′ to 3′) |
|---|---|
| 18S | Hs99999901_s1 |
| MBP | Fwd: GGCAGAGCGTCCGACTATAAA |
| Rev: CGACTATCTCTTCCTCCCAGCTT | |
| PDGFRA | Fwd: CCTGGTGCTGTTGGTGATTG |
| Rev: ATACCTCGGTTTCTGTTTCCAAAT | |
| CHRM3 | Fwd: TGATGCTCCTACCTGGAACAG |
| Rev: GCATCGGAGGGGCTGTGTATC |
M3 acetylcholine receptor agonist and antagonist treatment
Magnetic sorting of CD140a was performed as described previously (Conway et al., 2012). CD140a+ OPCs were seeded at a density of 5 × 10⁴/ml into 24-well plates coated with poly-l-ornithine and laminin in SFM containing 20 ng/ml PDGF-AA and 5 ng/ml FGF-2 (Peprotech). After 48 h of recovery after sorting, defined as day 0 for experimental manipulations, medium was replaced with SFM in either the presence or absence of PDGF-AA (20 ng/ml). Cells were treated with oxotremorine-M (0–40 μm; Tocris Bioscience) or darifenacin (50 nm; Toronto Research Chemicals) on days 0 and 2 and processed for live staining on day 4. Cultures were pulsed with BrdU (10 μg/ml) beginning 24 h before fixation. Cells were immunostained for O4, OLIG2, and BrdU as described previously (Conway et al., 2012). Images were captured via a Hamamatsu Orca ER CCD camera using μManager (Edelstein et al., 2010). For cell counting, 200–500 live cells were counted (20× objective). Each data replicate (n) was generated from a separate fetal sample and magnetic sort.
Fetal neuron and hOPC coculture
Cortical neuronal cell reaggregates and hOPC cocultures were generated based on a method described previously (Watkins et al., 2008). Briefly, human fetal dissociates were cultured in neurobasal/B27 medium supplemented with BDNF (10 ng/ml) at high density (5 × 10⁶ cells/ml) on untreated suspension dishes to promote the formation of cell aggregates. After formation of cell aggregates between 5 and 7 d, aggregates were seeded onto poly-d-lysine/laminin-coated coverslips and allowed to grow for 7 d. To prevent glial and progenitor expansion, cultures were pulsed daily with anti-mitotic Ara-C (1 μm; MP Biomedicals). After Ara-C treatment, cocultures were established by seeding CD140a-sorted OPCs (5 × 10⁴ cells/ml), which had been isolated 4 days before, and infected with mCherry-expressing lentivirus (2 MOI, pTRIP; gift from Abdel Benraiss). Cocultures were maintained in human neural differentiation (hND) medium composed of a 1:1 mixture of DMEM/F12 and neurobasal medium (Invitrogen) with added sodium pyruvate (1 mm final concentration), l-glutamine (2 mm), penicillin/streptomycin (100 U/ml), N-2 supplement (1×), selenite (50 ng/ml), progesterone (60 ng/ml), T3 (40 ng/ml), trace elements B (1×; Cellgro), biotin (10 ng/ml), B27 (1×; Invitrogen), and N-acetyl cysteine (5 μg/ml). Medium was further supplemented with PDGF-AA (10 ng/ml) and NT-3 (5 ng/ml). Cocultures were treated with 50 nm darifenacin daily and then immunostained on day 14 for O4 and anti-IgM Alexa Fluor-488 secondary antibody. The percentage of mCherry+ OPCs that underwent O4+ oligodendrocyte differentiation was assessed by counting at least 1000 mCherry+ cells from 35 randomly selected fields (20× objective). Each data replicate (n) was generated from a separate fetal sample and magnetic sort.
Solifenacin treatment in vivo
Solifenacin (Toronto Research Chemicals) was prepared in Hanks' buffered saline (HBSS) at working concentration of 0.8 mg/ml and injected to give a final dose of 10 mg/kg. Unlike darifenacin, which does not cross the blood–brain barrier, 10 mg/kg solifenacin can displace ∼75% of bound muscarinic radioligand in multiple brain regions in rats after intravenous injection (Maruyama et al., 2008). Wild-type BALB/c pups of either sex were weighed daily from postnatal day 4 and injected subcutaneously with either saline or solifenacin. Animals were injected daily beginning on postnatal day 4 until being euthanized at day 9. Animals were perfused using isotonic saline and 4% paraformaldehyde. Solifenacin treatment did not affect the rate of growth during treatment; solifenacin-treated animals were 5.3 ± 0.6 g at day 8 versus 5.1 ± 0.5 g in saline groups (n = 4 animals per group).
Western blotting
Snap-frozen forebrain tissue was homogenized in 700 μl of lysis buffer containing 50 mm β-glycerophosphate, 20 mm HEPES buffer, 1% Triton-100, and protease inhibitors (Roche) using an ultrasonic processor. Protein concentrations were determined using a protein assay (Bio-Rad) and 20 μg of protein was loaded onto 15% Tris-HCl polyacrylamide gels for electrophoresis (Bio-Rad). Proteins were transferred to nitrocellulose membranes, blocked with Odyssey blocking buffer (Li-Cor), and incubated overnight at 4°C with rat anti-MBP (1:1000; AbCam) and α-tubulin (1:20,000; Cell Signaling Technology) in a 5% BSA blocking buffer. After thorough washing with TBS plus 0.1% Tween 20, membranes were incubated with IRDye secondary antibodies (1:5000; Li-Cor) dissolved in a 5% BSA blocking buffer for 1 h at room temperature. For analysis, the blots were imaged with the Odyssey Infrared Imaging system (Li-Cor) and quantified by densitometry using ImageJ. The amount of protein blotted onto each lane was normalized to levels of α-tubulin.
Transplantation into shiverer/rag2 mice
Animals and surgery.
All experiments using shiverer/rag2 mice (a gift from Dr. Steven A. Goldman, University of Rochester; Windrem et al., 2008) were performed according to protocols approved by the University at Buffalo Institutional Animal Care and Use Committee. If necessary, newborn pups of either sex were genotyped on the day of birth to identify homozygote shiverer mice. Four fetal brain samples between 17 and 20 weeks gestational age were used for transplantation experiments, with recipients randomly assigned to saline or solifenacin treatment groups. CD140a+ hOPCs were cultured for up to 1 week in SFM containing PDGF-AA (20 ng/ml)/FGF (5 ng/ml) and frozen using ProFreeze (Lonza) before surgery. Twenty-four to 48 h after thawing, cells were prepared for injection by resuspending cells into HBSS(-) at 1 × 10⁵ cells/μl. Injections were performed as described previously (Sim et al., 2011). Briefly, pups were anesthetized using hypothermia and 5 × 10⁴ cells were injected in each site bilaterally at a depth of 1.1 mm into the either the corpus callosum or brainstem of postnatal 2–3 d pups. The rostral corpus callosum (∼2.5 mm posterior to bregma in day 2–3 pups) was targeted bilaterally in an identical fashion in each treatment group. Cells were injected through pulled glass pipettes inserted directly through the skull into the presumptive target sites. Animals were euthanized and perfused with HBSS followed by 4% paraformaldehyde.
In vitro analysis.
To control for cell viability after implantation, cells remaining after transplant were plated onto poly-l-ornithine/laminin in SFM lacking growth factors and analyzed at 4 d to permit oligodendrocyte differentiation. In all cases, thawed OPCs generated a significant number of O4+ cells that displayed both complex multibranched or myelin sheet-forming morphology.
Analysis of myelination in vivo
Cryopreserved coronal sections of mouse forebrain (16 μm) were cut and brains sampled every 160 μm. Immunohistochemistry was performed as described previously (Sim et al., 2011). Myelination was assessed using rat anti-MBP antibody at 1:200 (Abcam). Oligodendrocyte differentiation was determined using mouse anti-CC1/APC antibody (1:50, OP80; EMD Chemicals). For transplanted animals, human cells were identified with mouse antihuman nuclei (1:400, clone 235-1; Millipore). Alexa Fluor-488-, Alexa Fluor-594-, and Alexa Fluor-647-conjugated goat secondary antibodies were used at 1:500 (Invitrogen). Images of entire coronal sections were captured under matching conditions using the 10× objective of a Zeiss AxioImager microscope or Olympus IX51 with Prior stage and stitched together to create a montage using AxioVision SE64 or FIJI software. The DAPI montage was used to outline the region of interest; MBP area was assessed as the percentage total area of the corpus callosum above threshold using ImageJ software. For CC1 and OLIG2 counting, at least three sections were examined in three regions spanning left, midline, and right corpus callosum, corresponding to at least 200 cells per field. Analysis was conducted on coronal sections 160 μm apart. For counting, data from each animal (nine fields) was averaged to generate a single data point for comparison of treatment groups.
Auditory brainstem response
Auditory brainstem response (ABR) was recorded in homozygous shiverer/rag2 mice of either sex transplanted with hOPCs at 15 weeks after implantation. Mice were anesthetized with ketamine and xylazine (100 and 12 mg/kg, i.p., respectively) and placed on a heating pad (37–38°C) inside a sound-proof chamber. Alternating phase clicks (50 μs pulse) were generated using TDT SigGen software (Tucker-Davis Technologies) and presented at a rate of 21/s. The stimuli were delivered binaurally through a speaker (FT28D; Fostex) located 10 cm in front of the mouse's head. Needle electrodes (Grass Technologies) were placed at the vertex (active), posterior bulla (reference), and behind the shoulder blade (ground). The responses to clicks (0–90 dB pSPL at 10 dB steps) were amplified 5020 times by a TDT Headstage-4 bioamplifier (band-pass filter: 100–3000 Hz) and averaged 200 times with a sampling rate of 24.4 kHz by TDT hardware and software. The presence of the four characteristic positive vertex waves was determined at 90 dB and interpeak latency (IPL) was calculated for each animal.
Results
PDGFαR/CD140a-defined human OPCs are heterogeneous in fetal brain
We hypothesized that subfractions of the CD140a+ hOPC population would represent phenotypically distinct stages of human glial cell fate and differentiation. In rodents, the O4 antigen is widely used to recognize oligodendrocyte progenitors and immature oligodendrocytes. However, in humans, O4 expression has been thought to be restricted to postmitotic cells (Armstrong et al., 1992; Kirschenbaum et al., 1994; Roy et al., 1999). We first investigated whether CD140a/PDGFαR and O4 recognized distinct or overlapping populations in the developing human brain. Confocal immunofluorescence of coronal sections of human forebrain identified numerous cells that coexpressed both antigens within the intermediate zone (Fig. 1a–d). To determine which CD140a/O4 phenotypes were capable of cell division, we performed triple labeling with Ki67, a marker of mitotically capable cells. We found that a significant number of CD140a+O4+ cells labeled with Ki67, whereas we did not find any CD140a−O4+ cells labeled with Ki67+, suggesting that CD140a−O4+ cells represent a postmitotic phenotype.
Figure 1.
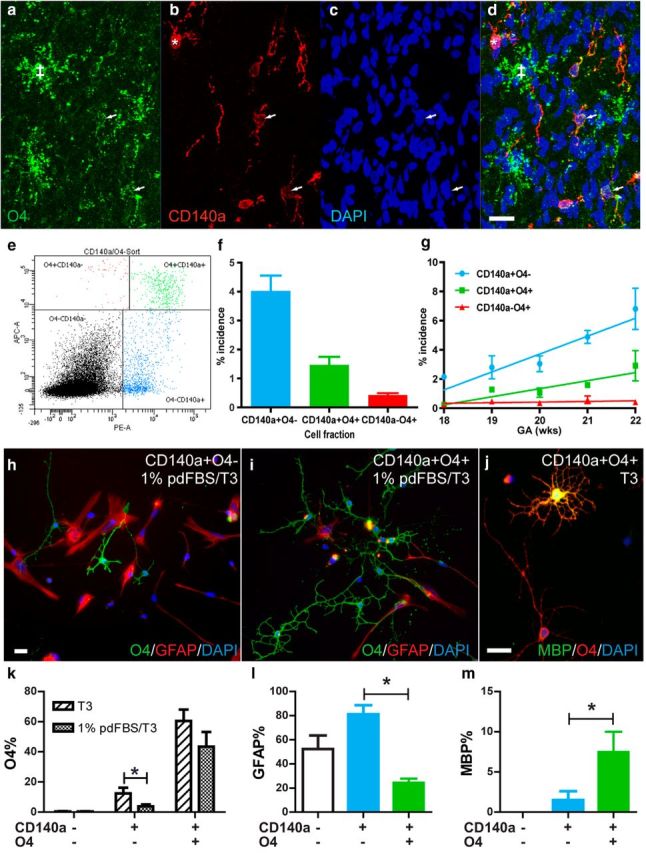
CD140a/PDGFαR and O4 identify three functionally distinct glial pools in the developing human forebrain. a–d, Confocal microscopy of the intermediate zone of 20 week gestational age fetal forebrain. O4 and CD140a mAbs identify three distinct cell populations: CD140a+O4− (*), CD140a+O4+ (arrows), and CD140a−O4+ cells (‡). e, Two-color flow cytometry for CD140a (PE, x-axis) and O4 (APC, y-axis). A clear population of double CD140a+O4+ cells was distinct from single CD140a+ and O4+ cells (100,000 events shown). f, Incidence of each glial cell fraction in human fetal brain (mean incidence between 18 and 22 weeks, n = 12 fetal samples). CD140a+O4− cells were significantly more abundant than CD140a+O4+ and CD140a-O4+ cells. g, Incidence with respect to developmental age (mean ± SEM, linear regression line of best-fit shown). h, Fetal dissociates were sorted for CD140a/O4 expression cultured for 4 d in serum-free or low serum (1% pd-FBS) to determine cell fate. h–i, Immature oligodendrocytes were labeled with O4 (green) and astrocytes with GFAP (red). j, A significant proportion of CD140a+O4+ cells developed as mature MBP+ oligodendrocytes. k, Oligodendrocytes were significantly more abundant in all sorted fractions relative to CD140a−O4− cells (one-way ANOVA, p < 0.05). The addition of 1% serum significantly reduced oligodendrocyte commitment from CD140a+O4− cells but did not affect CD140a+O4+ cells (post hoc t test, p < 0.05). Consistent with a more committed progenitor phenotype, CD140a+O4+ cells generated significantly fewer astrocytes (l) and more MBP+ oligodendrocytes (m) (mean ± SEM, n = 4–5 fetal samples). Scale bars: 20 μm (a), 10 μm (h–j).
In agreement with these data, two-color flow cytometry of fetal forebrain dissociates revealed a substantial population of cells colabeled with both CD140a and O4 (Fig. 1e). CD140a+O4− cells were the most abundant at 4.02 ± 0.54% (18–22 weeks gestational age, n = 12 fetal brain samples; Fig. 1f). CD140a+O4+ cells were less frequent, accounting for 1.47 ± 0.27%, with CD140a−O4+ representing only a minor fraction of cells during this period (0.428 ± 0.068%). These differences in cell proportion were highly significant (one-way repeated-measures ANOVA; F = 46.7, p < 0.0001). Both CD140a/PDGFαR+ populations became more abundant with increasing developmental age, displaying significant positive correlation (r2 = 0.65 and 0.50 for CD140a+O4− and CD140a+O4+ populations, respectively, p < 0.05), whereas the rare CD140a−O4+ fraction remained <1% throughout the time course examined and did not vary significantly with age (Fig. 1g). Interestingly, we noted that the expression level of O4 antigen was significantly higher in postmitotic CD140a−O4+ cells than CD140a+O4+ cells, suggesting that O4 expression was upregulated as CD140a/PDGFαR expression was downregulated (3.4 ± 1.0-fold increase in median fluorescence intensity, mean ± SEM, n = 12, Mann–Whitney test, p < 0.01).
CD140a+O4+ hOPCs were phenotypically biased toward oligodendrocyte fate
To characterize the phenotypic potential of each CD140a/O4-defined population, we used cell sorting and cultured each fraction in the absence of growth factors for 4 d to promote oligodendrocyte differentiation (Fig. 1h,i). As expected, CD140a−O4− cells, which comprise primarily neurons and neuroblasts, did not generate appreciable numbers of O4-, CNP-, or MBP-expressing oligodendrocytes (<0.5% O4, n = 5 fetal brain samples; Fig. 1k). In contrast, each sorted glial fraction generated substantial numbers of oligodendrocytes (Fig. 1k). Although the rare CD140a−O4+ population did not survive after FACS, a large number rapidly developed multipolar morphology and were identified as CNP- and MBP-expressing oligodendrocytes at 4 d. CD140a+O4+ cells generated significantly more O4+ and MBP+ oligodendrocytes than CD140a+O4− cells (MBP and O4 counts, repeated measures 1-way ANOVA, Tukey's multiple-comparison test, p < 0.05; Fig. 1j,m). Consistent with their mitotic phenotype in vivo, both CD140a/PDGFαR+ populations were capable of incorporating BrdU in vitro, with CD140a+O4− cells being significantly more mitotic than CD140a+O4+ cells (Conway et al., 2012).
We next determined the response of O4-defined CD140a/PDGFαR+ subpopulations to platelet-depleted serum (pd-FBS) that induces astrocyte differentiation (Sim et al., 2011). CD140a+O4− cells were highly responsive to 1% pd-FBS; addition of serum significantly inhibited the differentiation of highly-branched O4+ oligodendrocytes from 12.4 ± 3.9% to 3.9 ± 1.3% (n = 5, Mann–Whitney test, p-value < 0.05; Fig. 1k). In contrast, oligodendrocyte differentiation from CD140a+O4+ cells was not affected by serum exposure at 60.5 ± 7.5% to 43.3 ± 9.9% in serum (n = 5, p = 0.22). Likewise, serum treatment induced GFAP+ astrocyte differentiation from CD140a+O4− cells (>80%), but did not have a significant effect on CD140a+O4+ cells (Fig. 1l). Together, these results suggest that CD140a+O4− cells represent highly mitotic bipotential hOPCs, whereas CD140a+O4+ cells are more oligodendrocyte-biased progenitors.
Transcriptional profiles reveal lineage relationship between CD140a/O4 populations
We characterized the molecular differences between CD140a- and O4-defined hOPC populations using whole genome microarray immediately after FACS (six fetal samples; gestational ages 19–22 weeks). Principle component and sample–sample distance analysis revealed that each fraction was transcriptionally distinct (Fig. 2a,b). Although CD140a−O4− cells expressed several neuronal markers, both CD140a/PDGFαR+ fractions exhibited very high expression of OPC-specific genes (Fig. 2c). CSPG4 and PDGFRA mRNA, the genes encoding NG2 and CD140a, respectively, as well as the oligodendrocyte lineage transcription factors NKX2–2, OLIG2, and SOX10, were highly enriched in both CD140a-defined fractions (each >10-fold compared to CD140a−O4− cells). Consistent with their astrocytic capacity, CD140a+O4− cells also expressed a low level of GFAP mRNA. In contrast, CD140a−O4+ cells expressed higher levels of differentiated oligodendrocyte-expressed transcripts such as MBP and PLP1. Using a linear model approach, we identified significantly regulated genes in each fraction relative to CD140a−O4− cells (>3-fold change, 5% false discovery rate; Fig. 2d). As expected, hypergeometric testing of these gene lists indicated highly significant overlap between CD140a+O4− and CD140a+O4+-expressed genes (p = 6.8 × 10−37) and CD140a+O4+ and CD140a−O4+ genes (p = 2.2 × 10−168). In contrast, only six probes were shared between CD140a+O4− and CD140a−O4+ cells (hypergeometric test p = 0.94). The lineal relationship of CD140a+O4− to CD140a+O4+ cells and CD140a+O4+ to CD140a−O4+ cells was further confirmed by analysis of individual gene–gene correlation across patient samples. This indicated significant conservation between CD140a+O4+ and CD140a−O4+ profiles and divergence between CD140a+O4− and CD140a−O4+ (Fisher's z-transformation of correlations, p < 1 × 10⁻²⁰; Fig. 2b). We confirmed these microarray results using real-time quantitative RT-PCR for MBP and PDGFαR (Fig. 2e). Therefore, the expression profile of isolated cells reflected the lineage potential of each progenitor fraction.
Figure 2.
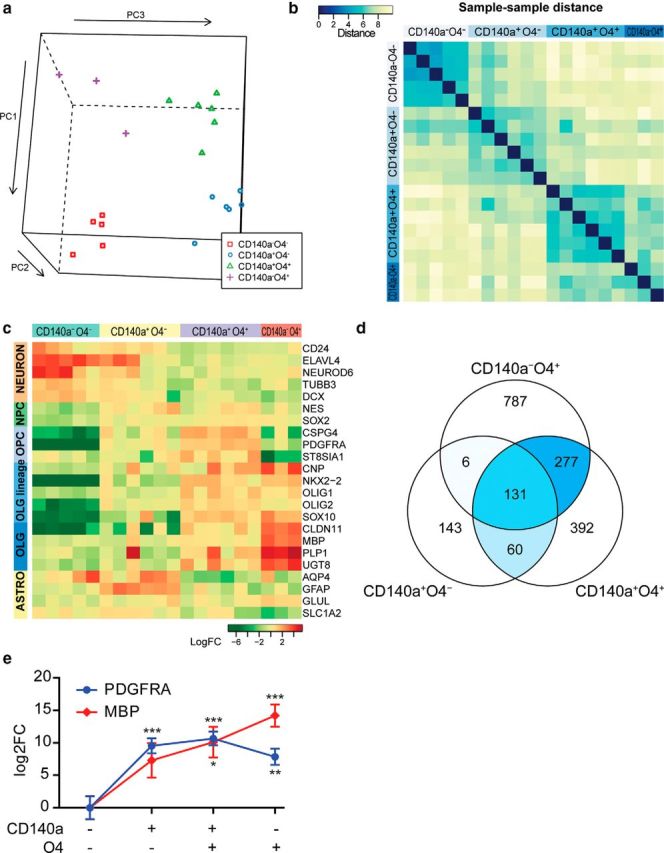
Transcriptional profile of CD140a/O4-sorted cells reveals distinct stages of human oligodendrocyte lineage differentiation. a, Principle components were calculated for each gene expression profile and plotted on a 3D scatter plot. The RNAs for each sorted fraction clustered together, indicating similar expression profiles within each sorted fraction and significant differences between samples. b, Between-sample distances were calculated using maximum distance (uniform norm) between samples. Samples with closely related gene expression patterns and low intersample distances are colored blue according to the color bar. Samples within each sorted fraction from distinct fetal donors were more closely related than between sorted fractions obtained from the same donor brain. c, Several known cell-type-specific marker genes were significantly regulated between each glial fraction and double-negative cells. Gene expression shown indicates expression relative to median of all samples. d, Probes significantly regulated in each cell fraction relative to CD140a−O4− cells. The overlapping genes between each comparison are colored according to their relative abundance. This shows that there is extensive overlap between both CD140+ and O4+ fractions. Only six probes were shared between CD140a+O4− and CD140a−O4+ fractions. e, Real-time RT-PCR confirmed very high enrichment of OPC-expressed PDGFRA and MBP mRNA immediately after CD140a/O4 multicolor FACS (mean ± SEM, n = 5 fetal samples). *p < 0.05, **p < 0.01, ***p < 0.001, Dunnett's posttest, versus CD140a−O4− cells (1-way ANOVA).
Receptor analysis reveals muscarinic cholinergic receptor 3 expression by hOPCs
To identify possible pharmacological targets for the induction of oligodendrocyte differentiation, we selected cell surface receptors with expression restricted to CD140a+O4+ oligodendrocyte-biased OPCs. We then filtered genes on the basis of high expression in CD140a+O4+ cells and upregulated from CD140a+O4− to CD140a+O4+ cells (Table 2). As expected, we found several receptors with known function in rodent OPCs that were highly expressed by their human homologs (Table 2). Among these, we selected CHRM3, muscarinic M3R receptor, for functional validation on the basis of particularly high expression in this dataset and strong downregulation during oligodendrocyte differentiation of human CD140a+ cells and rat A2B5-sorted progenitors (Dugas et al., 2006). We confirmed differential expression of CHRM3 mRNA in human CD140a+O4+ cells by real-time PCR (3.4-fold change, n = 5 individual fetal tissue samples).
Table 2.
Receptors differentially expressed by human OPCs across several genomic datasets
| Receptor class | Receptor gene | Endogenous ligand | Expression data |
Publication supporting OPC expression/role | Notes | ||
|---|---|---|---|---|---|---|---|
| Specific to CD140a+O4+ OPCs | Induced in CD140a+O4+ OPCs | Cahoy 2008 OPC specific | |||||
| Tyrosine kinase | NTRK2 | BDNF, NT-4/5 | X | Cohen et al., 1996b | Only truncated | ||
| NTRK3 | NT-3 | X | X | Barres et al., 1993; Cohen et al., 1996a; Cohen et al., 1996b | Adult OPCs | ||
| Tyrosine phosphatase | PTPRE | Unknown | X | X | — | ||
| PTPRG | Contactin3–6 | X | X | — | Adult OPCs | ||
| GPCR | ADORA1 | Adenosine, AMP | X | X | — | ||
| CALCRL | Calcitonin/adrenomedullin | X | X | X | Uezono et al., 2001 | ||
| CHRM3 | Acetylcholine | X | X | Ragheb et al., 2001; Deshmukh et al., 2013 | |||
| ENDRB | Endothelin | X | Gadea et al., 2009 | ||||
| FZD9 | WNTs (WNT7A) | X | — | ||||
| GPR17 | Nucleotides/cysteinyl-LT | X | X | X | Chen et al., 2009 | Adult OPCs | |
| LGR4 | R-spondin | X | — | ||||
| LPHN3 | FLRT proteins | X | X | — | Adult OPCs | ||
| P2RY11 | ATP | X | — | ||||
| SSTR1 | Somatostatin | X | X | Karschin et al., 1994 | Adult OPCs | ||
| Ion channel | GRIA2 | Glutamate | X | X | X | Yoshioka et al., 1995; Itoh et al., 2002 | Adult OPCs |
| GRIA4 | X | X | Itoh et al., 2002; Brand-Schieber and Werner, 2003 | Adult OPCs | |||
| GRID1 | X | X | X | — | |||
| GRID2 | X | X | — | ||||
| GRIK2 | X | X | Yoshioka et al., 1995 | Adult OPCs | |||
| Nuclear receptor | NR0B1 | Orphan | X | — | Adult OPCs | ||
| Other | ANTXR1 | Unknown | X | — | Adult OPCs | ||
| GRFA1 | GDNF | X | X | — | Adult OPCs | ||
| IFNAR2 | Type I interferon | X | X | — | Fetal NPCs | ||
| IL1RAP | IL1 | X | — | Adult OPCs | |||
| IL1RAPL1 | Unknown | X | — | ||||
| KLRC2 | X | X | — | ||||
| KLRC3 | X | — | |||||
| OPCML | Mu opioids | X | X | — | Adult OPCs | ||
| SEMA3D | Plexin A2 | X | — | ||||
| SEMA5A | CSPG/HSPG, Plexin | X | Goldberg et al., 2004 | Adult OPCs | |||
| SORCS3 | NGF + others | X | X | X | — | Adult OPCs | |
| TSPAN12 | Unknown | X | — | Adult OPCs | |||
Several genes exhibit differential expression in OPCs with only a subset of probes/probe sets in each array experiment. This suggests that only specific splice variants are expressed in an OPC-specific manner. X, Differential expression of receptor mRNA in each comparison; adult OPC, specific expression also observed in adult human A2B5-sorted OPCs compared with unsorted white matter dissociates (Sim et al., 2006, 2009); fetal NPCs, expression in CD133+CD140a− NPCs (Wang et al., 2013); cysteinyl-LTs, cysteinyl-leukotrienes; CSPG, chondroitin sulfate proteoglycan; HSPG, heparin sulfate proteoglycan.
Muscarinic signaling regulates hOPC differentiation directly in vitro
To determine the effect of muscarinic receptor activation, we treated CD140a/PDGFαR-sorted hOPCs with oxotremorine-M (OxoM; 0–40 μm), a potent, nonselective agonist of muscarinic receptors (Dong et al., 1995). In the absence of growth factors, OxoM induced a dose-dependent decrease in O4+ oligodendrocyte differentiation (Fig. 3a–c): from 15.0 ± 2.2% in control cultures to 8.3 ± 1.5% in 40 μm OxoM, a reduction of almost 50% (n = 3, individual fetal brain sample; Fig. 3c). Addition of 20 ng/ml PDGF-AA essentially blocked oligodendrocyte differentiation (1.3 ± 0.6%) and cotreatment with OxoM did not further influence O4%. Live cell counts demonstrated that 0–40 μm OxoM treatment did not alter the density of live cells, indicating that the decrease in O4 proportion reflected an absolute decrease in oligodendrocyte number (n = 4 fetal samples, p > 0.05). Furthermore, costaining with MBP indicated that all MBP+ oligodendrocytes in these cultures were strongly immunoreactive for O4 antigen.
Figure 3.

mAchR activity regulates oligodendrocyte commitment by hOPCs. CD140a/PDGFαR+ hOPCs were treated with 0–40 μm OxoM for 4 d and stained for O4 (red) and DAPI (blue) (a, b). The proportion of O4+ oligodendrocytes was determined at each dose (mean ± SEM, n = 3 seperate brain preparations, 19–22 week gestational age) (c). d–e, CD140a+ hOPCs were cocultured with human neuronal reaggregate cultures for 14 d in vitro (DIV). The fate of human OPCs was tracked by prior infection with mCherry-expressing lentivirus at −2 DIV. Oligodendrocyte differentiation was assessed at 14 DIV by colocalization of mCherry-expressing cells (red) with O4 (green) (d, null control). e, Daily treatment of matched cultures with 50 nm darifenacin, an M3R antagonist, induced oligodendrocyte differentiation. f, Proportion of mCherry+ OPCs expressing O4 was determined (mean ± SEM, n = 3 separate brain preparations). *p < 0.05, t test. Scale bar, 50 μm.
Because a decrease in oligodendrocyte proportion may be due to effects other than differentiation, we also examined cell proliferation (BrdU) and overall oligodendrocyte lineage fate (OLIG2). OxoM did not influence the proportion of OLIG2+ oligodendrocyte lineage cells in these cultures, suggesting that muscarinic receptor activation did not induce astrocyte fate or cause reversion to OLIG2− progenitors (data not shown). Likewise, OxoM did not alter the proportion of dividing OPCs (BrdU% after terminal 24 h pulse). Together, these results suggest that muscarinic agonist treatment specifically blocked human oligodendrocyte differentiation.
We next investigated whether muscarinic antagonists could induce oligodendrocyte commitment. Darifenacin was chosen as a selective M3R antagonist (Moriya et al., 1999). Using the same experimental design, sorted OPCs were treated with either OxoM or darifenacin (n = 4, fetal brain preparations). A 50 nm dose of darifenacin, slightly above the predicted M3R IC50, effectively antagonized the effect of OxoM. Interestingly, darifenacin alone did not influence oligodendrocyte differentiation, suggesting that the receptor was not constitutively active in OPCs and/or that darifenacin cannot act as an inverse agonist in OPCs. To address this, we cocultured hOPCs with fetal human neuronal reaggregate cultures. We confirmed the presence of cholinergic neurons by immunostaining for choline acetyltransferase (ChAT) and hypothesized that acetylcholine released from ChAT+ neurons might delay OPC differentiation that could in turn be antagonized by darifenacin treatment. We tracked OPC fate by infection of isolated cells with mCherry-expressing lentivirus and establishing cocultures 48 h later. Cocultures were maintained for a further 14 d in vitro before immunostaining for O4. In serum-free control conditions containing PDGF-AA and NT-3, 6.4 ± 3% of mCherry+ cells expressed O4 at 14 d (Fig. 3d–f). The majority of cells retained a bipolar progenitor-like phenotype, although occasional very large astrocytic cells were also present. In contrast, in matched cultures treated with darifenacin (50 nm), we observed almost twice as many O4+ cells (11.7 ± 2%, p < 0.05, n = 3, fetal brain preparations). The overall number of mCherry+ cells was not affected by darifenacin treatment, suggesting that the increase in mCherry+O4+ cells was attributable to increased differentiation (41 ± 7 control vs 46 ± 15 darifenacin treated, live cells per 20× field).
To address whether acetylcholine regulates hOPC differentiation, we next treated cocultures with chlorpyrifos, a pesticide that inhibits acetylcholinesterase, to block acetylcholine degradation and thereby increase the concentration of muscarinic receptor ligand. Using the same experimental design, 10 μm chlorpyrifos induced a significant decrease in O4+ oligodendrocyte differentiation from mCherry+ hOPC (12.3 ± 2.8% in DMSO vehicle control vs 7.4 ± 2.4% in chlorpyrifos treated wells, t test, p-value <0.05, n = 3 individual human samples). Importantly, at this dose, chlorpyrifos exerted no overt toxicity on neuronal cocultures and did not affect the overall number/density of mCherry+ hOPCs. This is consistent with a direct role of acetylcholine on muscarinic receptor activation in hOPCs. Therefore, M3R antagonist treatment promoted human oligodendrocyte differentiation in the presence of neurons.
M3R antagonist treatment accelerates mouse myelination
To test the ability of M3R antagonists to regulate oligodendrocyte differentiation in vivo, we used solifenacin because it is a blood–brain barrier-permeable analog of darifenacin suitable for systemic delivery (Maruyama et al., 2008). We hypothesized that solifenacin treatment during OPC expansion and early oligodendrocyte differentiation would promote precocious oligodendrocyte differentiation and myelination. We chose to examine myelination in the developing corpus callosum during the first 2 postnatal weeks of development because the timing of myelination and oligodendrocyte differentiation has been well characterized during this period (Bjelke and Seiger, 1989; Hamano et al., 1996). In addition, systemic pharmacological treatment has been shown to influence OPC differentiation and myelination (Shen et al., 2005). Pups were injected subcutaneously daily with either saline or solifenacin (10 mg/kg) from postnatal day 4 until euthanasia at day 9 (n = 4 animals per group) and the extent of MBP expression was assessed by immunohistochemistry in the corpus callosum (Fig. 4a,b). Solifenacin treatment significantly increased the area of MBP staining by 3-fold, from 11 ± 5% in saline controls to 31 ± 6% in solifenacin-treated animals (n = 4, mean ± SEM, t test, p < 0.05; Fig. 4c). To confirm that solifenacin treatment resulted in increased MBP, we also performed Western blot analysis from brain extracts and observed substantially more MBP protein in solifenacin-treated animals (n = 4 animals; Fig. 4d).
Figure 4.

Systemic treatment with an M3R antagonist promotes precocious oligodendrocyte differentiation in vivo. Neonatal mice received daily subcutaneous injections of either saline or 10 mg/kg solifenacin, a blood–brain barrier-permeable M3R antagonist, from 4 d postnatally until being killedon day 9 (n = 4). a, b, Oligodendrocyte differentiation and myelination was assessed by immunoflourescence staining for MBP in saline- (a) or antagonist (b)-injected animals. The percentage area of myelinated corpus callosum was quantified in each animal and shown in c (mean ± SEM). M3R antagonist treatment induced a significant increase in myelinated area (n = 4 animals per group). d, Solifenacin increased the amount of MBP protein normalized to tubulin (n = 3 mice per group). CC1+OLIG2+ oligodendrocyte cells were counted in corpus callosum and compared with total OLIG2+ oligodendrocyte lineage cells (e). There was a significant increase in the proportion of differentiating oligodendrocytes in solifenacin-treated animals. f, Overall density of CC1+ cells was also increased in corpus callosum. *p < 0.05, t test. Scale bars: 500 μm (a, b), 50 μm (c).
To better determine the effect of solifenacin, we examined the number of differentiated oligodendrocytes in corpus callosum using CC1 and total oligodendrocyte lineage cells expressing Olig2 (Fig. 4e). Importantly, solifenacin induced a significant increase in the proportion of CC1+-differentiated oligodendrocytes among total Olig2+ oligodendroglia (Fig. 4g). Interestingly, the density of Olig2+ cells was not significantly reduced by solifenacin treatment (saline: 2220 ± 173 cells/mm2 vs solifenacin: 1948 ± 141, p > 0.05).
Solifenacin promotes hOPC differentiation and myelination
We next investigated whether M3R antagonist treatment might similarly induce differentiation and myelination from hOPCs in vivo. CD140a/PDGFαR+ hOPCs were injected into the presumptive corpus callosum of postnatal day 1–3 homozygous shiverer/rag2 pups (bilateral injection, 5 × 10⁴ cells/site). CD140a/PDGFαR+ hOPCs rapidly colonize the shiverer forebrain by 8 weeks, yet relatively few differentiate as oligodendrocytes during this period (Sim et al., 2011). Transplanted animals were separated into two groups and were injected daily with either solifenacin (10 mg/kg, s.c.) or saline control until euthanasia. At 8 weeks, solifenacin treatment did not affect the distribution or number of hNA+ cells, with dense engraftment predominantly occurring in corpus callosum and fimbria. Furthermore, we did not observe an effect of solifenacin treatment on human cell division because the Ki67% among hNA+ cells was not affected by solifenacin treatment (12.8 ± 2.6% in saline vs 13.0 ± 2.6% in solifenacin-treated animals). Variable subventricular zone engraftment was observed in transplanted animals, with no consistent differences found between solifenacin- and saline-treated animals. We observed that animals receiving solifenacin had substantially more MBP+ staining than saline controls (Fig. 5a–d). We found that solifenacin induced a substantial increase in the area of MBP staining in the corpus callosum from 6.2 ± 2.0% to 18.5 ± 7.6% in solifenacin-treated animals (n = 3 animals per group) and observed more MBP ensheathed axons in solifenacin-treated animals (Fig. 5d,e). To better quantify the effect of solifenacin on hOPCs, we counted the proportion of human hNA+ cells that differentiated as CC1+ oligodendrocytes in the corpus callosum (Fig. 5f). Systemic solifenacin significantly induced human oligodendrocyte differentiation at 8 weeks (n = 4 animals, p < 0.05).
Figure 5.

Solifenacin promotes human oligodendrocyte differentiation after xenograft into shiverer/rag2 mice. Newborn homozygous shiverer/rag2 mice were transplanted with human CD140a/PDGFαR+ OPCs. Four days later, animals were injected daily with either saline or solifenacin (10 mg/kg) for 8 weeks (n = 4 animals per group). Human cells were identified using human nuclear antigen staining (hNA, red) and myelinating oligodendrocytes using MBP (green). Compared with saline controls (a), solifenacin treatment resulted in a substantial increase in the number of and area myelinated by MBP+ human oligodendrocytes in the corpus callosum at 8 weeks (b, c). d, e, Confocal images showing individual myelinated fibers in corpus callosum of saline-treated (d) and solifenacin-treated (e) animals. f, Human CC1+hNA+ oligodendrocytes were counted in xenografted corpus callosum and compared with total hNA+ human cells (n = 4 animals). *p < 0.05, t test. Scale bars: 100 μm (a–c), 10 μm (d, e).
Solifenacin treatment enhances functional repair by hOPCs
Based on these data, we hypothesized that solifenacin-mediated acceleration of oligodendrocyte differentiation would improve the functional contribution of transplanted hOPCs. hOPC transplantation has been shown to accelerate conduction velocity and to rescue shiverer mice from early demise (Windrem et al., 2008). Because ABR has been used clinically to assess conduction velocity alterations in pathologies associated with demyelination of the underlying tracts, we measured ABR interpeak latencies to assess conduction time. We modified our cell implantation procedure to target directly the ventral midbrain, which contains the ascending fibers of the auditory pathway. Daily solifenacin (10 mg/kg, s.c.) or saline was begun after transplantation and ABR measured at 15 weeks (Fig. 6a). Importantly, solifenacin-treated hOPC-transplanted animals exhibited a significantly reduced IPL II-IV relative to saline-treated hOPC control animals (Fig. 6b).
Figure 6.
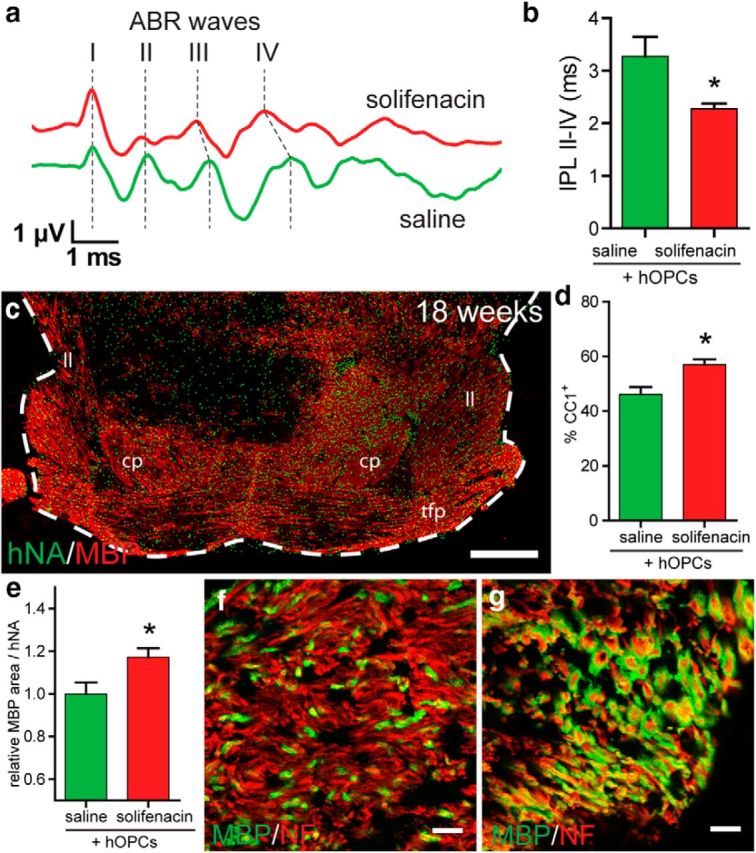
Solifenacin improves functional recovery mediated by transplanted hOPCs. To determine whether solifenacin treatment improves the function of myelin produced by transplanted hOPCs, we transplanted hOPCs into the midbrain of shiverer/rag2 day 1–3 pups and assessed auditory brainstem response at 15 weeks after daily subcutaneous injection with either saline or 10 mg/kg solifenacin. a, Auditory evoked potential waveform from saline- and solifenacin-treated hOPC-transplanted animals indicating the relative timing of positive vertex waves I-IV. b, IPL between peaks II and IV was measured (mean ± SEM, n = 3–5). Solifenacin treatment significantly reduced IPL II-IV. *p < 0.05, t test. At 19 weeks, animals were killed to determine the distribution of human cells (hNA, green) and myelin (MBP, red). c, Myelin was found throughout the ventral midbrain structures, including cerebral peduncle (cp), lateral lemniscus (ll), and transverse fibers pons (tfp). The example coronal section shown from a solifenacin-treated animal corresponds to plate 65 in Franklin and Paxinos (2008). d, Proportion of human cells differentiating as CC1+ oligodendrocytes in the cerebral peduncle. e, Relative contribution of human cells to percentage area of MBP staining in the cerebral peduncle. f, g, Confocal images of myelinated fibers in the cerebral peduncle of saline-treated (f) and solifenacin-treated (g) animals at 19 weeks (neurofilament, red; MBP, green). Scale bars: 500 μm (c), 10 μm (f–g).
To confirm myelination in the central auditory system, we examined the brains of transplanted animals at 18–19 weeks and found extensive MBP staining consistent with myelination throughout the midbrain white matter tracts, including the cerebral peduncle, transverse fibers of the pons, and medial and lateral lemniscus (Fig. 6c). Myelin was also found caudally in the middle cerebellar peduncle and more was found in rostral sections diffusely throughout the reticular formation. Within the cerebral peduncle, long-term solifenacin treatment appeared to slightly reduce cell engraftment (saline: 1861 ± 238 hNA+ cells/mm2, solifenacin: 1367 ± 104, p > 0.05), possibly by reducing the rate of cell proliferation (saline: 5.2 ± 1.4 Ki67+% among human cells, solifenacin: 4.6 ± 0.5%, p > 0.05). However, as in the corpus callosum, we found that solifenacin treatment significantly increased the proportion of human CC1+ oligodendrocytes (Fig. 6d) and that this led to an increase in area of white matter myelinated (MBP) by each human cell (Fig. 6e). Indeed, within the cerebral peduncle, there were several regions in which almost all axons were ensheathed by MBP+ myelin sheaths (Fig. 6g). Together, these data indicate that solifenacin treatment is able to augment the functional repair of transplanted hOPCs.
Discussion
In this study, we identified a new drug target for the facilitation of human-cell-based therapies in myelin disease. We focused exclusively on primary human cells to improve the likelihood of clinical translation. Because library-based screening was impractical with acutely isolated cells, we used a FACS array approach to identify pharmacological targets expressed on hOPCs. First, we used CD140a/O4-based FACS for the prospective isolation of distinct stages of human oligodendrocyte development. Although CD140a/PDGFαR-defined hOPCs are highly myelinogenic in vivo, CD140a-defined cells exhibit heterogeneity for several cell surface antigens (Sim et al., 2011; Wang et al., 2013). We found by confocal microscopy and flow cytometry that a subfraction of CD140a/PDGFαR+ cells coexpressed the oligodendrocyte marker O4. CD140a+O4+ cells retained mitotic activity in vivo and in vitro (Conway et al., 2012) and, interestingly, were heavily biased to oligodendrocyte differentiation in vitro. The loss of CD140a antigenicity corresponded to a postmitotic oligodendrocyte phenotype, with myelin protein genes expression restricted to and enriched in the CD140a−O4+ cells. Because CD140a+O4+ cells retained mitotic activity and were primed for oligodendrocyte differentiation, we hypothesized that cell surface receptors expressed by these cells may regulate their exit from cell cycle and/or commitment to oligodendrocyte fate. By isolating these cells simultaneously after dissociation, we minimized the potential for artifactual changes in gene expression or phenotype. Differential gene-expression analysis of this dataset and comparisons with existing human and mouse datasets identified a discrete set of receptors that were expressed selectively by CD140a+O4+.
Among these transcripts, we identified acetylcholine muscarinic receptor type 3 (CHRM3) mRNA as being among the most highly regulated receptors. We found that muscarinic receptor activation did not overtly influence human CD140a/PDGFαR+ OPC proliferation, but rather inhibited oligodendrocyte commitment and differentiation in a dose-dependent manner. We therefore sought to antagonize this effect using the M3R-selective small molecules darifenacin and solifenacin. Darifenacin treatment of isolated hOPCs had no effect, suggesting that M3R was not constitutively active. Importantly, when human neurons and OPCs were cocultured, thereby providing endogenous activation of M3R, we found that darifenacin was able to induce oligodendrocyte differentiation in vitro. Moreover, we found that systemic solifenacin treatment of neonatal mice was capable of inducing oligodendrocyte differentiation from OPCs. Importantly, we found that solifenacin facilitated differentiation from transplanted hOPCs. We observed a small, nonsignificant decrease in both engraftment and Ki67% of transplanted hOPCs at 8 and 18 weeks after engraftment. This is consistent with the effect of solifenacin reducing the available mitotic OPC population by inducing differentiation. However, the lack of any substantial or significant effect at 18 weeks suggests that hOPC number and engraftment is not limited by prolonged solifenacin treatment. The improvement in transplantation-mediated repair resulted in improved auditory conduction velocity, as determined by ABR measurement. As a generalizable approach, we established that the combination of human stem/progenitor cells with a targeted drug therapy can improve the outcome of cell therapy. This approach can likely be built upon by serially treating grafted recipients with drugs to first improve cell migration and engraftment, followed by inducers of differentiation and myelination.
In rodent brain, M3R mRNA was expressed at relatively low levels compared with other muscarinic receptors and has been found in white matter tracts such as corpus callosum and internal capsule (Levey et al., 1994). In neonatal rodents, multiple muscarinic subtypes were expressed in proliferating OPCs (Ragheb et al., 2001). Using a panel of antagonists, M3R was found to be the primary subtype expressed by OPCs (Ragheb et al., 2001). Carbachol, a nonselective agonist, activates several intracelullar signaling pathways in rodent OPCs, including the PLCγ, PI3K/Akt, and MAPK pathways (Larocca and Almazan, 1997; Pende et al., 1997; Cui et al., 2006). However, the effect of muscarinic agonists on OPCs was unclear because activation of proliferation has been observed in some studies (Cohen et al., 1996a; De Angelis et al., 2012), but not others (Gallo et al., 1996).
Two recent studies have used a library screening approach to identify compounds that induce oligodendrocyte differentiation in rodent OPCs (Deshmukh et al., 2013; Mei et al., 2014). Interestingly, both screens identified nonselective muscarinic antagonists as potential prodifferentiation drugs. Benztropine, a muscarinic/dopamine receptor antagonist, was identified in a chemical screen for compounds capable of inducing oligodendrocyte differentiation from rat OPC cultures (Deshmukh et al., 2013). Other nonselective muscarinic antagonists were also found to induce oligodendrocyte differentiation in vitro. In a separate study, both benztropine and clemastine, an antihistamine and a muscarinic antagonist, respectively, were found to induce oligodendrocyte differentiation (Mei et al., 2014). In animal models, benztropine was found to improve the rate of myelin formation after cuprizone intoxication and to ameliorate symptoms in experimental autoimmune encephalomyelitis (Deshmukh et al., 2013). Clemastine improved the rate of oligodendrocyte differentiation after lysolecithin-induced demyelination in the mouse spinal cord (Mei et al., 2014). Although the mechanism of action of both drugs was not directly studied, considering that both darifenacin and solifenacin are M3R antagonists (Moriya et al., 1999), it is likely that M3R was antagonized in each of these experiments.
Because impaired oligodendrocyte differentiation appears to be common to both perinatal white matter injury (Fancy et al., 2011) and multiple sclerosis (Franklin and Kotter, 2008), small molecules that induce resident oligodendrocyte progenitor differentiation are anticipated to improve outcome in both diseases. Soifenacin is an FDA-approved drug for the treatment of urinary incontinence (Solifenacin/VesiCare, Application No. 021518, Approved 11/19/2004); therefore, it may represent a potential therapeutic for the treatment of myelin disease.
In conclusion, we have used primary human dissociates to define lineally related stages of oligodendrocyte development. Our FACS array analysis identified several receptor candidates with expression restricted to a stage of oligodendrocyte progenitor development immediately before commitment to postmitotic oligodendrocytes. This is an important stage because oligodendrocyte differentiation has been described as being “stalled” in demyelinating lesions in adult humans and the mechanisms that regulate this are therefore very clinically relevant. We selected and validated the functional importance of one candidate, acetylcholine M3R (CHRM3). Using pharmacological agents, we found that muscarinic signaling, most likely acting in part via M3R on OPCs, could be targeted to induce myelination from mouse and, more importantly, human glia, resulting in a functional improvement conferred by human transplantations. To our knowledge, these data represent the first pharmacological modification of transplanted human OPC differentiation and myelination in the intact brain.
Notes
Supplemental material for this article is available at the www.findDB.org web server, which provides access to the complete gene expression data described herein. This material has not been peer reviewed.
Footnotes
This work was supported by the National Multiple Sclerosis Society (Grant RG 5505-A-2), the Kalec Multiple Sclerosis Foundation, and the Empire State Stem Cell Fund (New York State Department of Health Contracts C026413 and C028108). The microarray profiling was supported by grants from the National Institutes of Health/National Cancer Institute (Roswell Park Cancer Institute Cancer Center Support Grant P30 CA016056). The auditory evoked potential testing was supported in part by National Institutes of Health Grant R01DC011808. Opinions expressed here are solely those of the authors and do not necessarily reflect those of the Empire State Stem Cell Board, the New York State Department of Health, or the State of New York. We acknowledge the assistance of the Confocal Microscope and Flow Cytometry Facility in the School of Medicine and Biomedical Sciences, University at Buffalo. We thank J. Conroy of the Roswell Park Cancer Institute for assistance with Illumina Beadarray techniques, Katherine Morrison of the Buffalo Women Services clinic, Brad Poulos of the Human Fetal Tissue Repository at the Albert Einstein College of Medicine for assistance with tissue acquisition, and Greg Conway and David Dietz for technical assistance and advice.
The authors declare no competing financial interests.
References
- Armstrong RC, Dorn HH, Kufta CV, Friedman E, Dubois-Dalcq ME. Pre-oligodendrocytes from adult human CNS. J Neurosci. 1992;12:1538–1547. doi: 10.1523/JNEUROSCI.12-04-01538.1992. [DOI] [PMC free article] [PubMed] [Google Scholar]
- Back SA, Luo NL, Borenstein NS, Levine JM, Volpe JJ, Kinney HC. Late oligodendrocyte progenitors coincide with the developmental window of vulnerability for human perinatal white matter injury. J Neurosci. 2001;21:1302–1312. doi: 10.1523/JNEUROSCI.21-04-01302.2001. [DOI] [PMC free article] [PubMed] [Google Scholar]
- Barres BA, Schmid R, Sendnter M, Raff MC. Multiple extracellular signals are required for long-term oligodendrocyte survival. Development. 1993;118:283–295. doi: 10.1242/dev.118.1.283. [DOI] [PubMed] [Google Scholar]
- Bjelke B, Seiger A. Morphological distribution of MBP-like immunoreactivity in the brain during development. Int J Dev Neurosci. 1989;7:145–164. doi: 10.1016/0736-5748(89)90065-8. [DOI] [PubMed] [Google Scholar]
- Brand-Schieber E, Werner P. (+/-)-Alpha-amino-3-hydroxy-5-methylisoxazole-4-propionic acid and kainate receptor subunit expression in mouse versus rat spinal cord white matter: similarities in astrocytes but differences in oligodendrocytes. Neurosci Lett. 2003;345:126–130. doi: 10.1016/S0304-3940(03)00469-5. [DOI] [PubMed] [Google Scholar]
- Cahoy JD, Emery B, Kaushal A, Foo LC, Zamanian JL, Christopherson KS, Xing Y, Lubischer JL, Krieg PA, Krupenko SA, Thompson WJ, Barres BA. A transcriptome database for astrocytes, neurons, and oligodendrocytes: a new resource for understanding brain development and function. J Neurosci. 2008;28:264–278. doi: 10.1523/JNEUROSCI.4178-07.2008. [DOI] [PMC free article] [PubMed] [Google Scholar]
- Chen Y, Wu H, Wang S, Koito H, Li J, Ye F, Hoang J, Escobar SS, Gow A, Arnett HA, Trapp BD, Karandikar NJ, Hsieh J, Lu QR. The oligodendrocyte-specific G protein-coupled receptor GPR17 is a cell-intrinsic timer of myelination. Nat Neurosci. 2009;12:1398–1406. doi: 10.1038/nn.2410. [DOI] [PMC free article] [PubMed] [Google Scholar]
- Cohen RI, Molina-Holgado E, Almazan G. Carbachol stimulates c-fos expression and proliferation in oligodendrocyte progenitors. Brain Res Mol Brain Res. 1996a;43:193–201. doi: 10.1016/S0169-328X(96)00176-3. [DOI] [PubMed] [Google Scholar]
- Cohen RI, Marmur R, Norton WT, Mehler MF, Kessler JA. Nerve growth factor and neurotrophin-3 differentially regulate the proliferation and survival of developing rat brain oligodendrocytes. J Neurosci. 1996b;16:6433–6442. doi: 10.1523/JNEUROSCI.16-20-06433.1996. [DOI] [PMC free article] [PubMed] [Google Scholar]
- Conway GD, O'Bara MA, Vedia BH, Pol SU, Sim FJ. Histone deacetylase activity is required for human oligodendrocyte progenitor differentiation. Glia. 2012;60:1944–1953. doi: 10.1002/glia.22410. [DOI] [PubMed] [Google Scholar]
- Cui QL, Fogle E, Almazan G. Muscarinic acetylcholine receptors mediate oligodendrocyte progenitor survival through Src-like tyrosine kinases and PI3K/Akt pathways. Neurochem Int. 2006;48:383–393. doi: 10.1016/j.neuint.2005.11.014. [DOI] [PubMed] [Google Scholar]
- De Angelis F, Bernardo A, Magnaghi V, Minghetti L, Tata AM. Muscarinic receptor subtypes as potential targets to modulate oligodendrocyte progenitor survival, proliferation, and differentiation. Developmental neurobiology. 2012;72:713–728. doi: 10.1002/dneu.20976. [DOI] [PubMed] [Google Scholar]
- Deshmukh VA, Tardif V, Lyssiotis CA, Green CC, Kerman B, Kim HJ, Padmanabhan K, Swoboda JG, Ahmad I, Kondo T, Gage FH, Theofilopoulos AN, Lawson BR, Schultz PG, Lairson LL. A regenerative approach to the treatment of multiple sclerosis. Nature. 2013;502:327–332. doi: 10.1038/nature12647. [DOI] [PMC free article] [PubMed] [Google Scholar]
- Dong GZ, Kameyama K, Rinken A, Haga T. Ligand binding properties of muscarinic acetylcholine receptor subtypes (m1–m5) expressed in baculovirus-infected insect cells. J Pharmacol Exp Ther. 1995;274:378–384. [PubMed] [Google Scholar]
- Dugas JC, Tai YC, Speed TP, Ngai J, Barres BA. Functional genomic analysis of oligodendrocyte differentiation. J Neurosci. 2006;26:10967–10983. doi: 10.1523/JNEUROSCI.2572-06.2006. [DOI] [PMC free article] [PubMed] [Google Scholar]
- Edelstein A, Amodaj N, Hoover K, Vale R, Stuurman N. Computer control of microscopes using μManager. New York: Wiley; 2010. [DOI] [PMC free article] [PubMed] [Google Scholar]
- Fancy SP, Harrington EP, Yuen TJ, Silbereis JC, Zhao C, Baranzini SE, Bruce CC, Otero JJ, Huang EJ, Nusse R, Franklin RJ, Rowitch DH. Axin2 as regulatory and therapeutic target in newborn brain injury and remyelination. Nat Neurosci. 2011;14:1009–1016. doi: 10.1038/nn.2855. [DOI] [PMC free article] [PubMed] [Google Scholar]
- Franklin RJ, Kotter MR. The biology of CNS remyelination: the key to therapeutic advances. J Neurol. 2008;255:19–25. doi: 10.1007/s00415-008-1004-6. [DOI] [PubMed] [Google Scholar]
- Franklin K, Paxinos G. The mouse brain in stereotaxic coordinates. Ed 3. New York: Academic; 2008. [Google Scholar]
- Gadea A, Aguirre A, Haydar TF, Gallo V. Endothelin-1 regulates oligodendrocyte development. J Neurosci. 2009;29:10047–10062. doi: 10.1523/JNEUROSCI.0822-09.2009. [DOI] [PMC free article] [PubMed] [Google Scholar]
- Gallo V, Zhou JM, McBain CJ, Wright P, Knutson PL, Armstrong RC. Oligodendrocyte progenitor cell proliferation and lineage progression are regulated by glutamate receptor-mediated K+ channel block. J Neurosci. 1996;16:2659–2670. doi: 10.1523/JNEUROSCI.16-08-02659.1996. [DOI] [PMC free article] [PubMed] [Google Scholar]
- Gentleman RC, Carey VJ, Bates DM, Bolstad B, Dettling M, Dudoit S, Ellis B, Gautier L, Ge Y, Gentry J, Hornik K, Hothorn T, Huber W, Iacus S, Irizarry R, Leisch F, Li C, Maechler M, Rossini AJ, Sawitzki G, Smith C, Smyth G, Tierney L, Yang JY, Zhang J. Bioconductor: open software development for computational biology and bioinformatics. Genome Biol. 2004;5:R80. doi: 10.1186/gb-2004-5-10-r80. [DOI] [PMC free article] [PubMed] [Google Scholar]
- Goldberg JL, Vargas ME, Wang JT, Mandemakers W, Oster SF, Sretavan DW, Barres BA. An oligodendrocyte lineage-specific semaphorin, Sema5A, inhibits axon growth by retinal ganglion cells. J Neurosci. 2004;24:4989–4999. doi: 10.1523/JNEUROSCI.4390-03.2004. [DOI] [PMC free article] [PubMed] [Google Scholar]
- Goldman SA, Nedergaard M, Windrem MS. Glial progenitor cell-based treatment and modeling of neurological disease. Science. 2012;338:491–495. doi: 10.1126/science.1218071. [DOI] [PMC free article] [PubMed] [Google Scholar]
- Hamano K, Iwasaki N, Takeya T, Takita H. A quantitative analysis of rat central nervous system myelination using the immunohistochemical method for MBP. Brain Res Dev Brain Res. 1996;93:18–22. doi: 10.1016/0165-3806(96)00025-9. [DOI] [PubMed] [Google Scholar]
- Itoh T, Beesley J, Itoh A, Cohen AS, Kavanaugh B, Coulter DA, Grinspan JB, Pleasure D. AMPA glutamate receptor-mediated calcium signaling is transiently enhanced during development of oligodendrocytes. J Neurochem. 2002;81:390–402. doi: 10.1046/j.1471-4159.2002.00866.x. [DOI] [PubMed] [Google Scholar]
- Karschin A, Wischmeyer E, Davidson N, Lester HA. Fast inhibition of inwardly rectifying K+ channels by multiple neurotransmitter receptors in oligodendroglia. Eur J Neurosci. 1994;6:1756–1764. doi: 10.1111/j.1460-9568.1994.tb00568.x. [DOI] [PubMed] [Google Scholar]
- Kirschenbaum B, Nedergaard M, Preuss A, Barami K, Fraser RA, Goldman SA. In vitro neuronal production and differentiation by precursor cells derived from the adult human forebrain. Cereb Cortex. 1994;4:576–589. doi: 10.1093/cercor/4.6.576. [DOI] [PubMed] [Google Scholar]
- Larocca JN, Almazan G. Acetylcholine agonists stimulate mitogen-activated protein kinase in oligodendrocyte progenitors by muscarinic receptors. J Neurosci Res. 1997;50:743–754. doi: 10.1002/(SICI)1097-4547(19971201)50:5<743::AID-JNR11>3.0.CO%3B2-2. [DOI] [PubMed] [Google Scholar]
- Levey AI, Edmunds SM, Heilman CJ, Desmond TJ, Frey KA. Localization of muscarinic m3 receptor protein and M3 receptor binding in rat brain. Neuroscience. 1994;63:207–221. doi: 10.1016/0306-4522(94)90017-5. [DOI] [PubMed] [Google Scholar]
- Maruyama S, Tsukada H, Nishiyama S, Kakiuchi T, Fukumoto D, Oku N, Yamada S. In vivo quantitative autoradiographic analysis of brain muscarinic receptor occupancy by antimuscarinic agents for overactive bladder treatment. J Pharmacol Exp Ther. 2008;325:774–781. doi: 10.1124/jpet.108.136390. [DOI] [PubMed] [Google Scholar]
- Mei F, Fancy SP, Shen YA, Niu J, Zhao C, Presley B, Miao E, Lee S, Mayoral SR, Redmond SA, Etxeberria A, Xiao L, Franklin RJ, Green A, Hauser SL, Chan JR. Micropillar arrays as a high-throughput screening platform for therapeutics in multiple sclerosis. Nat Med. 2014;20:954–960. doi: 10.1038/nm.3618. [DOI] [PMC free article] [PubMed] [Google Scholar]
- Moriya H, Takagi Y, Nakanishi T, Hayashi M, Tani T, Hirotsu I. Affinity profiles of various muscarinic antagonists for cloned human muscarinic acetylcholine receptor (mAChR) subtypes and mAChRs in rat heart and submandibular gland. Life Sci. 1999;64:2351–2358. doi: 10.1016/S0024-3205(99)00188-5. [DOI] [PubMed] [Google Scholar]
- Pende M, Fisher TL, Simpson PB, Russell JT, Blenis J, Gallo V. Neurotransmitter- and growth factor-induced cAMP response element binding protein phosphorylation in glial cell progenitors: role of calcium ions, protein kinase C, and mitogen-activated protein kinase/ribosomal S6 kinase pathway. J Neurosci. 1997;17:1291–1301. doi: 10.1523/JNEUROSCI.17-04-01291.1997. [DOI] [PMC free article] [PubMed] [Google Scholar]
- Ragheb F, Molina-Holgado E, Cui QL, Khorchid A, Liu HN, Larocca JN, Almazan G. Pharmacological and functional characterization of muscarinic receptor subtypes in developing oligodendrocytes. J Neurochem. 2001;77:1396–1406. doi: 10.1046/j.1471-4159.2001.00356.x. [DOI] [PubMed] [Google Scholar]
- Roy NS, Wang S, Harrison-Restelli C, Benraiss A, Fraser RA, Gravel M, Braun PE, Goldman SA. Identification, isolation, and promoter-defined separation of mitotic oligodendrocyte progenitor cells from the adult human subcortical white matter. J Neurosci. 1999;19:9986–9995. doi: 10.1523/JNEUROSCI.19-22-09986.1999. [DOI] [PMC free article] [PubMed] [Google Scholar]
- Shen S, Li J, Casaccia-Bonnefil P. Histone modifications affect timing of oligodendrocyte progenitor differentiation in the developing rat brain. J Cell Biol. 2005;169:577–589. doi: 10.1083/jcb.200412101. [DOI] [PMC free article] [PubMed] [Google Scholar]
- Sim FJ, Windrem MS, Goldman SA. Fate determination of adult human glial progenitor cells. Neuron Glia Biol. 2009;5:45–55. doi: 10.1017/S1740925X09990317. [DOI] [PubMed] [Google Scholar]
- Sim FJ, McClain CR, Schanz SJ, Protack TL, Windrem MS, Goldman SA. CD140a identifies a population of highly myelinogenic, migration-competent and efficiently engrafting human oligodendrocyte progenitor cells. Nat Biotechnol. 2011;29:934–941. doi: 10.1038/nbt.1972. [DOI] [PMC free article] [PubMed] [Google Scholar]
- Sim FJ, Lang JK, Waldau B, Roy NS, Schwartz TE, Pilcher WH, Chandross KJ, Natesan S, Merrill JE, Goldman SA. Complementary patterns of gene expression by human oligodendrocyte progenitors and their environment predict determinants of progenitor maintenance and differentiation. Ann Neurol. 2006;59:763–779. doi: 10.1002/ana.20812. [DOI] [PubMed] [Google Scholar]
- Stolt CC, Lommes P, Sock E, Chaboissier MC, Schedl A, Wegner M. The Sox9 transcription factor determines glial fate choice in the developing spinal cord. Genes Dev. 2003;17:1677–1689. doi: 10.1101/gad.259003. [DOI] [PMC free article] [PubMed] [Google Scholar]
- Uezono Y, Nakamura E, Ueda Y, Shibuya I, Ueta Y, Yokoo H, Yanagita T, Toyohira Y, Kobayashi H, Yanagihara N, Wada A. Production of cAMP by adrenomedullin in human oligodendroglial cell line KG1C: comparison with calcitonin gene-related peptide and amylin. Brain Res Mol Brain Res. 2001;97:59–69. doi: 10.1016/S0169-328X(01)00288-1. [DOI] [PubMed] [Google Scholar]
- Wang J, O'Bara MA, Pol SU, Sim FJ. CD133/CD140a-based isolation of distinct human multipotent neural progenitor cells and oligodendrocyte progenitor cells. Stem Cells Dev. 2013;22:2121–2131. doi: 10.1089/scd.2013.0003. [DOI] [PMC free article] [PubMed] [Google Scholar]
- Watkins TA, Emery B, Mulinyawe S, Barres BA. Distinct stages of myelination regulated by gamma-secretase and astrocytes in a rapidly myelinating CNS coculture system. Neuron. 2008;60:555–569. doi: 10.1016/j.neuron.2008.09.011. [DOI] [PMC free article] [PubMed] [Google Scholar]
- Windrem MS, Schanz SJ, Guo M, Tian GF, Washco V, Stanwood N, Rasband M, Roy NS, Nedergaard M, Havton LA, Wang S, Goldman SA. Neonatal chimerization with human glial progenitor cells can both remyelinate and rescue the otherwise lethally hypomyelinated shiverer mouse. Cell Stem Cell. 2008;2:553–565. doi: 10.1016/j.stem.2008.03.020. [DOI] [PMC free article] [PubMed] [Google Scholar]
- Yoshioka A, Hardy M, Younkin DP, Grinspan JB, Stern JL, Pleasure D. Alpha-amino-3-hydroxy-5-methyl-4-isoxazolepropionate (AMPA) receptors mediate excitotoxicity in the oligodendroglial lineage. J Neurochem. 1995;64:2442–2448. doi: 10.1046/j.1471-4159.1995.64062442.x. [DOI] [PubMed] [Google Scholar]