Abstract
The biological activity of cell-derived substrates to maintain undifferentiated murine-induced pluripotent stem (iPS) cells was correlated to membrane fluidity as a new parameter of cell culture substrates. Murine embryonic fibroblasts (MEFs) were employed as feeder cells and their membrane fluidity was tuned by chemical fixation using formaldehyde (FA). Membrane fluidity was evaluated by real-time single-molecule observations of green fluorescent protein-labeled epidermal growth factor receptors on chemically fixed MEFs. Biological activity was monitored by colony formation of iPS cells. Treatment with a low concentration of FA sustained the membrane fluidity and biological activity, which were comparable to those of mitomycin C-treated MEFs. The biological activity was further confirmed by sustained expression of alkaline phosphatase, SSEA-1, and other pluripotency markers in iPS cells after 3–5 days of culture on FA-fixed MEFs. Chemical fixation of feeder cells has several advantages such as providing ready-to-use culture substrates without contamination by proliferating feeder cells. Therefore, our results provide an important basis for the development of chemically fixed culture substrates for pluripotent stem cell culture as an alternative to conventional treatment by mitomycin C or x-ray irradiation.
The surrounding microenvironments of stem cells have been investigated in detail and the factors affecting stem cell fate are also a focus of stem cell biology1,2,3,4,5. Such factors are investigated in terms of biological and physical aspects using biological and synthetic substrates. From a biological viewpoint, many extracellular matrices (ECMs) and adhesion proteins have been investigated in such studies. However, recent studies have revealed the significance of the static properties of substrates, such as their mechanical and topological effects on stem cell fate6,7,8,9,10,11,12,13,14,15. However, the preparation of an artificial niche has mainly focused on ECMs or their derivatives16,17, although a natural niche is formed by the cells and ECM.
Information exchanged between cells is generally in the form of chemical signals or proteinous interactions that occur through various receptors and ligands in the cell membrane18. Receptor-ligand interactions at the cell surface are the first steps in cellular signaling. Because receptor activation and deactivation are initiated in the plasma membrane, the membranous environment likely affects receptor activation, signal propagation, and the processes involved in receptor deactivation. Membrane fluidity influences these processes either through global effects on the physical state of the membrane matrix, such as micro-viscosity changes, or specific chemical interactions of boundary lipids with receptor proteins and transmitters19. A recent study showed that a difference in the mobility of membrane ligands affects both the clustering and activities of the corresponding receptor molecules20.
The relationship between membrane fluidity and protein activation has been investigated extensively21,22,23,24. Recent reports have shown the significance of molecular mobility in cell adhesion and morphology25,26,27,28. Such dynamic behavior is considered to be important for static properties of materials, such as elasticity and rigidity. However, the significance of this dynamic behavior has not been investigated in stem cell culture.
In pluripotent stem cell (PSC) culture, the undifferentiated state is generally maintained in vitro by co-culture with appropriate non-proliferative feeder cells that mimic the PSC niche, which are prepared by irradiation or mitomycin C (MMC) treatment of mouse embryonic fibroblasts (MEFs)29,30,31,32. However, these feeder cells have two practical problems. First, the preparation procedure is laborious. Live feeder cells must be prepared for every passage. Second, feeder cells contaminate the culture during passaging and harvesting of PSCs. To overcome these problems, a storable ready-to-use culture substrate has been developed using formaldehyde (FA)- or glutaraldehyde (GA)-fixed MEFs. Embryonic stem (ES) cells and induced pluripotent stem (iPS) cells grow well on chemically fixed MEFs while maintaining their undifferentiated state33,34.
Previous studies have also shown that membrane proteins retain their biological activity after chemical fixation35,36,37,38,39. Furthermore, direct cell–cell interactions among PSCs and feeder cells play an important role in the maintenance of PSCs. Because proteins can be retained on the plasma membrane of feeder cells after fixation, fixed feeder cells can be considered as nurse cells that support the undifferentiated growth of stem cells. However, it is still unclear why feeder cells retain their biological activities after chemical fixation.
Considering direct interactions of PSCs with fixed feeder cells occur at the cell surface, the physical properties of the cell membrane are likely related to their biological activities. However, to the best of our knowledge, no studies have investigated the relationship of the activities of chemically fixed feeder cells and the physical properties of the cell membrane. Recently, Tanaka et al.40 reported that cell membrane components, such as transmembrane proteins, lipid-anchored proteins, and lipids, maintain their mobility after FA or GA fixation. This finding suggests that the sustained functionality of chemically fixed MEFs is because of the preservation of molecular movement or membrane fluidity after fixation. In this study, we investigated the relationship of the mobility of the cell membrane and the biological activities of FA-fixed MEFs as nurse cells for mouse iPS (miPS) cell culture.
Results
Membrane fluidity of FA-fixed MEFs
Total internal reflection fluorescence (TIRF) microscopy enables us to monitor the movement and spatiotemporal localization of fluorescently labeled single molecules in living cells41,42,43,44. In this study, we observed the movement of single EGFR-GFP molecules on the plasma membrane using TIRF microscopy. We first evaluated the frequency of mobile and immobile molecules (Fig. 1). The frequency of mobile EGFR-GFP in 2.5% FA-fixed MEFs was similar to that in MMC-treated MEFs. Conversely, ≥5% FA treatment significantly reduced the frequency of mobile EGFR-GFP molecules (Fig. 2a). The membrane diffusion coefficient was calculated from the EGFR-GFP movement. In MMC-treated MEFs, EGFR-GFP molecules diffused rapidly on the cell membrane (D = 0.105 ± 0.012 μm2/s), indicating the diffusive property of a live cell membrane. The 2.5% FA-fixed MEFs also maintained the diffusive property of their cell membrane (D = 0.037 ± 0.009 μm2/s), whereas ≥5% FA fixation resulted in almost complete elimination of the diffusive property (D < 0.008 μm2/s) (Fig. 2b).
Figure 1. Single-molecule measurement of a membrane protein in FA-fixed MEFs.
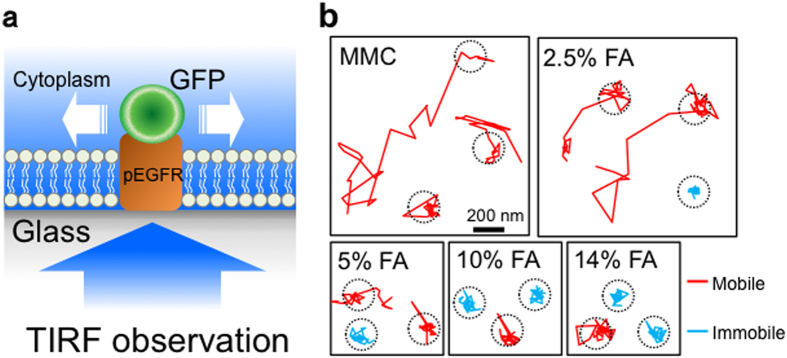
(a) Schematic of the method for single-molecule measurement. EGFR-GFP molecules expressed in MEFs were observed at a single-molecule resolution by TIRF microscopy after MMC treatment or FA fixation. (b) Examples of single-molecule movements of EGFR-GFP. The molecular movement was traced at a temporal resolution of 30.5 msec for 6 s (200 frames). In this measurement, molecules that expanded in the >200-nm range and stayed in the <200-nm range were regarded as mobile and immobile molecules, respectively. Dotted circles represent the 200-nm range.
Figure 2. Membrane fluidity of FA-fixed MEFs.
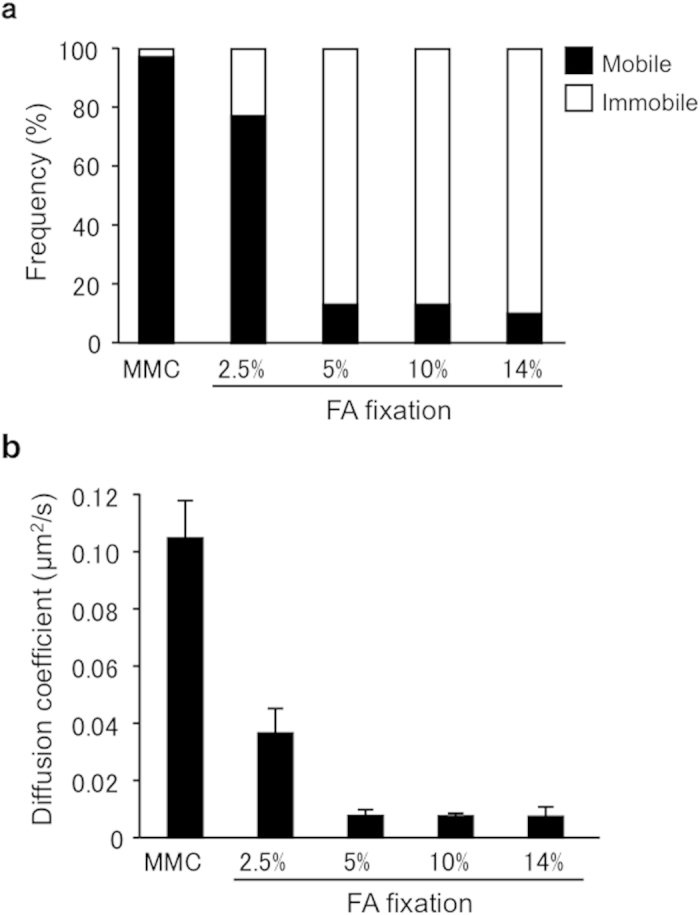
(a) The frequency of mobile (solid) and immobile (outline) EGFR-GFP molecules in MMC-treated and 2.5–14% FA-fixed MEFs. (b) The diffusion coefficient was calculated from the EGFR-GFP molecular movement data (see Materials and Methods). Values are the means ± SD, n = 3.
Considering both the frequency of mobile and immobile molecules and the diffusive property, the membrane fluidity of 2.5% FA-fixed MEFs was more similar to that of non-fixed cells compared with 5% FA-fixed cells. A previous study reported that membrane molecules can move even after fixation by 4% paraformaldehyde40. We confirmed the molecular movement in 2.5% FA-fixed MEFs using EGFR-GFP molecules as a representative cell membrane protein.
Effect of the FA concentration on MEF properties
To examine whether membrane fluidity is related to the functionality of feeder cells, we compared the capacities of 2.5–14% FA-fixed MEFs with MMC-treated MEFs to support undifferentiated growth of miPS cells.
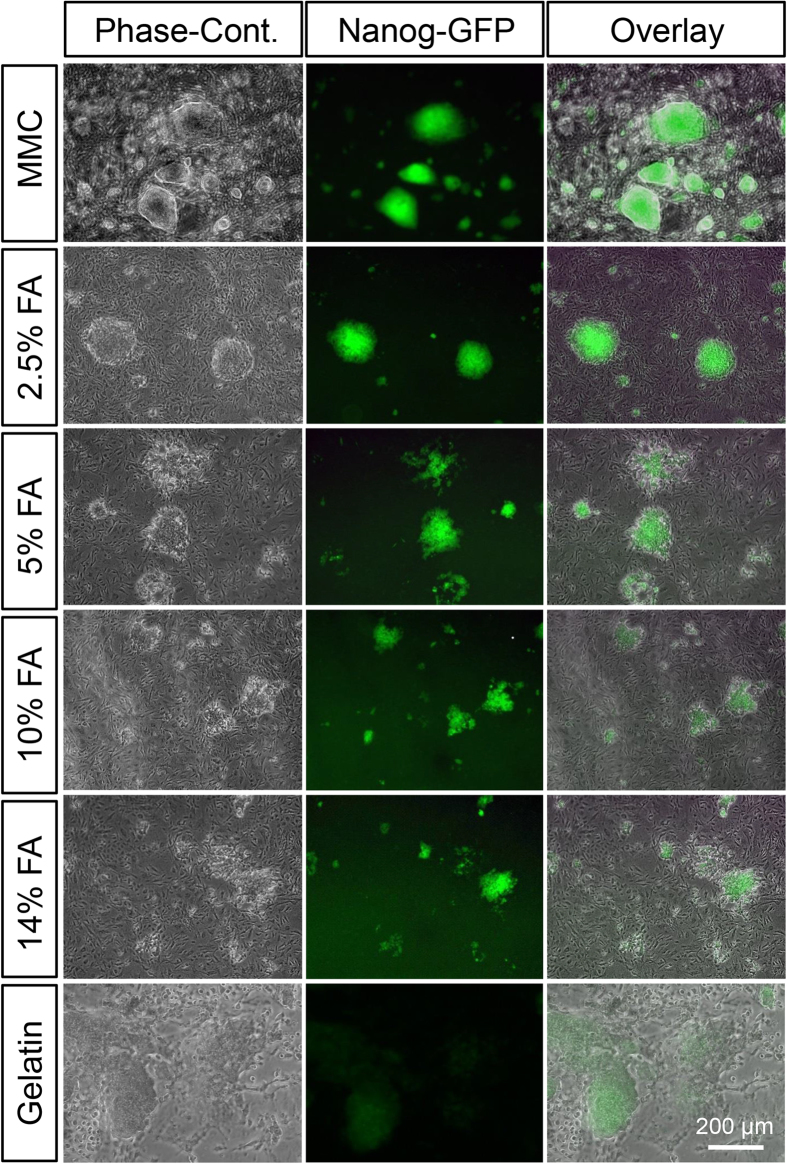
Figure 3 shows that the colony morphology and Nanog expression level of miPS cells cultured on MMC-treated or 2.5–14% FA-fixed MEFs and gelatin-coated dishes. Nanog expression was observed in miPS cells that were cultured on MMC-treated or 2.5–4% FA-fixed MEFs. However, differentiated colonies were frequently observed on ≥5% FA-fixed MEFs and gelatin-coated dishes.
Figure 3. Morphology and Nanog-GFP expression of miPS cells cultured on MMC-treated MEFs, 2.5–14% FA-fixed MEFs, or gelatin-coated surfaces.
Green indicates Nanog-GFP expression. MMC: MEFs treated with 10 μg/mL MMC for 3 h; 2.5–14% FA: MEFs fixed with 2.5–14% FA for 10 min; Gelatin: miPS cells cultured on gelatin-coated dishes without feeder cells.
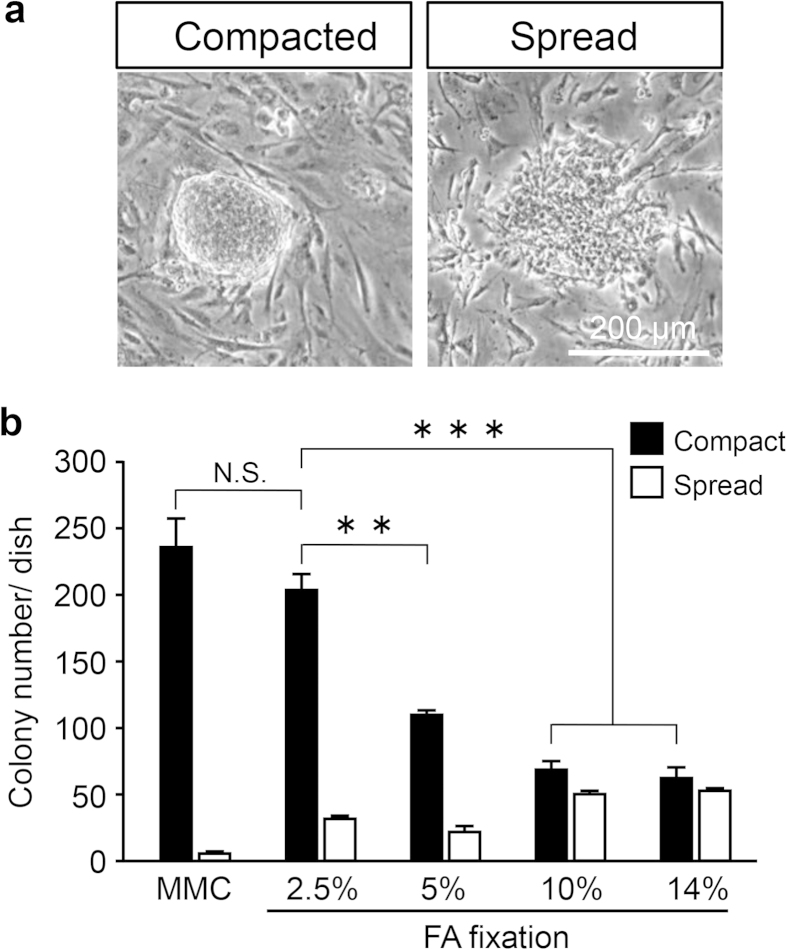
The number of undifferentiated miPS cell colonies on 2.5% FA-fixed MEFs was similar to that on MMC-treated MEFs, but there were significantly fewer undifferentiated colonies on ≥5% FA-fixed MEFs (Fig. 4). These data suggest that the biological activity of 2.5% FA-fixed MEFs as nurse cells is similar to that of MMC-treated MEFs.
Figure 4. Colony formation assay of chemically fixed MEFs.
(a) Typical examples of compact/undifferentiated and spread/differentiated miPS cell colonies. (b) The number of undifferentiated (black) and differentiated (white) colonies. All colonies were counted in the dishes. Values are the means ± SD, n = 3. N.S., no significant difference, p > 0.05. **, significant difference, p < 0.01. ***, significant difference, p < 0.001.
Biological activities of miPS
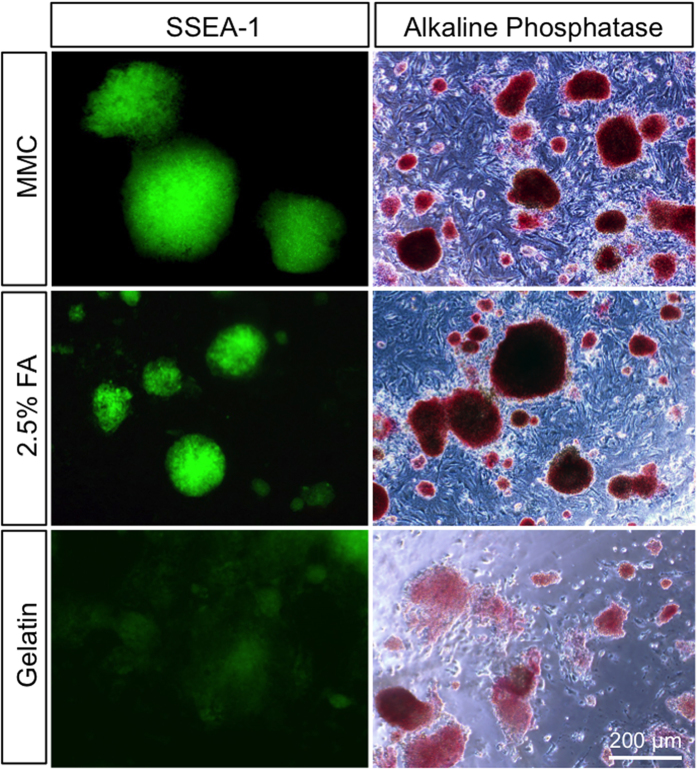
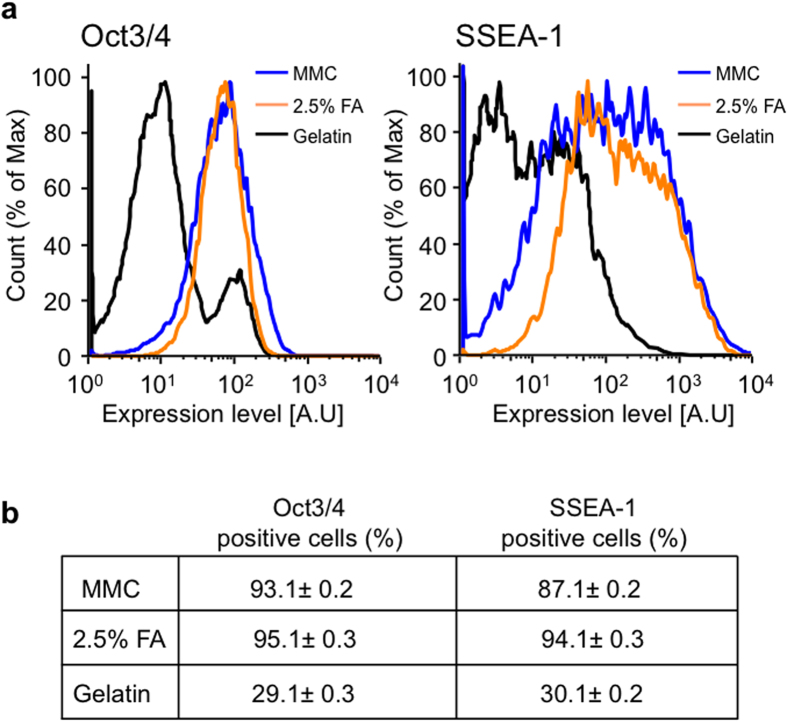
Next, we further examined the use of 2.5% FA-fixed MEFs to maintain miPS cells in an undifferentiated state. We confirmed sustained expression of alkaline phosphatase, SSEA-1, and other pluripotency markers in miPS cells after 3–5 days of culture on 2.5% FA-fixed MEFs (Fig. 5). Furthermore, flow cytometric analysis showed that ~90% of miPS cells expressed SSEA-1 and Oct3/4 on 2.5% FA-fixed MEFs, whereas only ~30% of miPS cells expressed these markers on gelatin-coated dishes (Fig. 6).
Figure 5. Maintenance of the undifferentiated state of miPS cells on 2.5% FA-fixed MEFs.
The expression levels of SSEA-1 and alkaline phosphatase were examined in miPS cells at 3–5 days after seeding on 2.5% FA-fixed MEFs. MMC-treated MEFs and gelatin-coated surfaces were used as control matrices.
Figure 6. Flow cytometric analysis of miPS cells.
(a) Flow cytometric analysis of Oct3/4 (left) and SSEA-1 (right) expression in miPS cells cultured on MMC-treated (blue lines) and 2.5% FA-fixed (orange lines) MEFs, and gelatin-coated surfaces (black lines). The analyses were carried out at 3–5 days of culture on the tested matrices. (b) The frequency of Oct3/4- and SSEA-1-positive miPS cells. Values are the means ± SD, n = 3.
Long-term culture of miPS cells
We have already reported that the pluripotency of mouse iPS cells34 and human iPS cells45 can be maintained on chemically fixed feeder cells over 3 weeks and that the cultured iPS cells are able to form embryonic bodies. Here we cultured mouse iPS cells for more than 4 weeks (cells were passaged every 4 days and, in total, passaged eight times) and quantitatively compared colony formation and expression of a miPS cell pluripotency marker. Figure 7 shows the number of colonies formed on MMC-treated and 2.5% FA-fixed MEFs at different passages. No significant difference was detected for any passage, suggesting the 2.5% FA-fixed MEFs can maintain colony formation of miPS cells even after eight passages.
Figure 7. Colony formation of miPS cells on MMC-treated and 2.5% FA-fixed MEFs. All colonies were counted in the dishes.
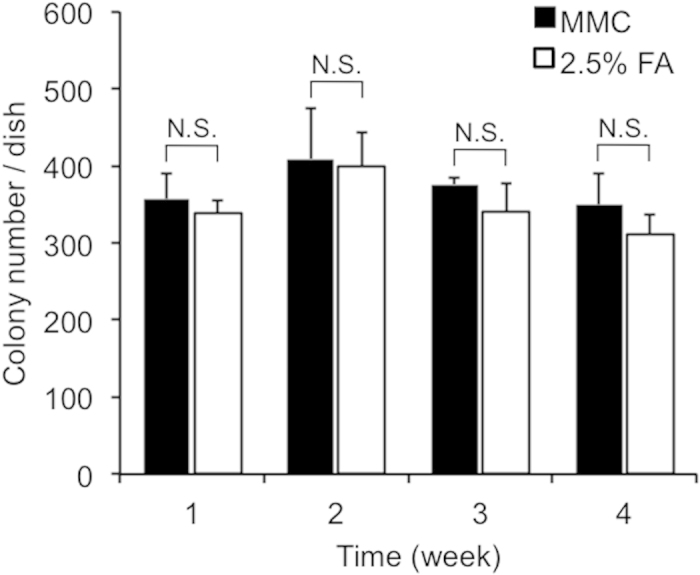
Values are the means ± SD, n = 3. N.S., no significant difference, p < 0.05.
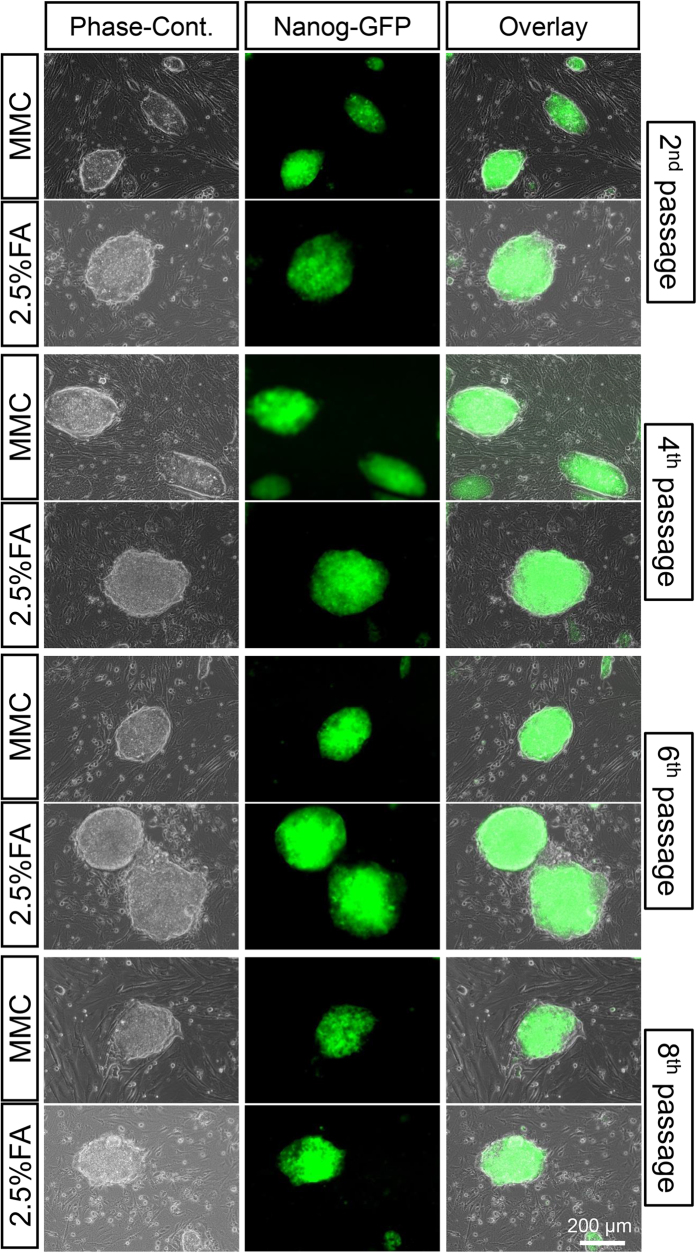
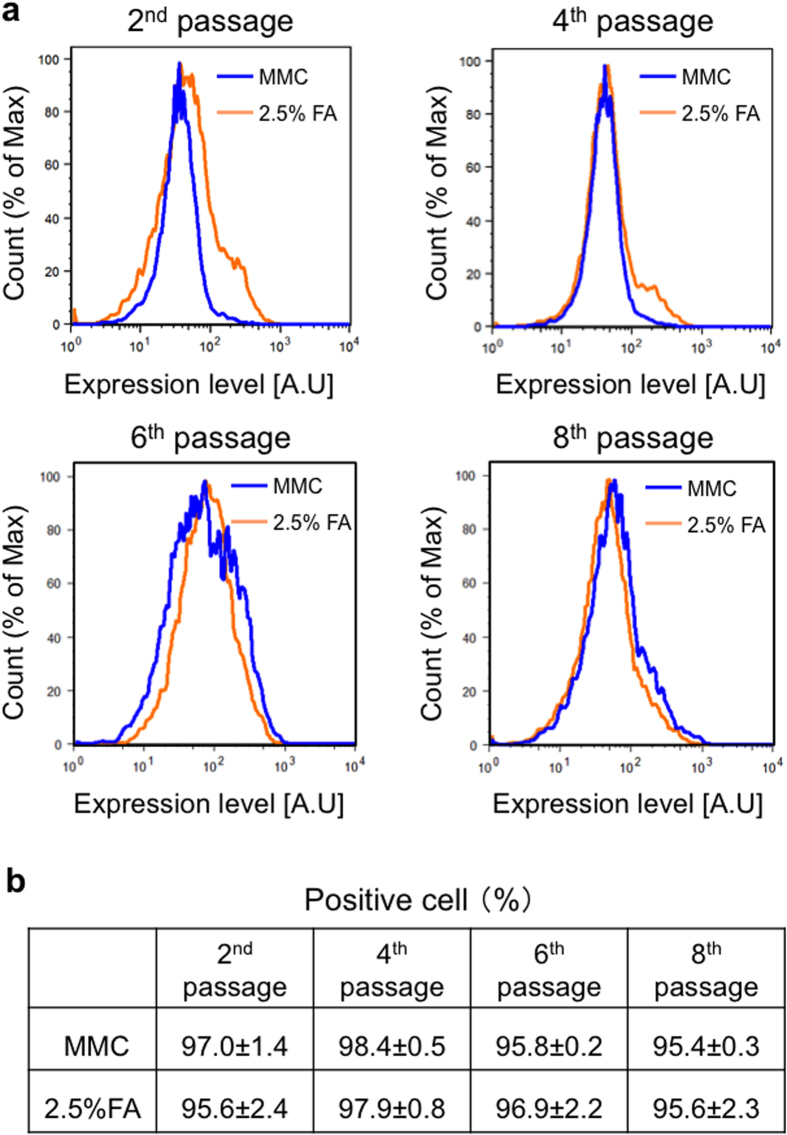
Figure 8 shows colony morphology and Nanog expression in miPS cells cultured on MMC-treated and 2.5% FA-fixed MEFs at different passages. Nanog expression was observed in miPS cells at all passages, suggesting that pluripotency of miPS cells can be maintained on chemically fixed feeder cells after long-term cell culture. This result was further confirmed by flow cytometric analysis (Fig. 9). More than 95% of miPS cells cultured on both MMC-treated and 2.5% FA-fixed MEFs were positively stained and no significant difference was detected between them.
Figure 8. Morphology and Nanog-GFP expression of miPS cells cultured on MMC-treated and 2.5% FA-fixed MEFs at 2nd, 4th, 6th, and 8th passages.
Figure 9. Flow cytometric analysis of miPS.
(a) Flow cytometric analysis of Oct3/4expression in miPS cells cultured on MMC-treated MEFs (blue lines) and 2.5% FA-fixed MEFs (orange lines) at 2nd, 4th, 6th, and 8th passages. (b) The frequency of Oct3/4-positive miPS cells. Values are the means ± SD, n = 3.
Together with the results of the biological assays, these data suggest that 2.5% FA-fixed MEFs can be used as a functional feeder substrate that is equivalent to MMC-treated MEFs.
Discussion
Tanaka et al.40 found that membrane molecules move even after chemical fixation. Under common fixation conditions of 4% paraformaldehyde at 25 °C for 30 min, membrane proteins are immobilized easily, although immobilization is dependent on their properties. In addition, antibody-induced clustering of fluorescently labeled membrane molecules, including proteins and lipids, has been observed under fixation conditions. Our results also demonstrated that a low concentration of formaldehyde did not immobilize exogenous proteins.
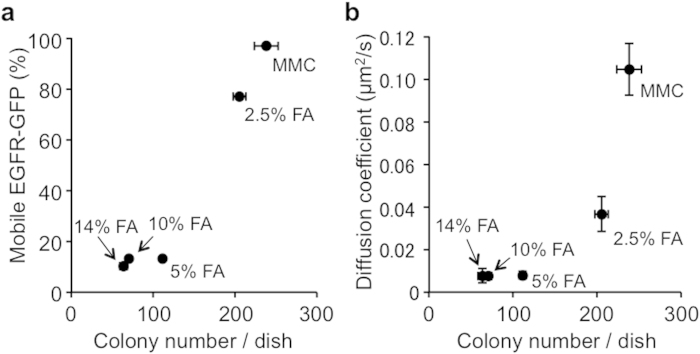
Because we confirmed protein mobility in this study, we hypothesized that the molecular movement of membrane proteins (i.e. ligands) is related to feeder cell functions. Consistent with this hypothesis, we found a positive correlation of both the membrane diffusion coefficient and frequency of mobile membrane molecules with the colony formation activity (Fig. 10). Although the critical conditions are unknown for membrane fluidity to promote biological activity, certain diffusivity is required for biological activity.
Figure 10. Correlation between the membrane fluidity of MEFs and their biological activity.
(a) Relationship between the frequency of mobile EGFR-GFP molecules in MEFs and the number of undifferentiated colonies on the corresponding MEFs. (b) Relationship between the diffusion coefficient of MEFs and the number of undifferentiated colonies on the corresponding MEFs. The plots were made using the values shown in Figs 2 and 4.
Decellularized feeders have been employed with human ES and iPS cell culture46. Klimanskaya et al.47 used sodium deoxycholate and Lima et al.48 used sodium dodecyl sulfate to remove cellular components including DNA. Although they showed that the decellularized extracellular matrix (ECM) could maintain the undifferentiated state, they did not quantitatively compare the activities of MMC-treated and decellularized feeders. Removal of DNA is not considered to be so important for in vitro cell culture. Although ECM has the ability to maintain the undifferentiated state of stem cells, because the activity of 2.5% FA-fixed feeder cells is comparable to that of MMC-treated cells, the chemical fixation is useful for in vitro stem cell culture.
From a practical viewpoint, our results indicate the importance of the regulation of physical properties for PSC culture substrates. We believe that low concentration FA-fixed MEFs have several advantages for PSC culture as follows. 1) They can be stored as a ready-to-use culture substrate. 2) Because fixed cells are insensitive to proteases, contamination by feeder cells can be prevented, leading to the production of highly pure PSCs. 3) Fixed MEFs provide a low-cost and reproducible PSC culture substrate that is produced by simple procedures. Considering these advantages, our methodology is applicable to large-scale production of PSCs requiring feeder cells.
Materials and Methods
Preparation of culture substrates
All animal procedures were conducted according to the Guidelines for the Care and Use of Laboratory Animals of RIKEN and were approved by the RIKEN Institutional Animal Care and Use Committee (Approval ID No.: H23-2-218). To prepare feeder cells as culture substrates, MEFs were established with a standard protocol. Briefly, embryonic day 13.5 mouse embryos were dissected into small pieces, washed twice with phosphate buffered saline (PBS), and then treated with trypsin-EDTA at 37 °C for 30 min with gentle shaking. After removal of aggregated cells by filtration, the cell suspensions were centrifuged to collect the MEFs.
To prepare chemically fixed feeder cells, MEFs were grown to 95% confluence in 60-mm culture dishes, which took about 3 days. After washing with PBS, the cells were fixed with 2.5, 5, 10, or 14% FA diluted in Dulbecco’s modified Eagle’s medium (DMEM) (Wako Pure Chemical Industries, Ltd., Osaka, Japan) at room temperature for 10 min. The fixed MEFs were washed three times with PBS and then incubated overnight in miPS cell culture medium (see below) before use. Conventional feeder cells (MMC-treated MEFs) were prepared as follows. MEFs were grown in 60-mm culture dishes to 80–90% confluence and then treated with 10 μg/mL MMC in DMEM containing 10% fetal bovine serum (FBS) at 37 °C for 3 h. The medium was then replaced with miPS cell culture medium and the cells were incubated overnight at 37 °C before use. To prepare gelatin-coated dishes, a sterile 0.1% gelatin solution was applied to culture dishes, followed by incubation for 40 min at room temperature.
Culture of miPS cells
The miPS cells were purchased from the RIKEN Cell Bank and cultured on MMC-treated MEFs with miPS cell culture medium (DMEM [Pure Chemical Industries, Ltd., Osaka, Japan] supplemented with 15% [v/v] FBS, 1 mM sodium pyruvate [Invitrogen, Carlsbad, CA, USA], 2 mM glutamine (Invitrogen), 0.1 mM nonessential amino acids [Chemicon, Temecula, CA, USA], and 0.1 mM 2-mercaptoethanol (Sigma, St. Louis, MO, USA), and 1,000 U/mL leukemia inhibitory factor [Chemicon, Temecula, CA, USA]). miPS cell colonies were harvested by gentle pipetting after brief treatment with 0.25% trypsin to avoid detachment of MEFs. Then, the harvested miPS cells were dispersed into small aggregates by pipetting and seeded on 2.5, 5, 10, or 14% FA-fixed MEFs or gelatin-coated dishes.
Single-molecule imaging
An expression vector for green fluorescent protein-tagged epidermal growth factor receptor (EGFR-GFP), pEGFR-GFP, was constructed as described previously49. In this vector, a monomeric mutation was introduced into the GFP-coding region (A206K) to prevent self-association50. pEGFR-GFP was transiently transfected into MEFs grown on glass coverslips using Lipofectamine 2000 Reagent (Invitrogen, Carlsbad, CA, USA) according to the manufacturer’s instructions. After incubation overnight, the MEFs were treated with MMC or fixed with 2.5, 5, 10, or 14% FA as described above. Immediately before experimental observations, the solution was replaced with minimum essential medium (Nissui, Tokyo, Japan) containing 1% bovine serum albumin and 5 mM Pipes (pH 7.2).
Single molecules of EGFR-GFP were observed by TIRF microscopy using a Nikon TE2000 inverted fluorescence microscope equipped with a 60 × NA 1.49 objective lens (Plan Apo, Nikon, Tokyo, Japan). The specimens were exposed to a 488-nm wavelength laser, and fluorescence images were acquired using an EM-CCD camera (Image EM; Hamamatsu Photonics, Hamamatsu, Japan) at a temporal resolution of 30.5 ms. All the single-molecule experiments were performed at 25 °C.
Evaluation of membrane diffusibility and molecular movement
Two-dimensional trajectories of EGFR-GFP molecules in the plane of the basal membrane (Fig. 1a) were reconstructed by custom-made software51. This software is often used in single-molecule imaging and functional analysis52,53,54. Mobile and immobile EGFR-GFP molecules were determined as follows. The molecular movement was traced in 200 frames (~6 s), and the molecules that expanded from and stayed within a 200-nm range were regarded as mobile and immobile molecules, respectively (Fig. 1b). The diffusion constant was evaluated as described elsewhere55,56. Briefly, the mean square displacement (MSD) was plotted from each trajectory against time (t). For each molecule, the slope of the first three time points in the MSD tplot was used to calculate the diffusion coefficient, D, according to the equation MSDt→0 = 4Dt.
Detection of pluripotency markers
Nanog expression was directly detected in miPS cells by fluorescence microscopy using a Nanog-GFP reporter construct57. Alkaline phosphatase activity was detected using a Vector Red Alkaline Phosphatase Substrate Kit I (Vector Laboratories, Burlingame, CA, USA) after 3.8% FA fixation at room temperature for 10 min, followed by washing with PBS. Immunofluorescence staining of stage-specific embryonic antigen-1 (SSEA-1) was performed with standard procedures using an anti-SSEA-1 antibody (1:200 dilution, clone MC-480; Merck Millipore, Billerica, MA, USA) and Alexa Fluor 546 donkey anti-mouse IgG (H + L) (1:1000 dilution; Invitrogen, Carlsbad, CA, USA) as the secondary antibody.
Flow cytometric analysis
Flow cytometry was performed to determine the frequency of Oct3/4- and SSEA-1-expressing miPS cells. After 3–5 days of culture on 2.5% FA-fixed MEFs, the miPS cells were harvested by treatment with 0.25% trypsin. To obtain suspensions of single miPS cells, the harvested cells were filtered through a 70-μm cell strainer (Becton Dickinson, Franklin Lakes, NJ, USA). The harvested cells were then stained with anti-Oct3/4 or -SSEA-1 antibodies using a BD Stemflow™ Human and Mouse Pluripotent Stem Cell Analysis Kit (BD Biosciences, San Diego, CA, USA) according to the manufacturer’s protocol. A BD FACSDiva instrument was calibrated before each experiment using Becton Rainbow Calibration Particles (BD Biosciences, San Diego, CA, USA), and the negative gate was set using Alexa Fluor 647 Mouse IgG3 (clone J606), κIsotype Control, and PE Mouse IgM (clone G155-228), κIsotype Control. Before analyzing the stained cells, BD CompBead Plus positive and negative beads were analyzed to facilitate application setup. Non-viable cells were excluded by staining with 0.1% v/v propidium iodide (Sigma-Aldrich, Louis, MO, USA). For long-term cell culture analysis, miPS cells were stained with anti-Oct3/4 antibody after been passaged up to eight times (passaged every 4 days for over 4 weeks).
Colony formation assay
Approximately 1 × 10⁵ miPS cells (including small aggregates with sizes of less than 50 μm) were cultured on 2.5%, 5%, 10%, or 14% FA-fixed or MMC-treated MEFs in 60-mm culture dishes for 2 days. After fixation with 3.8% FA for 10 min at room temperature, compact and spread colonies (i.e., undifferentiated and differentiated colonies, respectively) with sizes exceeding 100 μm were counted under a microscope. For long-term culture of miPS cells on 2.5% FA-fixed and MMC-treated MEFs, compact colony numbers were calculated in 60-mm culture dishes after two, four, six, and eight passages (cells were passaged every 4 days for more than 4 weeks).
Additional Information
How to cite this article: Zhou, Y. et al. The significance of membrane fluidity of feeder cell-derived substrates for maintenance of iPS cell stemness. Sci. Rep. 5, 11386; doi: 10.1038/srep11386 (2015).
Supplementary Material
Acknowledgments
This research was supported by JSPS KEKENHI (22220009).
Footnotes
Author Contributions Conceived and designed the experiments: Y.I. Performed the experiments: Y.Z., H.M., B.J., N.U. and C.N. Analyzed the data: Y.I., Y.Z., H.M., N.U. and K.-I.W. Contributed reagents/materials/analysis tools: E.T., Y.W. and Y.S. Wrote the paper: Y.Z., H.M., K.-I.W. and Y.I.
References
- Morrison S. J. & Spradling A. C. Stem Cells and Niches: Mechanisms That Promote Stem Cell Maintenance throughout Life. Cell 132, 598–611 (2008). [DOI] [PMC free article] [PubMed] [Google Scholar]
- Lutolf M. P., Gilbert P. M. & Blau H. M. Designing materials to direct stem-cell fate. Nature 462, 433–441 (2009). [DOI] [PMC free article] [PubMed] [Google Scholar]
- Das R. K. & Zouani O. F. A review of the effects of the cell environment physicochemical nanoarchitecture on stem cell commitment. Biomaterials 35, 5278–5293 (2014). [DOI] [PubMed] [Google Scholar]
- Higuchi A., Ling Q. D., Hsu S. T. & Umezawa A. Biomimetic cell culture proteins as extracellular matrices for stem cell differentiation. Chem. Rev. 112, 4507–4540 (2012). [DOI] [PubMed] [Google Scholar]
- Joddar B. & Ito Y. Artificial niche substrates for embryonic and induced pluripotent stem cell cultures. J. Biotechnol. 168, 218–228 (2013). [DOI] [PubMed] [Google Scholar]
- Trappmann B. et al. Extracellular-matrix tethering regulates stem-cell fate. Nat. Mater. 11, 642–9 (2012). [DOI] [PubMed] [Google Scholar]
- Dalby M. J., Gadegaard N. & Oreffo R. O. C. Harnessing nanotopography and integrin-matrix interactions to influence stem cell fate. Nat. Mater. 13, 558–69 (2014). [DOI] [PubMed] [Google Scholar]
- Murphy W. L., McDevitt T. C. & Engler A. J. Materials as stem cell regulators. Nat. Mater. 13, 547–57 (2014). [DOI] [PMC free article] [PubMed] [Google Scholar]
- Celiz A. D. et al. Materials for stem cell factories of the future. Nat. Mater. 13, 570–9 (2014). [DOI] [PubMed] [Google Scholar]
- Yang C., Tibbitt M. W., Basta L. & Anseth K. S. Mechanical memory and dosing influence stem cell fate. Nat. Mater. 13, 645–52 (2014). [DOI] [PMC free article] [PubMed] [Google Scholar]
- Higuchi A., Ling Q. D., Chang Y., Hsu S. T. & Umezawa A. Physical cues of biomaterials guide stem cell differentiation fate. Chem. Rev. 113, 3297–3328 (2013). [DOI] [PubMed] [Google Scholar]
- Gilbert P. M. et al. Substrate elasticity regulates skeletal muscle stem cell self-renewal in culture. Science 329, 1078–1081 (2010). [DOI] [PMC free article] [PubMed] [Google Scholar]
- Wang G. et al. The effect of topology of chitosan biomaterials on the differentiation and proliferation of neural stem cells. Acta Biomater. 6, 3630–3639 (2010). [DOI] [PubMed] [Google Scholar]
- Engler A. J., Sen S., Sweeney H. L. & Discher D. E. Matrix Elasticity Directs Stem Cell Lineage Specification. Cell 126, 677–689 (2006). [DOI] [PubMed] [Google Scholar]
- Ankam S. et al. Substrate topography and size determine the fate of human embryonic stem cells to neuronal or glial lineage. Acta Biomater. 9, 4535–4545 (2013). [DOI] [PubMed] [Google Scholar]
- Abraham S., Riggs M. J., Nelson K., Lee V. & Rao R. R. Characterization of human fibroblast-derived extracellular matrix components for human pluripotent stem cell propagation. Acta Biomater. 6, 4622–4633 (2010). [DOI] [PubMed] [Google Scholar]
- Cai L. & Heilshorn S. C. Designing ECM-mimetic materials using protein engineering. Acta Biomater. 10, 1751–1760 (2014). [DOI] [PMC free article] [PubMed] [Google Scholar]
- Helmreich E. J. M. Environmental influences on signal transduction through membranes: a retrospective mini-review. Biophys. Chem. 100, 519–534 (2002). [DOI] [PubMed] [Google Scholar]
- Salaita K. et al. Restriction of receptor movement alters cellular response: physical force sensing by EphA2. Science 327, 1380–1385 (2010). [DOI] [PMC free article] [PubMed] [Google Scholar]
- Stabley D., Retterer S., Marshall S. & Salaita K. Manipulating the lateral diffusion of surface-anchored EGF demonstrates that receptor clustering modulates phosphorylation levels. Integr. Biol. 5, 659–668 (2013). [DOI] [PMC free article] [PubMed] [Google Scholar]
- Ichinose J., Morimatsu M., Yanagida T. & Sako Y. Covalent immobilization of epidermal growth factor molecules for single-molecule imaging analysis of intracellular signaling. Biomaterials 27, 3343–3350 (2006). [DOI] [PubMed] [Google Scholar]
- Manz B. N., Jackson B. L., Petit R. S., Dustin M. L. & Groves J. T-cell triggering thresholds are modulated by the number of antigen within individual T-cell receptor clusters. Proc. Natl. Acad. Sci. U. S. A. 108, 9089–9094 (2011). [DOI] [PMC free article] [PubMed] [Google Scholar]
- Chung I. et al. Spatial control of EGF receptor activation by reversible dimerization on living cells. Nature 464, 783–787 (2010). [DOI] [PubMed] [Google Scholar]
- Scott F. L. et al. The Fas-FADD death domain complex structure unravels signalling by receptor clustering. Nature 457, 1019–1022 (2009). [DOI] [PMC free article] [PubMed] [Google Scholar]
- Seo J. H. & Yui N. The effect of molecular mobility of supramolecular polymer surfaces on fibroblast adhesion. Biomaterials 34, 55–63 (2013). [DOI] [PubMed] [Google Scholar]
- Seo J. H. et al. The significance of hydrated surface molecular mobility in the control of the morphology of adhering fibroblasts. Biomaterials 34, 3206–3214 (2013). [DOI] [PubMed] [Google Scholar]
- Seo J. H. et al. Inducing rapid cellular response on RGD-binding threaded macromolecular surfaces. J. Am. Chem. Soc. 135, 5513–5516 (2013). [DOI] [PubMed] [Google Scholar]
- Brinkmann J. et al. About supramolecular systems for dynamically probing cells. Chem. Soc. Rev. 43, 4449–69 (2014). [DOI] [PubMed] [Google Scholar]
- Evans M. J. & Kaufman M. H. Establishment in culture of pluripotential cells from mouse embryos. Nature 292, 154–156 (1981). [DOI] [PubMed] [Google Scholar]
- Lee J. H. et al. Requirement of leukemia inhibitory factor for establishing and maintaining embryonic stem cells in mice. Fertil. Steril. 92, 1133–1140 (2009). [DOI] [PubMed] [Google Scholar]
- Lambshead J. W., Meagher L., O’Brien C. & Laslett A. L. Defining synthetic surfaces for human pluripotent stem cell culture. Cell Regen. 2, 7 (2013). [DOI] [PMC free article] [PubMed] [Google Scholar]
- Zonca M. Jr. & Xie Y. Chemically Modified Micro- and Nanostructured Systems for Pluripotent Stem Cell Culture. Bionanoscience 2, 287–304 (2012). [Google Scholar]
- Ito Y., Kawamorita M., Yamabe T., Kiyono T. & Miyamoto K. Chemically fixed nurse cells for culturing murine or primate embryonic stem cells. J. Biosci. Bioeng. 103, 113–121 (2007). [DOI] [PubMed] [Google Scholar]
- Yue X.-S. et al. Feeder cells support the culture of induced pluripotent stem cells even after chemical fixation. PLoS One 7, e32707 (2012). [DOI] [PMC free article] [PubMed] [Google Scholar]
- Higashiyama S. et al. The membrane protein CD9/DRAP 27 potentiates the juxtacrine growth factor activity of the membrane-anchored heparin-binding EGF-like growth factor. J. Cell Biol. 128, 929–938 (1995). [DOI] [PMC free article] [PubMed] [Google Scholar]
- Roy V. & Verfaillie C. M. Soluble factor(s) produced by adult bone marrow stroma inhibit in vitro proliferation and differentiation of fetal liver BFU-E by inducing apoptosis. J. Clin. Invest. 100, 912–920 (1997). [DOI] [PMC free article] [PubMed] [Google Scholar]
- Ito Y., Hasauda H., Kitajima T. & Kiyono T. Ex vivo expansion of human cord blood hematopoietic progenitor cells using glutaraldehyde-fixed human bone marrow stromal cells. J. Biosci. Bioeng. 102, 467–469 (2006). [DOI] [PubMed] [Google Scholar]
- Vazin T., Chen J., Lee C.-T., Amable R. & Freed W. J. Assessment of stromal-derived inducing activity in the generation of dopaminergic neurons from human embryonic stem cells. Stem Cells 26, 1517–1525 (2008). [DOI] [PMC free article] [PubMed] [Google Scholar]
- Verfaillie C. M. & Catanzaro P. Direct contact with stroma inhibits proliferation of human long-term culture initiating cells. Leuk. Off. J. Leuk. Soc. Am. Leuk. Res. Fund, U.K 10, 498–504 (1996). [PubMed] [Google Scholar]
- Tanaka K. A. K. et al. Membrane molecules mobile even after chemical fixation. Nat. Methods 7, 865–866 (2010). [DOI] [PubMed] [Google Scholar]
- Sako Y. Imaging single molecules in living cells for systems biology. Mol. Syst. Biol. 2, 56 (2006). [DOI] [PMC free article] [PubMed] [Google Scholar]
- Morimatsu M. et al. Multiple-state reactions between the epidermal growth factor receptor and Grb2 as observed by using single-molecule analysis. Proc. Natl. Acad. Sci. U. S. A. 104, 18013–18018 (2007). [DOI] [PMC free article] [PubMed] [Google Scholar]
- Teramura Y. et al. Single-molecule analysis of epidermal growth factor binding on the surface of living cells. EMBO J. 25, 4215–4222 (2006). [DOI] [PMC free article] [PubMed] [Google Scholar]
- Sako Y., Minoghchi S. & Yanagida T. Single-molecule imaging of EGFR signalling on the surface of living cells. Nat. Cell Biol. 2, 168–172 (2000). [DOI] [PubMed] [Google Scholar]
- Joddar B., Nishioka C., Takahashi E. & Ito Y. Chemically fixed autologous feeder cell-derived niche for human induced pluripotent stem cell culture. J. Mater. Chem. B Mater. Biol. Med. 00, 1–7 (2015). [DOI] [PubMed] [Google Scholar]
- Joddar B., Hoshiba T., Chen G. & Ito Y. Stem cell culture using cell-derived substrates. Biomater. Sci. 2, 1595–1603 (2014). [DOI] [PubMed] [Google Scholar]
- Klimanskaya I. et al. Human embryonic stem cells derived without feeder cells. Lancet 365, 1636–1641 (2005). [DOI] [PubMed] [Google Scholar]
- Lim M. L. et al. Decellularized feeders: an optimized method for culturing pluripotent cells. Stem Cells Transl. Med. 2, 975–82 (2013). [DOI] [PMC free article] [PubMed] [Google Scholar]
- Carter R. E. & Sorkin A. Endocytosis of functional epidermal growth factor receptor-green fluorescent protein chimera. J. Biol. Chem. 273, 35000–35007 (1998). [DOI] [PubMed] [Google Scholar]
- Zacharias D. A., Violin J. D., Newton A. C. & Tsien R. Y. Partitioning of lipid-modified monomeric GFPs into membrane microdomains of live cells. Science 296, 913–916 (2002). [DOI] [PubMed] [Google Scholar]
- Hibino K., Hiroshima M., Takahashi M. & Sako Y. Single-Molecule Imaging of Fluorescent Proteins Expressed in Living Cells. Methods/Protocols 544, 451–460 (2009). [DOI] [PubMed] [Google Scholar]
- Hibino K., Shibata T., Yanagida T. & Sako Y. A RasGTP-induced conformational change in C-RAF is essential for accurate molecular recognition. Biophys. J. 97, 1277–1287 (2009). [DOI] [PMC free article] [PubMed] [Google Scholar]
- Hibino K., Shibata T., Yanagida T. & Sako Y. Activation kinetics of RAF protein in the ternary complex of RAF, RAS-GTP, and kinase on the plasma membrane of living cells: Single-molecule imaging analysis. J. Biol. Chem. 286, 36460–36468 (2011). [DOI] [PMC free article] [PubMed] [Google Scholar]
- Hiroshima M., Saeki Y., Okada-Hatakeyama M. & Sako Y. Dynamically varying interactions between heregulin and ErbB proteins detected by single-molecule analysis in living cells. Proc. Natl. Acad. Sci. 109, 13984–13989 (2012). [DOI] [PMC free article] [PubMed] [Google Scholar]
- Xiao Z. et al. Single-molecule study of lateral mobility of epidermal growth factor receptor 2/HER2 on activation. J. Phys. Chem. B 112, 4140–4145 (2008). [DOI] [PubMed] [Google Scholar]
- Orr G. et al. Cholesterol dictates the freedom of EGF receptors and HER2 in the plane of the membrane. Biophys. J. 89, 1362–1373 (2005). [DOI] [PMC free article] [PubMed] [Google Scholar]
- Okita K., Ichisaka T. & Yamanaka S. Generation of germline-competent induced pluripotent stem cells. Nature 448, 313–7 (2007). [DOI] [PubMed] [Google Scholar]
Associated Data
This section collects any data citations, data availability statements, or supplementary materials included in this article.


