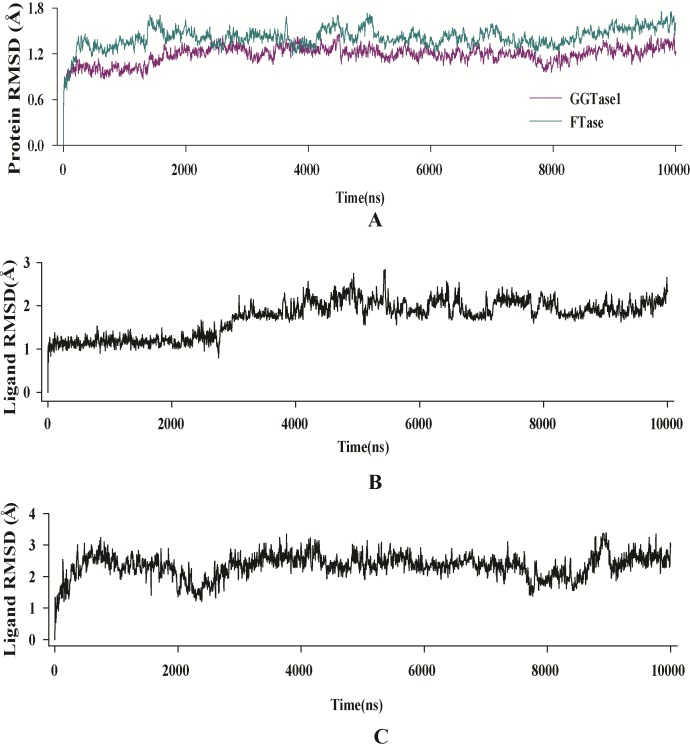
Figure 4.
RMSD evolution of the A) enzymes, B) curcumin fit into GGTase1 and C) curcumin fit into FTase. All protein frames are first aligned on the reference frame backbone, and then the C-α RMSD is calculated. Changes in C-α RMSD lie within acceptable limit of 1-1.4 Å. Ligand (inhibitor) RMSD shows the RMSD of the inhibitor when the enzyme-inhibitor complex is first aligned on the protein backbone of the reference and then the RMSD of the inhibitor heavy atoms is measured. The values observed were not significantly larger than the RMSD of the enzyme.

