

Abstract
Epilepsy is a common serious neurological disorder with a complex set of possible phenotypes ranging from pathologic abnormalities to variations in electroencephalogram. This paper presents a system called Phenotype Exaction in Epilepsy (PEEP) for extracting complex epilepsy phenotypes and their correlated anatomical locations from clinical discharge summaries, a primary data source for this purpose. PEEP generates candidate phenotype and anatomical location pairs by embedding a named entity recognition method, based on the Epilepsy and Seizure Ontology, into the National Library of Medicine's MetaMap program. Such candidate pairs are further processed using a correlation algorithm. The derived phenotypes and correlated locations have been used for cohort identification with an integrated ontology-driven visual query interface. To evaluate the performance of PEEP, 400 de-identified discharge summaries were used for development and an additional 262 were used as test data. PEEP achieved a micro-averaged precision of 0.924, recall of 0.931, and F1-measure of 0.927 for extracting epilepsy phenotypes. The performance on the extraction of correlated phenotypes and anatomical locations shows a micro-averaged F1-measure of 0.856 (Precision: 0.852, Recall: 0.859). The evaluation demonstrates that PEEP is an effective approach to extracting complex epilepsy phenotypes for cohort identification.
Keywords: Epilepsy, Information Extraction, Cohort Identification
1. Introduction
There is an extensive amount of existing work in creating clinical natural language processing (NLP) systems to extract information from free text in specific disease domains. Two salient examples are the Cancer Text Information System (caTIES) [1] and SymText [2]. caTIES has been developed at the University of Pittsburgh to extract coded information from surgical pathology reports using terms from the National Cancer Institute (NCI) Thesaurus. SymText has been used to detect acute bacterial pneumonia from chest x-ray reports. However, few existing efforts have specifically targeted the epilepsy domain.
Epilepsy is a neurological condition characterized by a disruption of the normal electrochemical activity of the brain that results in recurrent seizures [3]. It is the most common neurological disorder, affecting 50-60 million people globally [4]. Sudden Unexpected Death in Epilepsy (SUDEP) is the leading mode of epilepsy-related death and is most common in patients with intractable, frequent, and continuing seizures [5]. It is responsible for 8-17% of deaths in epilepsy patients [6]. The selection of patient cohorts for SUDEP research relies on specific phenotypic characteristics, including syndrome, seizure types, EEG abnormalities, response to anticonvulsants, age at onset, presence of a family history of epilepsy, and medical comorbid disorders [7]. In addition to these phenotypes, the correlation of phenotypic information with anatomical information is crucial for gaining a better understanding of SUDEP, since anatomical information is important for diagnosis, treatment, and prognosis [8].
A typical SUDEP cohort identification query uses several phenotypic and anatomical characteristics. A sample query may read like this: “Identify patients with left frontal lobe epilepsy who have right versive seizure and whose EEG shows left frontal spikes and left frontal ictal EEG pattern.” This query illustrates the required correlation between phenotypic elements (e.g., “versive seizure,” “spikes,” “ictal EEG pattern”) and anatomical locations including laterality (e.g., “right,” “left frontal lobe,” “left frontal”).
Epilepsy phenotypes and related anatomical locations are primarily recorded in narrative discharge summaries in Epilepsy Monitoring Units (EMUs). Manual review of a large number of discharge summaries to extract such information is costly and time-consuming. This problem is exacerbated in multi-center clinical studies such as the ongoing US National Institutes of Health's National Institute of Neurological Disorders and Stroke (NIH-NINDS) initiative on SUDEP [9].
1.1. The Prevention and Risk Identification of SUDEP Mortality project
PRISM (Prevention and Risk Identification of SUDEP Mortality) is a multi-center study funded as a part of the NINDS SUDEP initiative. PRISM aims to enroll potential SUDEP patients from four participating EMUs [10]. Processing clinical narratives from the participating EMUs is a significant informatics challenge for the following reasons:
Epilepsy discharge summaries contain highly specialized epilepsy and seizure-specific terms;
Background knowledge needs to be used to take full advantage of the detailed placement information associated with electrodes that are used to record EEG patterns; and
There are positional variations of anatomical locations of epilepsy phenotypes described in discharge summaries.
1.2. Related work
MetaMap [11, 12] is a well-known open source program used for mapping biomedical terms to the Unified Medical Language System (UMLS) concepts and semantic types. It is capable of identifying clinical findings and anatomical locations, but it lacks support for identifying highly specialized epilepsy domain terms. For example, “sign of four” is a lateralizing sign observed during seizure, and “AF3” is a scalp electrode located on the left frontal lobe. These are specific to epilepsy and cannot be recognized by MetaMap as is.
Clinical Text Analysis and Knowledge Extraction System (cTAKES) is another open source NLP system for identifying clinical named entities [13]. cTAKES is extensible, allowing the implementation of specialized NLP systems focusing on specific disease domains such as epilepsy. Our previous work [14] provided a regular-expression-based clinical free text processing approach called Epilepsy Data Extraction and Annotation (EpiDEA) that extends cTAKES for analyzing epilepsy-specific clinical discharge summaries. EpiDEA takes advantage of the background knowledge captured in the Epilepsy and Seizure Ontology (EpSO) [10] for epilepsy named entity recognition (ENER). EpiDEA extracts structured information from clinical discharge summaries for cohort identification, such as sex, age, epileptogenic zone, etiology, EEG pattern, and antiepileptic medications. However, EpiDEA does not extract more complex information such as anatomical locations (e.g., the locations of EEG electrodes) and the correlation of such anatomical locations with the associated epilepsy phenotypes. There are a few NLP systems that are capable of detecting the anatomical location of clinical findings. The SemRep system [15, 16], designed for automatic identification of semantic predication from biomedical literature, can identify semantic relations such as location relations between UMLS concepts discovered by MetaMap using underspecified syntactic analysis. Medical Language Extraction and Encoding System (MedLEE) [17] detects locations of clinical findings in radiology reports based on a semantic grammar that consists of rules specifying well-defined patterns of semantic classes.
More recent work [18, 19] has focused on correlating anatomical locations and clinical findings in radiology reports. In [18], MedLEE was used to extract clinical findings and anatomical locations from radiology reports, and a rule-based correlation engine was developed to assign locations to findings. In [19], a machine learning approach was presented to recognize the anatomical location of actionable findings in radiology reports. However, these approaches are not directly applicable to the epilepsy domain because of the challenges mentioned earlier. This required the development of an approach for extracting highly specialized epilepsy and seizure-related terms and detailed locations of EEG electrodes.
In this paper, we present a rule-based information extraction system called Phenotype Extraction in Epilepsy (PEEP) to automatically identify epilepsy phenotypes with anatomical locations. PEEP utilizes EpSO, a highly specialized domain ontology, as the background knowledge source. It also leverages MetaMap's capability in identifying anatomical locations. With the extracted phenotypic and anatomical information, patient cohorts can be effectively identified at a greater level of detail relevant to patient care and clinical research.
2. Material and methods
This section consists of three components: (1) an overview of EMU discharge summaries, the input for PEEP; (2) the Epilepsy and Seizure Ontology, the knowledge source for PEEP; (3) the automatic phenotype extraction pipeline of PEEP.
2.1. EMU discharge summaries
The patient discharge summaries used in this work were obtained from the EMU at the University Hospitals Case Medical Center (UH CMC Cleveland). The discharge summary source files were stored in one of three forms: Microsoft Word, Portable Document Format (PDF), or image. These different formats were transformed into a common text format. Discharge summaries in the image format were preprocessed using Adobe Acrobat's Optical Character Recognition (OCR) tool for text recognition, and the results were saved in PDF. Apache Tika [20] was used to extract text from PDF or Microsoft Word documents. The output plain text files were de-identified before processing by PEEP.
An EMU discharge summary report mainly consists of four sections. Each section uses a section heading in capital letters to distinguish them from the textual content. The heading for the first section is not fixed. It is determined by the patient's seizure semiology in one of the following categories: “EPILEPSY CLASSIFICATION,” “CLASSIFICATION OF PAROXYSMAL EPISODES,” and “CLASSIFICATIONOFPAROXYSMAL EVENTS.” The remaining three sections are “HISTORY AND EXAM,” “EVALUATION,” and “CONCLUSIONS AND RECOMMENDATIONS,” respectively.
With the help of two epileptologists, we identified five important categories of epilepsy phenotypes related to anatomical locations for cohort identification: Epileptogenic Zone, Seizure Semiology, Lateralizing Sign, Interictal EEG Pattern, and Ictal EEG Pattern. Figure 1 shows a section in a discharge summary, capturing a patient's Epileptogenic Zone, Seizure Semiology, and Lateralizing Sign. Figure 2 is a segment in the section “EVALUATION,” capturing a patient's Interictal and Ictal EEG Patterns.
Figure 1.
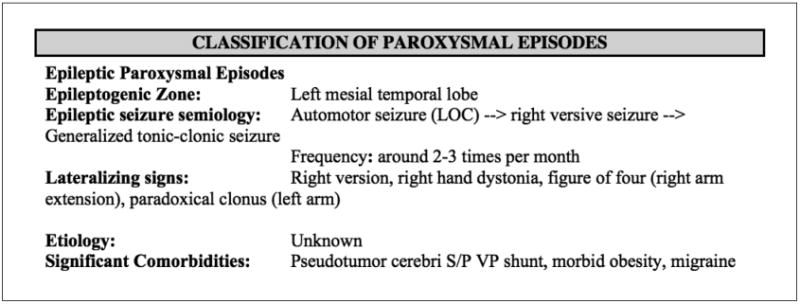
Epileptogenic Zone, Seizure Semiology, Lateralizing Sign captured in an orignal discharge summary.
Figure 2.
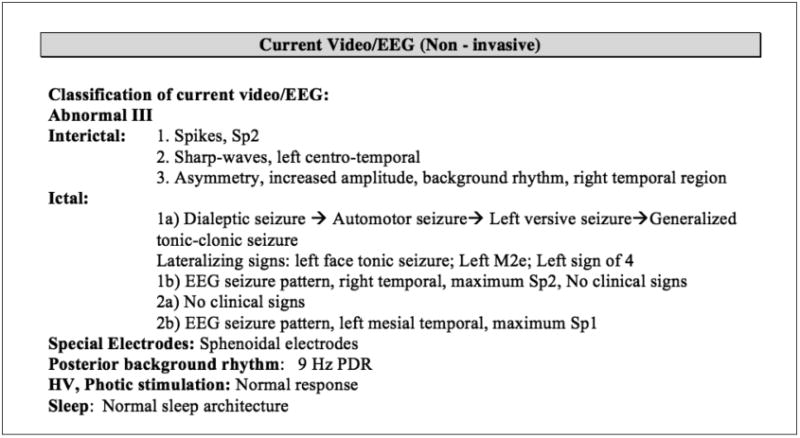
Interictal and Ictal EEG findings captured in a source discharge summary.
2.2. Epilepsy and Seizure Ontology
Epilepsy and Seizure Ontology (EpSO), developed as a part of the PRISM project, is an in-depth, structured knowledge source incorporating the latest International League Against Epilepsy (ILAE) terminology recommendations as well as the National Institute of Neurological Disorders and Stroke common data elements (NINDSCDE) [10]. Currently containing more than 1000 classes, EpSO is modeled using the World Wide Web Consortium (W3C) recommended Web Ontology Language (OWL2). It contains five categories of phenotypes studied in this paper, corresponding to five EpSO classes: “EpileptogenicZone,” “ParoxysmalEvent,”“LateralizingSign,” “InterictalPattern,” and “IctalPattern.” Each class is categorized by multilevel subclasses. For example, “ParoxysmalEvent” has two subclasses: “EpilepticSeizure” and “NonEpilepticSeizure” (paroxysmal events mimicking epileptic seizures). “EpilepticSeizure” is further classified into such subclasses as “Aura,” “DialepticSeizure,” and “MotorSeizure.”
PEEP leverages EpSO as the background knowledge source to support the following functionalities:
Term normalization: Commonly used synonyms and acronyms of a term are modeled using the OWL annotation properties in EpSO, and are normalized using the corresponding EpSO class. Syntactic variation of terms such as singular/plural are normalized using EpSO classes;
Subsumption reasoning: The EpSO class hierarchy allows PEEP to correctly classify terms according to their broader semantic type. For example, EEG signal patterns “polyspike” and “sharp wave” are subtypes of “interictal patterns;” and “scalp electrode T6” locates at “right temporal lobe.”
2.3. The PEEP pipeline
PEEP consists of five modules, represented by five rectangles in Figure 3:
A module for splitting sections and extracting segments to filter out irrelevant information;
A module for generating correlation candidates using EpSO to perform regular-expression-based epilepsy named entity recognition and MetaMap to recognize anatomical locations;
A module for the identification of correlation candidates to link anatomical locations to epilepsy phenotypes;
A module for classifying phenotype categories and storing the resulting structured data to a database; and
A module for performing cohort identification queries.
Figure 3.

Pipeline of the Phenotype Exaction in Epilepsy (PEEP) system.
These modules are described in detail next.
2.3.1. Section splitter and segment extractor
Due to the variations and misspellings of the section headings in discharge summaries, we developed a section splitter using regular expressions and Jaro-Winkler string-distance. Jaro-Winkler string-distance [21] is a measure of similarity between two strings based on the number of characters appearing in approximately the same position in both strings. It is used to identify section heading candidates to match the aforementioned four sections. Patients' epilepsy phenotypes and related anatomical locations are summarized in the first section (Figure 1) and a segment “Current Video/EEG” in the third section (Figure 2), which are extracted using regular expressions.
2.3.2. Phenotype and anatomical location correlation candidate generation
As shown in Figures 1 and 2, the most important phenotype information is captured in summarized and concise ways, which may sometimes be represented as numbered lists. Since new lines often indicate sentence boundaries, they are used to detect sentence boundaries as an alternative.
The complexity in pairing anatomical locations with their corresponding phenotypes stems from the following observations after sentences have been segmented from discharge summaries:
Observation 1: The anatomical location may appear before, after, or in the middle of phenotype terms. Examples (with the anatomical location in bold) include: “generalized clonic seizure,” “right postictal paradoxical clonus,” “right temporal spikes,” “paradoxical left arm and face clonus,” “Tonic seizures (right arm),” and “Spikes, right mesial temporal.”
Observation 2: Some sentences may involve multiple correlated phenotypes and anatomical locations. For example, the sentence “Epileptic seizure semiology: Automotor seizure → Left versive seizure → Left tonic seizure → Generalized tonic clonic seizure” has four phenotypes, among which three have associated laterality information.
Observation 3: A phenotype and related anatomical location pair may appear within-phrase or across-phrase in a sentence. In the example mentioned in Observation 2, each pair appears in a single phrase. However, in the sentence “Interictal: Sharp wave, right temporal, maximum T8,” the phenotype “sharp wave” and anatomical location “right temporal” appear across phrases (they are both phrases themselves).
To address such complexity, we implemented a correlation-pair generator called MetaMapRENER by embedding a rule-based epilepsy named entity recognition (RENER) step, into MetaMap's detection of anatomical locations.
RENER is implemented to identify epilepsy phenotypes and locations of EEG electrodes. Regular expressions are automatically generated for ontological terms in EpSO to perform RENER. The automatic approach to generating regular expressions was described in [14]. Customized rules are also utilized to improve RENER. For instance, “tonic seizure” is an epileptic seizure consisting of sustained muscle contractions lasting more than 5 to 10 seconds. “Tonic episode” or “tonic event” is used to describe a paroxysmal event that mimics tonic seizure and classified as a non-epileptic seizure. In a few discharge summary reports, only “tonic” is used, although the author clearly means “tonic seizure.” The customized rule for detecting and normalizing EEG electrode locations is this:
If an EEG electrode (e.g., “T6”) is detected, then it is normalized as the corresponding anatomical location (e.g., “right temporal lobe”) specified in EpSO.
RENER incorporates such rules to improve recall and to normalize terms. RENER identified terms are automatically normalized using their ontological counterpart in EpSO to support the ontology-driven query interface for cohort identification.
Additionally, MetaMap is used to detect anatomical locations. It first maps terms to UMLS concepts and semantic types, and then filters them by the following six semantic types: “Anatomical Structure,” “Body System,” “Body Part, Organ, or Organ Component,” “Body Location or Region,” “Body Space or Junction,” and “Spatial Concept.”
To address the positional variation of anatomical locations related to phenotypes as shown in Observation 1, MetaMapRENER embeds RENER into MetaMap in the following way for an input text (Figure 4 shows the baseline MetaMapRENER).
Figure 4.

Baseline MetaMapRENER to generate phenotype and anatomical location candidate pairs.
Use MetaMap to divide the input text into phrases.
For each phrase P, use MetaMap to extract a set of anatomical locations (one anatomical location may contain one or multiple words) from the phrase P by filtering the six semantic types mentioned earlier.
If there are no anatomical locations in L (that is | L |= 0), RENER first detects EEG electrodes, normalizes them to anatomical locations, and then adds them to L.
- The rest of the words in phrase P are further processed by RENER to detect phenotypes. The output of the baseline MetaMapRENER for the phrase P consists of a list of correlation candidate pairs of detected phenotypes and anatomical locations in L, based on the the size of L, as follows:
- D.1. If there are no anatomical locations in L (that is, | L |= 0), then only detected phenotypes are returned;
- D.2. If there is one anatomical location in L, then each detected phenotype is paired with the anatomical location in L;
- D.3. Otherwise, that is, there are more than one anatomical location in L, then all the possible combinations of detected phenotypes and anatomical locations are returned.
For situations described in Observation 2 and Observation 3, within-phrase correlation pair appears more often in sentences with delimiters “→”, “;”, or “>”. The baseline MetaMapRENER can detect the delimiters and split a sentence into phrases which are processed to generate correlation candidate pairs. For instance, the detected candidate pairs for the sentence
“Epileptic seizure semiology: Automotor seizure → Left versive seizure → Left tonic seizure → Generalized tonic clonic seizure”
mentioned in Observation 2 are:
(“AutomotorSeizure”, null), (“VersizeSeizure”, “Left”), (“Tonic-Seizure”, “Left”), and (“TonicClonicSeizure”, “Generalized”),
where null means no location.
The across-phrase correlation pairs cannot be detected by the baseline MetaMapRENER if the phenotype and location are recognized as two separated phrases. Hence we improve the baseline MetaMapRENER with the following heuristic:
If there is a phrase with location(s) identified but no phenotype detected by the baseline MetaMapRENER, then the sentence is processed again to detect phenotypes in the rest of the sentence excluding the location(s) words.
Take the sentence “Interictal: Sharp wave, right temporal, maximum T8” mentioned in Observation 3 as an example, “Sharp wave” and “right temporal, maximum T8” are recognized as two phrases. Therefore, the baseline MataMapRENER detects a phenotype “SharpWave” with no location and a location “right temporal” with no phenotype. In this case, the rest of the words in the sentence excluding the location words are processed, and “SharpWave” is recognized as a phenotype with the location “right temporal.” Therefore, the detected candidate pairs for the sentence are (“Sharp-Wave”, null) and (“SharpWave”, “right temporal”).
2.3.3. Correlation algorithm
The phenotype and anatomical location correlation candidate pairs are further filtered using a correlation algorithm to recognize the pairing. Figure 5 shows the correlation algorithm with candidate pairs generated for one document as the input. For each document, duplicated phenotype and anatomical location candidate pairs may be produced. The duplicated pairs are first condensed into one pair (line 1). Some of the remaining pairs may share the same phenotype but different anatomical locations. For example, the remaining pairs may contain (“Spike,” “right frontal temporal”) and (“Spike,” “right temporal”). Each remaining pair is represented as a set of strings (lines 2-8). The best fit is selected using partial matching of the anatomical locations (lines 9-16). Here partial matching is based on the set of words constituting the anatomical locations as follows:
For two locations L1 and L2, L1 is defined as partially matching L2 if the set of words constituting L1 is a subset of that constituting L2.
Figure 5.

Correlation algorithm to identify pairs of phenotypes and anatomical locations for a document.
For the above example, “right temporal” is partially matching “right frontal temporal.” Hence, we discard the pair (“Spike,” “right temporal”), and select (“Spike,” “right frontal temporal”) as the best fit.
2.3.4. Phenotype category classifier
Each phenotype and anatomical location pair obtained is classified into one of the five categories, whose corresponding EpSO classes are: “EpileptogenicZone,” “ParoxysmalEvent,” “LateralizingSign,” “InterictalPattern,” and “IctalPattern.” The classification is automatically performed based on EpSO's class hierarchy. For example, for the correlation pair (“SharpWave,” “Left temporal lobe”), PEEP automatically traverses up the EpSO class hierarchy to find the ancestor classes until one of the five is reached. The output correlation pairs with the assigned categories are stored in a structured relational database for cohort identification.
2.3.5. Ontology-driven query interface for cohort identification
To enable cohort discovery on structured data extracted from discharge summaries, we developed an intuitive query interface called Multi-Modality Epilepsy Data Capture and Integration System (MEDCIS). MEDCIS adapts an ontology-driven query interface framework in our previous work [22, 23, 24].
In [22], a visual query interface called Visual Aggregator and Explorer (VISAGE) was developed for a multi-CTSA-site collaborative project titled Physio-MIMI. Physio-MIMI provided an ontology-driven framework for a federated approach to data integration and VISAGE served as its frontend with support for administrative and query lifecycle management, such as role-based access control, query builder, query manager, and query explorer. Furthermore, VISAGE merged ontology navigation activities with faceted query widget generation to explore Medicare administrative data [23]. Inheriting the design style of of VISAGE, Visual Aggregator and Explorer Plus (VISAGE+) [24] enhanced VISAGE in its abilities in incorporating large ontological systems as plug-and-play components; querying longitudinal and multi-dimensional data using ontology concept attributes; and supporting queries that require transitive closure over the ontology class hierarchy (a.k.a. subsumption reasoning).
Given an ontological system and structured clinical data source, a VIS-AGE+ interface can be implemented using a three-step process: (1) importing the ontology; (2) linking with the data source through a standard database connection; (3) mapping data source columns to appropriate ontology concepts or their attributes. Once these steps are completed, the desired query interface features such as merging ontology browsing with query construction and subsumption reasoning, become activated for use.
Following the three-step process, MEDCIS imports EpSO as a plug-and-play component, connects to the relational database storing epilepsy phenotype and anatomical location information, and maps the database columns to proper EpSO concepts or their attributes. For example, in the table storing EEG patterns and correlated locations, the column for the pattern content is mapped to the EpSO concept “EEGPattern,” and the column for the pattern location is mapped to the concept's attribute value for “hasLocation.” After the completion of the mapping, MEDCIS became directly usable for cohort identification by clinical researchers.
3. Results
We used a corpus of 662 de-identified discharge summaries from EMU at UH CMC. We randomly chose a development set of 400, and the remaining 262 were used as the test set for evaluation.
3.1. Reference standard
Two annotators from the EMU at UH CMC manually made the reference standard for the test set of 262 discharge summaries. The test set was divided into two disjoint subsets, and each annotator worked on a single subset. They discussed the rules to follow before creating the reference standard and shared examples during the process of annotation. They identified epilepsy phenotypes and related anatomical locations and recorded the pairs to a table with columns for each of the five categories. When identifying anatomical locations, they followed such rules as:
If there are no anatomical locations related to a phenotype, then only the phenotype information is filled in;
If there is an EEG electrode identified, then the corresponding anatomical location is used for annotation;
If both anatomical location and EEG electrode appear for a phenotype, then the anatomical location given and the anatomical location corresponding to the EEG electrode are combined with duplicates removed.
The two subsets of annotation results were combined after each annotator cross reviewed each other's annotations, resolved disagreements, and reached a consensus. A third annotator reviewed the combined annotations and manually mapped the epilepsy phenotype terms (e.g., “sharp wave”) to the normalized EpSO terms (e.g., “SharpWave”).
3.2. Evaluation
We evaluated PEEP based on its performance on both phenotype extraction as well as on phenotype and anatomical location pair identification. Label-based measures for multi-label classification problems were used as evaluation metrics [25, 26].
For each phenotype category c, its precision (Pc), recall (Rc), and F1-measure (Fc) are defined as
where TPc is the number of true positives, FPc is the number of false positives, and FNc is the number of false negatives.
The overall performance of PEEP was evaluated using the micro-averaged precision, recall, and F1-measure, which gave equal weight to every document. They were calculated by summing up the individual true positives, false positives, and false negatives of each category. Formally, these are defined as
where C is the set of categories.
Table 1 shows PEEP's performance on phenotype extraction by category, with a micro-averaged F1-measure of 0.927 (Pmicro: 0.924, Rmicro: 0.931) and without accounting for the location information. This demonstrates PEEP's effectiveness in identifying and normalizing epilepsy phenotypes.
Table 1.
Evaluation of phenotype extraction. TP: number of true positives, FP: number of false positives, FN: number of false negatives, P: precision, R: recall, F: F1-measure.
| Category | TP | FP | FN | P | R | F |
|---|---|---|---|---|---|---|
| Epileptogenic Zone | 190 | 0 | 2 | 1.000 | 0.990 | 0.995 |
| Seizure Semiology | 529 | 59 | 50 | 0.900 | 0.914 | 0.907 |
| Lateralizing Sign | 58 | 2 | 8 | 0.967 | 0.879 | 0.921 |
| Interictal EEG Pattern | 349 | 40 | 14 | 0.897 | 0.961 | 0.928 |
| Ictal EEG Pattern | 117 | 0 | 18 | 1.000 | 0.867 | 0.929 |
|
| ||||||
| Micro-average | 0.924 | 0.931 | 0.927 | |||
For identifying phenotype and anatomical location pairs, we used two evaluation settings: exact match and inexact match. For the exact match, two pairs are considered a match if they have the same phenotype terms and the same set of location words. For the inexact match, if two pairs (one pair from the reference standard, the other identified by PEEP) have the same phenotype terms but not exactly the same set of anatomical location words, they are considered to be inexactly matched if the set of anatomical location words in the pair identified by PEEP is a subset of the anatomical location words in the pair from the reference standard.
Table 2 and 3 show the performance of PEEP in the exact match and inexact match settings, respectively. In both settings, Lateralizing Sign received the lowest F1-measures. This demonstrates the highest variability in the description of locations for Lateralizing Sign. For EEG Pattern (including both Interictal EEG Pattern and Ictal EEG Pattern), an extra set of 36 true positives (451 − 415 = 36) were identified for inexact match, indicating that the phenotype was correctly identified but part of the anatomical location information was missing. Although the overall performance decreased compared to the phenotype extraction only (due to the variability of the anatomical locations correlated to phenotypes), micro-averaged F1-measures of 0.856 and 0.895 were achieved for exact match and inexact match, respectively.
Table 2.
Evaluation of phenotype anatomical location pair extraction (exact match). TP: number of true positives, FP: number of false positives, FN: number of false negatives, P: precision, R: recall, F: F1-measure.
| Category | TP | FP | FN | P | R | F |
|---|---|---|---|---|---|---|
| Epileptogenic Zone | 180 | 10 | 12 | 0.947 | 0.938 | 0.942 |
| Seizure Semiology | 504 | 84 | 75 | 0.857 | 0.871 | 0.864 |
| Lateralizing Sign | 48 | 12 | 18 | 0.800 | 0.727 | 0.762 |
| Interictal EEG Pattern | 319 | 70 | 44 | 0.820 | 0.879 | 0.848 |
| Ictal EEG Pattern | 96 | 21 | 39 | 0.821 | 0.711 | 0.762 |
|
| ||||||
| Micro-average | 0.852 | 0.859 | 0.856 | |||
Table 3.
Evaluation of phenotype anatomical location pair extraction (inexact match). TP: number of true positives, FP: number of false positives, FN: number of false negatives, P: precision, R: recall, F: F1-measure.
| Category | TP | FP | FN | P | R | F |
|---|---|---|---|---|---|---|
| Epileptogenic Zone | 185 | 5 | 7 | 0.974 | 0.964 | 0.969 |
| Seizure Semiology | 514 | 74 | 65 | 0.874 | 0.888 | 0.881 |
| Lateralizing Sign | 50 | 10 | 16 | 0.833 | 0.758 | 0.794 |
| Interictal EEG Pattern | 339 | 50 | 24 | 0.872 | 0.934 | 0.902 |
| Ictal EEG Pattern | 112 | 5 | 23 | 0.957 | 0.830 | 0.889 |
|
| ||||||
| Micro-average | 0.892 | 0.899 | 0.895 | |||
4. Discussion
4.1. Comparison with previous work
Table 4 shows the evaluation of phenotype extraction on the test set using our previous approach EpiDEA [14], which achieved a micro-averaged precision of 0.821, recall of 0.638, and F1-measure of 0.718. Its performance on identifying Epileptogenic Zone is the same as that of PEEP (see Table 1) since the related information appeared as simple “attribute:value” pair. For the rest of the categories, PEEP performed better than EpiDEA on phenotype extraction.
Table 4.
Evaluation of phenotype extraction using EpiDEA in [14]. TP: number of true positives, FP: number of false positives, FN: number of false negatives, P: precision, R: recall, F: F1-measure.
| Category | TP | FP | FN | P | R | F |
|---|---|---|---|---|---|---|
| Epileptogenic Zone | 190 | 0 | 2 | 1.000 | 0.990 | 0.995 |
| Seizure Semiology | 368 | 36 | 211 | 0.911 | 0.636 | 0.749 |
| Lateralizing Sign | 17 | 0 | 49 | 1.000 | 0.258 | 0.410 |
| Interictal EEG Pattern | 196 | 122 | 167 | 0.616 | 0.540 | 0.576 |
| Ictal EEG Pattern | 80 | 22 | 55 | 0.784 | 0.593 | 0.675 |
|
| ||||||
| Micro-average | 0.821 | 0.638 | 0.718 | |||
PEEP used the same automatic approach generating regular expressions for named entity recognition (NER) as for EpiDEA, but incorporated some additional customized rules. Since NER is based on phrases recognized by shallow parsers, the main difference in phenotype extraction using PEEP and EpiDEA stemmed from the techniques used for identifying phrases: PEEP adapted MetaMap's shallow parser while EpiDEA adapted cTAKES' shallow parser.
4.2. Error analysis
We performed error analysis for both false negatives and false positives. The following cases were found for false negatives:
Errors introduced in the pre-processing step: The use of Adobe OCR and Apache Tika introduced missing words or spelling errors during their transformation to plain text files. For example, “Polyspike-and-wave and spike-and-wave” was converted to “Polyspik an wave and spik an wave” in the plain text file. Another example is that sometimes the section header or segment header was mispositioned after the transformation, which makes the section splitter and segment extractor identify insufficient information;
Complex combinations of anatomical locations: Take the “Sharp waves, left fronto-temporo-parietal” as an example, MetaMap can only identify “left” and “parietal” with “fronto” and “temporo” missing. Another example is “Sharp wave/Polyspike left temporal T7 FT9 F7,” which contains explicit location and multiple electrodes. Only part of the anatomical locations were identified in these cases. This is the main cause of the discrepancy of exact match and inexact match for EEG Pattern in terms of the numbers of true positives identified (Table 2 and 3);
Missing correlations of intracranial electrodes to brain anatomy in EpSO: EpSO models scalp electrodes that are correlated to anatomical locations, but there are no standard placement schemes defined for intracranial electrodes. This makes it difficult for PEEP to infer brain location for the extracted intracranial electrodes in discharge summaries. The ILAE is in the process of creating a task force to standardize the placement scheme for intracranial electrodes. The incorporation of the new scheme in EpSO will enable PEEP to extract and interpret an increasingly important source of epilepsy phenotype information;
Cross-sentence phenotype and related anatomical location pair: For example, the original sentence “…→ Left versive seizure →” may be split into two sentences “…→ Left” and “versive seizure →” due to the inappropriate line breaks. Also, the related anatomical location may be explicitly written in a different line from the phenotype. PEEP is not capable of identifying cross-sentence phenotype and anatomical location in its current stage. We are planning to test a machine learning based approach that may improve PEEP's ability to handle such cases.
There are two reasons for false positives. One is that MetaMap identified incorrect phrases. For example, MetaMap identified one phrase describing a Lateralizing Sign “Right hand nose wiping” as two phrases “Right hand nose” and “wiping.” This is the main cause of the relatively low performance of Lateralizing Sign identification (Table 2 and 3). The other is that MetaMap sometimes assigned incorrect semantic types to anatomical locations. For instance, MetaMap sometimes assigned the word “Left” in phrase “Left clonic seizure” as a functional concept. This limited PEEP to correctly identifying “clonic seizure” but with the laterality “Left” missing. A possible improvement is to re-identify anatomical location if a phenotype is detected without anatomical location identified.
4.3. Limitation and future work
We only evaluated PEEP on patient discharge summaries from one institution (EMU at UH CMC). In future work, we plan to apply and evaluate PEEP on reports from other participating EMUs. Although the rules used in PEEP has been effective on reports from EMU at UH CMC, extra rules may be needed for processing discharge summaries from other EMUs. It would also be interesting to compare our rule-based approach with a machine learning approach.
5. Conclusion
Manual review of a large number of patient discharge summaries produced in EMUs for identifying a SUDEP cohort is costly and time-consuming. This paper introduces a rule-based system called PEEP for automatic extraction of complex epilepsy phenotypes and correlated anatomical locations from discharge summaries. PEEP leverages a domain ontology called EpSO together with the well-established MetaMap program to facilitate named entity recognition and complex phenotype extraction. The evaluation demonstrates that PEEP is effective in identifying epilepsy phenotypes as well as correlated location information to support cohort identification.
Acknowledgments
The authors would like to thank the anonymous reviewers for their detailed, insightful comments and suggestions which helped to improve the quality of the paper. This work was funded by the Prevention and Risk Identification of SUDEP Mortality Project (1-P20-NS076965-01) and the Case Western Reserve University Clinical and Translational Science Award (CTSC) Grant UL1TR000439.
References
- 1.Crowley RS, Castine M, Mitchell KJ, Chavan G, McSherry T, Feldman M. caTIES-A Grid Based System for Coding and Retrieval of Surgical Pathology Reports and Tissue Specimens In Support Of Translational Research. J Am Med Inform Assoc. 2010;17(3):253–64. doi: 10.1136/jamia.2009.002295. [DOI] [PMC free article] [PubMed] [Google Scholar]
- 2.Fiszman M, Chapman WW, Aronsky D, Evans RS, Haug PJ. Automatic Detection of Acute Bacterial Pneumonia from Chest X-ray Reports. J Am Med Inform Assoc. 2000;7:593–604. doi: 10.1136/jamia.2000.0070593. [DOI] [PMC free article] [PubMed] [Google Scholar]
- 3.Scorza FA, Arida RM, Cysneiros RMT, et al. The brain-heart connection: implications for understanding sudden unexpected death in epilepsy. Cardiol J. 2009;16(5):394–9. [PubMed] [Google Scholar]
- 4.Mbuba CK, Ngugi AK, Newton CR, et al. The epilepsy treatment gap in developing countries: a systematic review of the magnitude, causes, and intervention strategies. Epilepsia. 2008;49:1491–503. doi: 10.1111/j.1528-1167.2008.01693.x. [DOI] [PMC free article] [PubMed] [Google Scholar]
- 5.Tomson T, Nashef L, Ryvlin P. Sudden unexpected death in epilepsy: current knowledge and future directions. Lancet neurology. 2008;7(11):1021–31. doi: 10.1016/S1474-4422(08)70202-3. [DOI] [PubMed] [Google Scholar]
- 6.http://emedicine.medscape.com/article/1187111-overview
- 7.Winawer Melodie R. Phenotype definition in epilepsy. Epilepsy & Behavior. 2006;8(3):462–476. doi: 10.1016/j.yebeh.2006.01.012. [DOI] [PubMed] [Google Scholar]
- 8.Lüders HO, Amina S, Baumgartner C, et al. Modern technology calls for a modern approach to classification of epileptic seizures and the epilepsies. Epilepsia. 2012;53(3):405–411. doi: 10.1111/j.1528-1167.2011.03376.x. [DOI] [PubMed] [Google Scholar]
- 9. [accessed January 7, 2014];Exploratory Grant Program in Sudden Unexpected Death in Epilepsy (SUDEP) (P20) http://grants.nih.gov/grants/guide/rfa-files/RFA-NS-11-006.html.
- 10.Sahoo SS, Lhatoo SD, Gupta DK, et al. Epilepsy and Seizure Ontology: Towards an Epilepsy Informatics Infrastructure for Clinical Research and Patient Care. J Am Med Inform Assoc. 2014;21(1):82–9. doi: 10.1136/amiajnl-2013-001696. [DOI] [PMC free article] [PubMed] [Google Scholar]
- 11.Aronson AR. Effective mapping of biomedical text to the UMLS Metathesaurus: the MetaMap program. AMIA Annual Symposium Proceedings. 2001:17–21. [PMC free article] [PubMed] [Google Scholar]
- 12.Aronson AR, Lang FM. An overview of MetaMap: historical perspective and recent advances. Journal of the American Medical Informatics Association. 2010;17(3):229–236. doi: 10.1136/jamia.2009.002733. [DOI] [PMC free article] [PubMed] [Google Scholar]
- 13.Savova GK, Masanz JJ, Ogren PV, et al. Mayo clinical Text Analysis and Knowledge Extraction System (cTAKES): architecture, component evaluation and applications. J Am Med Inform Assoc. 2010;17(5):507–513. doi: 10.1136/jamia.2009.001560. [DOI] [PMC free article] [PubMed] [Google Scholar]
- 14.Cui L, Bozorgi A, Lhatoo SD, et al. EpiDEA: Extracting Structured Epilepsy and Seizure Information from Patient Discharge Summaries for Cohort Identification. AMIA Annual Symp Proc. 2012:1191–1200. [PMC free article] [PubMed] [Google Scholar]
- 15.Rindflesch TC, Fiszman M. The interaction of domain knowledge and linguistic structure in natural language processing: interpreting hypernymic propositions in biomedical text. J Biomed Infor. 2003;36:462–77. doi: 10.1016/j.jbi.2003.11.003. [DOI] [PubMed] [Google Scholar]
- 16.Ahlers CB, Fiszman M, Demner-Fushman D, et al. Extracting semantic predication from MEDLINE citations for pharmacogenomics. Pacific Symposium on Biocomputing. 2007:209–220. [PubMed] [Google Scholar]
- 17.Friedman C, Alderson PO, Austin JH, et al. A general natural-language text processor for clinical radiology. Journal of the American Medical Informatics Association. 1994;1(2):161–174. doi: 10.1136/jamia.1994.95236146. [DOI] [PMC free article] [PubMed] [Google Scholar]
- 18.Sevenster M, van Ommering R, Qian Y. Automatically correlating clinical findings and body locations in radiology reports using MedLEE. Journal of Digital Imaging. 2012;25(2):240–249. doi: 10.1007/s10278-011-9411-0. [DOI] [PMC free article] [PubMed] [Google Scholar]
- 19.Roberts K, Rink B, Harabagiu SM, et al. A Machine Learning Approach for Identifying Anatomical Locations of Actionable Findings in Radiology Reports. AMIA Annual Symposium Proceedings. 2012:779–788. [PMC free article] [PubMed] [Google Scholar]
- 20. [accessed April 1, 2013];Apache Tika. http://tika.apache.org/
- 21.Jaro MA. Probabilistic linkage of large public health data files. Statistics in Medicine. 1995;14:491–498. doi: 10.1002/sim.4780140510. [DOI] [PubMed] [Google Scholar]
- 22.Zhang GQ, Siegler T, Saxman P, Sandberg N, Mueller R, Johnson N, et al. VISAGE: A Query Interface for Clinical Research. Proc AMIA CRI. 2010:76–80. [PMC free article] [PubMed] [Google Scholar]
- 23.Zhang GQ, Cui L, Teagno J, Kaebler D, Koroukian S, Xu R. Merging ontology navigation with query construction for web-based Medicare data exploration. AMIA Summit on Clinical Research Informatics (CRI) 2013:285–289. [PMC free article] [PubMed] [Google Scholar]
- 24.Cui L, Mueller R, Sahoo S, Zhang GQ. Querying Complex Federated Clinical Data Using Ontological Mapping and Subsumption Reasoning; 2013; IEEE International Conference on Healthcare Informatics (ICHI); pp. 351–360. [Google Scholar]
- 25.Tsoumakas G, Ioannis K. Multi-label classification: An overview. International Journal of Data Warehousing and Mining (IJDWM) 2007;3(3):1–13. [Google Scholar]
- 26.Tsoumakas G, Ioannis K, Ioannis V. Data mining and knowledge discovery handbook. Springer; US: 2010. Mining multi-label data; pp. 667–685. [Google Scholar]