

Abstract
Breast cancer and its treatments are associated with mild cognitive impairment and brain changes that could indicate an altered or accelerated brain aging process. We applied diffusion tensor imaging (DTI) and graph theory to measure white matter organization and connectivity in 34 breast cancer survivors compared to 36 matched healthy female controls. We also investigated how brain networks (connectomes) in each group responded to simulated neurodegeneration based on network attack analysis. Compared to controls, the breast cancer group demonstrated significantly lower fractional anisotropy (FA), altered small-world connectome properties, lower brain network tolerance to systematic region (node) and connection (edge) attacks and significant cognitive impairment. Lower tolerance to network attack was associated with cognitive impairment in the breast cancer group. These findings provide further evidence of diffuse white matter pathology following breast cancer and extend the literature in this area with unique data demonstrating increased vulnerability of the post-breast cancer brain network to future neurodegenerative processes.
Keywords: breast cancer; DTI; graph theory; brain network, connectome, network attack, neurodegeneration
1. Introduction
Cancer is a common, age-related disease with approximately 1 in 2 adults being diagnosed during their lifetime at a median age of 66 years (Howlader, et al., 2013). Advances in cancer treatments have resulted in significantly improved survival rates but are often associated with side effects, such as cognitive decline, that may reduce quality of life. Although most cancer diagnoses originate outside the central nervous system (CNS), cognitive decline affects an estimated 19-78% of these patients (Wefel and Schagen, 2012). Neuroimaging studies suggest that this cognitive impairment stems from subtle but diffuse brain injury (Chao, et al., 2012; D'Agata, et al., 2013; Hsieh, et al., 2014; Koppelmans, et al., 2014) [see reviews by: (de Ruiter and Schagen, 2013; McDonald and Saykin, 2013; Scherling and Smith, 2013)].
Many of the candidate mechanisms for brain injury following non-CNS cancer include oxidative stress, DNA damage and inflammation and these factors overlap significantly with those involved in aging (Mandelblatt, et al., 2013). Accordingly, older patients with breast cancer tend to have poorer cognitive outcome (Ahles, et al., 2010). Cognitive impairments following breast cancer and its treatments may worsen over time (Wefel, et al., 2010) indicating a persistent or even progressive phenotype. Therefore, cancer and/or its therapies have been theorized to possibly alter or accelerate age-related neurodegeneration (Ahles, 2012; Kesler, 2014; Koppelmans, et al., 2013; Mandelblatt, et al., 2013).
Emerging evidence provides support for altered or accelerated neurodegeneration following breast cancer and its treatments, which has become an initial model for examining cognitive effects of adult onset, non-CNS cancer. Koppelmans, et al. (2012) measured gray matter volumes in a large sample of breast cancer survivors who had been off-treatment for 21 years, on average. They demonstrated significant global gray matter atrophy in the breast cancer survivors compared to healthy controls, analogous to approximately 4 years of brain aging. Sanoff, et al. (2014) measured expression of cyclin-dependent kinase inhibitor 2A proteins (p16INK4a and ARF), markers of molecular aging, in patients with breast cancer before and after treatment as well as in survivors who were 3 years off-therapy, on average. Both longitudinal and cross-sectional analyses indicated significant p16INK4a and ARF elevation. Increase in p16INK4a among the survivor cohort was comparable to approximately 10 years of chronological aging.
We aimed to extend this literature by evaluating the brain network's response to simulated neurodegeneration using graph theory analysis and diffusion tensor imaging (DTI). DTI is a non-invasive neuroimaging method for evaluating the organization of white matter. It relies on the detection and quantification of anisotropic Brownian motion of water molecules along nerve fibers. The diffusion tensor is a model of this water displacement and the tensor eigenvalues provide an estimation of the diffusion shape and magnitude, including a single fiber orientation estimate per voxel (O'Donnell and Westin, 2011). These data can be used to measure scalar metrics, such as fractional anisotropy (FA), that provide insights regarding tissue organization. Tensor data is also used for tractography - the mapping of virtual fiber trajectories, or “streamlines” (Jones, et al., 2013; Mukherjee, et al., 2008). DTI measurements show strong correspondence with post-mortem dissection (Lawes, et al., 2008) however; DTI should be considered only a very indirect assessment of white matter organization (Jones, et al., 2013). Despite its limitations, DTI-based measures have been shown to be sensitive to various brain pathologies, including breast cancer-related cognitive impairment (Deprez, et al., 2013).
Graph theory is the mathematical study of graphs that model objects (“nodes”) and their connections (“edges”). It has been increasingly applied to the study of brain connectivity where nodes represent brain regions and edges represent structural or functional connections between regions. Evaluations of network topology using graph theory have distinct advantages over traditional univariate approaches (e.g. voxelwise FA, fMRI) by providing multivariate measures across various spatial and temporal scales (Feldt, et al., 2011). Network topology properties therefore better represent the covarying and multi-scale neurobiologic interactions that support cognition. Graph theory studies have demonstrated that brain networks, or “connectomes”, show a “small-world” organization characterized by high local clustering of nodes and minimal path length between nodes (Bassett and Bullmore, 2006). Specifically, the connectome is organized in such a manner that most regions are connected to their neighbors (high clustering) and can be reached by every other region via a small number of steps (low path length). Efficient information processing is assumed to following the shortest paths between nodes. This organization putatively allows the brain to balance the opposing demands of segregation and integration, providing high capacity for parallel information processing with minimal wiring cost (Bassett and Bullmore, 2006). We have previously demonstrated altered organization of gray matter structural and intrinsic functional connectomes in breast cancer survivors (Bruno, et al., 2012; Hosseini, et al., 2012b). For the present study, we expand upon these findings by using DTI-based connectome graphs to evaluate the brain network's tolerance to simulated neurodegeneration.
Simulation of neurodegeneration was accomplished using network attack analysis. Like other complex biologic networks, the specific topology of the brain network appears to follow a power-law distribution (Achard, et al., 2006) meaning that the majority of information processing is handled by a small number of core regions. This organization makes the network surprisingly resilient to random errors but highly vulnerable to targeted attack. Accordingly, neurodegenerative processes tend to most closely resemble targeted attacks (Achard, et al., 2006; Albert, et al., 2000; Crossley, et al., 2014). In the context of graph theory analysis, targeted attacks involve systematic removal of vital nodes/edges, based on some criteria for defining node/edge importance. The impact of each attack is evaluated by measuring one or more characteristic of the global and/or local brain network organization (Albert, et al., 2000; Alstott, et al., 2009). The impact measure thus provides an indication of the network's attack tolerance.
Both normal and pathologic age-related changes in brain network graphs include alterations of various global and local network properties corresponding to disruption of both nodes and edges (Sun, et al., 2012; Tijms, et al., 2013). Therefore we conducted two different targeted attacks, one on nodes and one on edges. Targeted node attack involves systematic removal of highly central nodes, consistent with previous studies of age-related neurodegeneration (Crossley, et al., 2014; He, et al., 2008; Stam, et al., 2009). Highly central, “hub” regions participate in a large number of functional interactions and therefore have high metabolic demands (Lord, et al., 2013). These high energy requirements make these regions more vulnerable to age-related reduction of physiologic resources as well as a variety of neuropathologic processes (Crossley, et al., 2014; Kesler, 2014). We have previously demonstrated that hub regions are vulnerable to breast cancer and its treatments (Hosseini and Kesler, 2013).
We also included a targeted attack on edges based on previous studies demonstrating diffuse disconnectivity and continuous white matter loss associated with normal and pathologic aging (Sachdev, et al., 2013; Wu, et al., 2011; Wu, et al., 2013). Additionally, DTI studies have demonstrated widespread alterations of white matter organization following breast cancer and its treatments that persist in very long-term survivors (de Ruiter, et al., 2012; Deprez, et al., 2012; Deprez, et al., 2011).
In terms of measuring the brain network's tolerance to attacks, we examined both global and local efficiency to represent network integration and segregation, respectively. Although metrics such as path length and clustering coefficient have been commonly used in general connectome studies, measures of efficiency are considered more directly related to error tolerance, more biologically relevant because they describe information flow and are less sensitive to disconnected and weakly connected nodes (Latora and Marchiori, 2001). The latter property is important in this case given that DTI connectomes tend to be relatively sparse (Bassett, et al., 2011) and also because networks will naturally become increasingly sparse across attack iterations.
Global efficiency is the inverse of the average shortest path between nodes and is high when nodes are able to interact directly. It is thus an indicator of the network's functional integration and capacity for parallel information processing (Latora and Marchiori, 2001). Previous studies have shown decreases in global efficiency with brain aging (Sun, et al., 2012; Tijms, et al., 2013; Wu, et al., 2011; Wu, et al., 2013). Global efficiency is one of the most commonly used measures of network response to targeted attack, including studies of normal and pathologic aging (Crossley, et al., 2014; Crucitti, et al., 2003; Joyce, et al., 2013; Rubinov, et al., 2009; Santarnecchi, et al., 2014). Importantly, global efficiency is associated with increased cognitive reserve in healthy adults (Fischer, et al., 2014; Santarnecchi, et al., 2014). Cognitive reserve refers to the brain's resilience to the clinical effects of aging, injury and disease (Stern, 2012) and has been shown to moderate the cognitive effects of breast cancer (Ahles, et al., 2010; Kesler, et al., 2011).
Local efficiency is the inverse of the average shortest path connecting all neighbors of a node, or in other words, the average efficiency of the local subgraphs or neighborhoods (Latora and Marchiori, 2001). It is a measure of local processing among adjacent nodes and therefore an indication of network segregation. Previous studies also demonstrate reduced local efficiency associated with normal and pathologic aging (Achard and Bullmore, 2007; Gong, et al., 2009; Sun, et al., 2012; Xiang, et al., 2013). Like global efficiency, local efficiency is a common measure of the brain network's response to computational attack (Joyce, et al., 2013; Santarnecchi, et al., 2014).
2. Materials and Methods
2.1 Participants
This study included 36 women age 44-73 years with a history of primary breast cancer (stage I-IIIA) who had completed their primary treatment (surgery, chemotherapy and breast radiation therapy) more than 6 months (mean = 5.8 +/- 3.9 years; range = 0.5-14 years) prior to study entry and were currently without evidence of active cancer. They were compared with 36 healthy female controls. Some of the breast cancer (N = 14) and control (N = 17) participants were included in our previous studies demonstrating altered structural and functional connectomes (Bruno, et al., 2012; Hosseini, et al., 2012b). The cohort previously described was acquired during 2008-2012 and the data added here during 2013-2014, all at the same laboratory. Everyone for whom DTI was collected was included in this study. Participants in both groups were recruited using email listserv, internet, community flyer postings and local cancer support group advertisements.
All women in the breast cancer group underwent surgery with general anesthesia and received adjuvant chemotherapy as part of their treatment regimen. Additionally, 80% of them received loco-regional breast radiation and 60% received endocrine therapy (tamoxifen). Five women were still taking tamoxifen when studied. As shown in Table 1, there were no significant differences between the two groups in terms of age, educational level or minority status. There were significantly more women in the breast cancer group who were postmenopausal compared to the healthy control group, which was expected given that treatments can induce early menopause (Mar Fan, et al., 2010).
Table 1.
Demographic and medical data shown as mean (standard deviation) unless otherwise noted.
| Breast cancer N = 34 | Healthy controls N = 36 | Stat | p | |
|---|---|---|---|---|
| Age | 56.9 (7.6) | 56.9 (8.2) | 0.045 | 0.964 |
| Age range | 43.8-72.7 | 42.8-73.4 | ||
| Education (years) | 17.1 (2.5) | 16.3 (2.4) | 1.28 | 0.215 |
| Education range | 12-23 | 12-20 | ||
| Minority status | 9% | 17% | 1.05 | 0.305 |
| Postmenopausal | 91% | 76% | 23.4 | <0.0001 |
| Time off-therapy* (years) | 5.9 (3.7) | |||
| Loco-regional breast radiation therapy | 80% | |||
| Tamoxifen | 60% | |||
| Disease stage at diagnosis I, II, III | 20%, 46%, 34% |
Time since completion of chemotherapy and loco-regional breast radiation treatments
Individual treatment protocols included doxorubicin/cyclophosphamide/paclitaxel = 25, cyclophosphamide/methotrexate/fluorouracil = 3 and cyclophosphamide/paclitaxel = 5 and cyclophosphamide/docetaxel/fluorouracil = 3. Breast cancer survivors were excluded for history of relapse or prior anti-cancer treatment. All participants were excluded for diagnosed psychiatric, neurologic or comorbid medical conditions that are known to affect cognitive function as well as pregnancy, MRI contraindications or major sensory deficits (e.g. blindness). Participants were also excluded for significant (T > 69) Clinical Assessment of Depression score (Aghakhani and Chan, 2007). The Stanford University Institutional Review Board approved the present study. All participants provided written informed consent.
2.2 Neuroimaging Acquisitions and Preprocessing
As detailed in Supplementary Methods, DTI and T1-weighted scans were acquired for all participants. DTI data were visually inspected for quality and the data of one participant in the breast cancer was excluded from all further analyses due to excessive artifact. DTI volumes were corrected for eddy current distortion and tensor reconstruction was performed using the linear least-squares fitting method in FSL v4.0 (Smith, et al., 2004). A binary brain mask of the B0 image was created using FSL BET and applied to corrected DTI volumes to constrain tensor fitting and tractography to brain tissue. Deterministic tractography was performed in TrackVis v0.5.2.2 (Feigl, et al., 2014; Wang, et al., 2007) using the fiber assignment by continuous tracking (FACT) algorithm (Mori and van Zijl, 2002). This method involves the placement of a single seed in the center of each voxel continuing the path in the adjacent voxel such that path curvature is minimized. We employed a curvature threshold of 60° consistent with previous studies (Fischer, et al., 2014; Lo, et al., 2010). Streamlines were smoothed using a spline filter (Brown, et al., 2011; Rudie, et al., 2012). Brain volumes were extracted from T1 images using SIENAX in FSL (Smith, et al., 2002). These data were used only to correct certain analyses for individual differences in brain size.
2.3 Structural Brain Network Construction and Measurement
We obtained 90 cortical and subcortical regions of interest (ROIs) in Montreal Neurological Institute (MNI) space from the Automated Anatomical Labeling Atlas (Tzourio-Mazoyer, et al., 2002). Non-brain tissue was removed from the T1 anatomic and B0 volumes for each participant using FSL BET. Using FSL FLIRT, the brain extracted T1 volumes were first linearly co-registered to the brain extracted B0 volumes to create a T1 volume in DTI space. The co-registered T1 volume was then normalized to an MNI T1 template. The resulting inverse transformation was applied to the ROI images to warp the ROIs into DTI native space as described in previous studies (Bassett, et al., 2011; Chen, et al., 2013).
The number of DTI streamlines connecting each pair of ROIs as well as streamline length and average FA were determined using the UCLA Multimodal Connectivity Package (UMCP) v13 (https://github.com/jbrown81/umcp). Brain masked, native space FA maps were entered into UMCP for streamline FA measurement. A pair of regions was considered to be connected if one streamline endpoint terminated within one region and the other endpoint terminated within the other region. This resulted in a 90×90 connectivity matrix for each participant. A threshold of three streamlines was applied to minimize false positive connections. This threshold has been utilized and validated in several previous studies (Brown, et al., 2011; Fischer, et al., 2014; Li, et al., 2009; Lo, et al., 2010).
We weighted each valid edge using the product of the streamline number and FA divided by average ROI volume (Brown, et al., 2011; Chen, et al., 2013; Lo, et al., 2010). We then modeled the brain network for each participant as a system of nodes and edges representing regions and their connections, respectively, using Brain Connectivity Toolbox (Rubinov and Sporns, 2010), our Graph Analysis Toolbox v1.4.1 (GAT, https://sites.google.com/site/gat3362/) (Hosseini, et al., 2012a) and other in-house code implemented in Matlab v2014a (Mathworks, Inc, Natick, MA). Graphs were constructed with N = 90 nodes, network degree of E = number of edges and a network density of D = E/[(N × (N-1))/2] representing the fraction of present connections to all possible connections.
2.4 Small-worldness and Hub Profiles
Small-world organization of the DTI connectome for each group was evaluated as described in our previous publications (Bruno, et al., 2012; Hosseini, et al., 2012a; Hosseini, et al., 2012b). Briefly, small-worldness index was defined as [C/Crand]/[L/Lrand] where C = clustering coefficient and L = characteristic path length and Crand and Lrand are the mean clustering coefficient and characteristic path length of 20 random networks. Small-world characteristics were computed at minimum connection density (0.15) as well as across a range of densities (0.15-0.28) using the area under the curve (AUC) (Hosseini, et al., 2012a). A connectome was considered to be small-world when the small-worldness index at minimum density was greater than 1 (Humphries and Gurney, 2008). Hub structure was evaluated by defining a node as a hub if its degree was at least 1 standard deviation higher than the mean network degree (Sporns, et al., 2007). Minimum connection density for one participant in the breast cancer group could not be achieved and therefore this participant was excluded from the analyses leaving 34 total participants in this group.
2.5 Network Attack Analyses
2.5.1 Targeted Attack on A Priori Network Nodes
Nodes were removed in order of decreasing degree, a measure of the node's centrality in the network. Nodal degree is defined as the number of edges connected to a node and is therefore a straightforward, common measure of centrality that indicates how much a node is interacting with other nodes in the network (Rubinov and Sporns, 2010). Degree has been used in multiple previous studies to define nodes for targeted attack (Achard, et al., 2006; Crossley, et al., 2014; Mirzasoleiman and Jalili, 2011).
2.5.2 Targeted Attack on Network Edges
Edges were removed in order of decreasing edge betweenness centrality as in previous studies (Mirzasoleiman and Jalili, 2011). Edge betweenness centrality is the fraction of shortest paths in a network that contain a particular edge. This centrality measure indicates the edge's contribution to the interactions between the nodes of the network (Brandes, 2001; Girvan and Newman, 2002).
2.5.3 Random Failure Attacks
As noted above, the brain network has previously been shown to be more resilient to random failure compared with targeted attack. Therefore, we also included random node and edge failure analyses for comparison. These analyses involved random removal of a node or edge with 1000 permutations as described in previous studies (Crossley, et al., 2014; Crucitti, et al., 2003; Hosseini, et al., 2012a).
2.5.4 Tolerance to Network Attacks
For each of the attack strategies described above, the brain network's attack tolerance was evaluated by measuring global and local efficiency following each node/edge removal. AUC was computed for efficiency curves across attacks for each participant. Thus, the attack AUC provides a measure of how quickly the network efficiencies declined across the attacks. An illustrative summary of the brain network attack analysis is presented in Figure 1.
Figure 1. Analysis Summary.
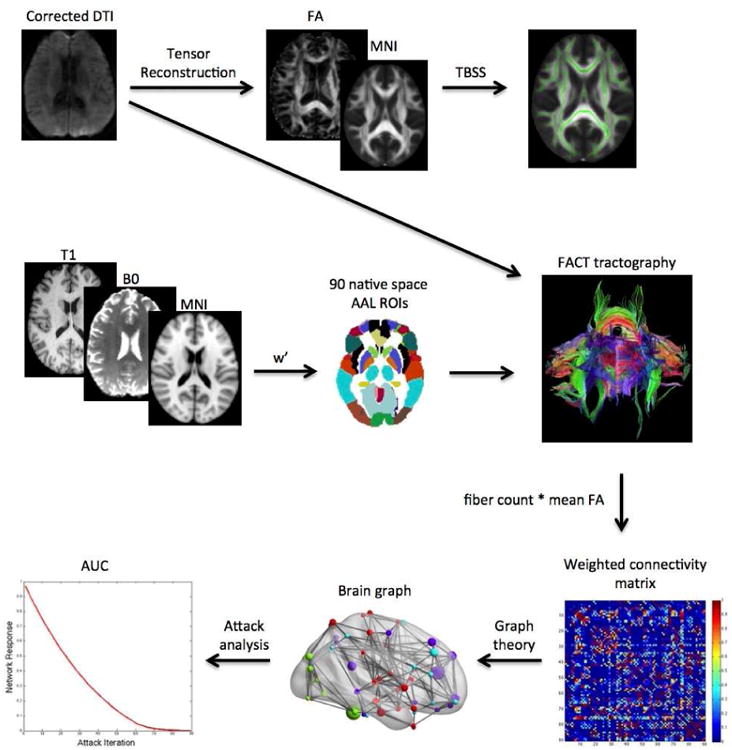
Diffusion tensor imaging (DTI) volumes were first corrected for eddy current distortion. Tensor reconstruction was performed using the linear least-squares fitting method. Resultant fractional anisotropy (FA) maps were nonlinearly registered to a standard space FA template and then tract-based spatial statistics (TBSS) were conducted to determine voxel-wise differences in FA between groups. Deterministic tractography was performed using fiber assignment by continuous tracking. Regions of interest (ROIs) were transformed into DTI native space by first coregistering the T1 volume to the B0 volume. The coregistered T1 was then normalized to a standard space anatomic template and the inverse warp of this transformation (w′) was applied to the ROI images. The number of virtual fibers, or “streamlines”, connecting each pair of ROIs was determined resulting in a 90×90 weighted connectivity matrix for each participant. Graph theory analyses were applied to the weighted matrices to construct brain graphs for each participant consisting of nodes (regions) and edges (connections). Attack analyses involving targeted or random removal of nodes or edges were conducted to simulate a neurodegenerative process. The brain network's response to these attacks was measured using global and local efficiency. The area under the curve (AUC) for each of these response metrics was compared between groups.
2.6 Cognitive Status
Trained research staff administered the following standardized neuropsychological tests to all participants on the same day as the neuroimaging session: Wisconsin Card Sorting Test (WCST) 64 Computer Version (Heaton, 2004), Delis-Kaplan Executive Function System Letter Fluency (Homack, et al., 2005), Wechsler Adult Intelligence Scale 4th Edition Matrix Reasoning, Symbol Search (Wechsler, 2008) and Hopkins Verbal Learning Test-Revised (Total Recall and Delayed Recall) (Benedict, et al., 1998). We also administered domain-specific self-report measures including the Multifactorial Memory Questionnaire Ability Scale (MMQ-A) (Troyer and Rich, 2002) and the Behavioral Rating Inventory of Executive Function (BRIEF) (Roth, et al., 2005). Testing required approximately 1.5 hours. We used only the Total score from the WCST and the Global Executive Composite score from the BRIEF.
Raw test scores were converted to standard scores based on each test's education and/or age normative data using test-specific scoring software provided by the test publishers. All standard scores were converted to T scores for a consistent scale [mean of 50 and standard deviation (SD) of 10]. Additionally, z scores (mean = 0, SD = 1) for each cognitive test (excluding self-report measures) for each participant were computed based on the mean and SD for the control group [(score-mean)/SD]. A participant was rated as having impaired cognitive function if two or more tests had a z score at or below -1.5 and/or one test had a z score at or below -2.0 (Wefel, et al., 2011).
2.7 Cognitive Reserve
Education level in years was used as a proxy of cognitive reserve as in previous studies (Stern, 2013; Tucker and Stern, 2011).
2.8 Statistical Analyses
2.8.1 Fractional Anisotropy (FA)
As detailed in Supplementary Methods, whole-brain, voxelwise statistical analysis of FA data was carried out using FSL's Tract-Based Spatial Statistics [TBSS, (Smith, et al., 2006)] with a threshold of p < 0.01, family-wise error corrected.
2.8.2 Tract Characteristics
Group differences in streamline number, length and mean FA were compared using analysis of variance (ANOVA). Total brain volume was used as a covariate in the streamline number and length models. Model p values were adjusted for multiple comparisons using false discovery rate (FDR).
2.8.3 Small-worldness and Hub Profiles
We evaluated between group differences in clustering coefficient, path length and small-worldness index using ANOVA with FDR correction. Hub profiles for each group are presented descriptively and visually using Brain Net Viewer (Xia, et al., 2013). Additionally, we computed an R2 for each group to describe the fit of the cumulative degree distribution with the power-law (Supplementary Methods), where R2 values close to 1 represent a strong fit (Hosseini, et al., 2012a). Fisher's r to z transformation was used to determine if there was any significant difference in these values between groups.
2.8.4 Tolerance to Network Attack
Between group differences in global and local efficiency AUCs for each attack strategy were determined using ANOVA with FDR correction. Since the measurement of attack tolerance begins following attack 1, global and local efficiency at minimum density were considered the “baseline” (attack zero) efficiencies. Differences in these measures between groups were computed using ANOVA. Effect sizes were calculated using Cohen's d (Cohen, 1998).
2.8.5 Cognitive Status
Between group differences in cognitive test scores were evaluated using ANOVA. The number of impaired participants was compared between groups using Chi squared analysis. All p values were FDR corrected. Effect sizes were calculated using Cohen's d.
2.8.6 Predictors of Brain Network Tolerance to Attack
The effects of age, cognitive reserve (education level) and small-worldness index on network attack AUCs were explored in each group separately using two-tailed Pearson correlations (p < 0.05, uncorrected). Only small-worldness index was evaluated given that it is a summary measure that includes both clustering coefficient and characteristic path length and was derived here from streamline FA and number.
Within the breast cancer group, a backward stepwise linear regression was performed with medical variables (menopausal status, radiation, tamoxifen, time off-therapy and disease stage) as predictors of network attack AUCs. The model with the highest adjusted R squared was considered the best fitting.
2.8.7 Predictors of Cognitive Impairment
For the breast cancer group only, the effects of age, education, small-worldness index and significant network attack AUCs on cognitive impairment (1 = impaired, 0 = not impaired) were explored using two-tailed Spearman rank correlations (p < 0.05, uncorrected). Additionally, medical variables were examined using a backward conditional logistic regression.
Differences in correlation coefficients between groups were evaluated for significance using Fisher's r to z transformation.
3. Results
3.1 Fractional Anisotropy
As shown in Figure 2, the breast cancer group demonstrated significantly lower FA (p < 0.01, corrected) compared to controls in multiple regions throughout the brain. Peak voxel locations (Table 2) included left corpus callosum, bilateral inferior longitudinal fasciculus and left inferior fronto-occipital fasciculus. Significant differences also included bilateral temporal and frontal lobe white matter.
Figure 2. Whole-brain Fractional Anisotropy (FA).
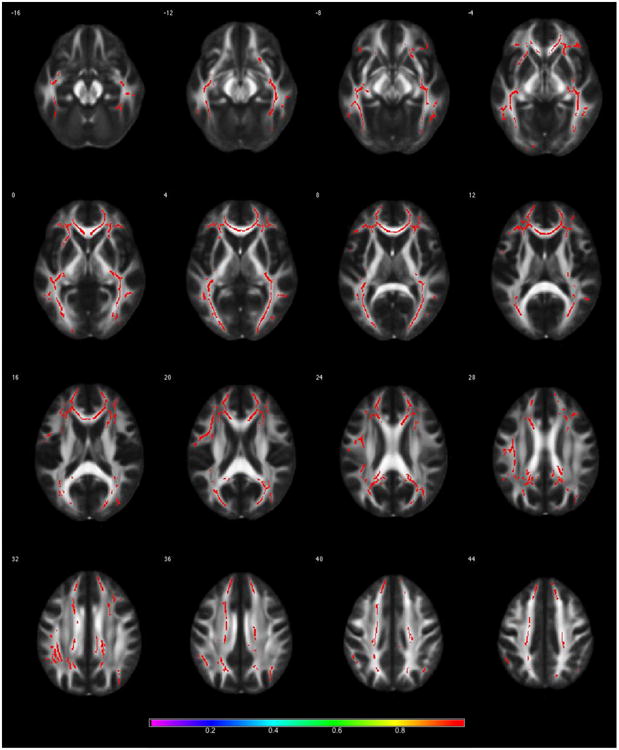
Results from Tract-based Spatial Statistics analysis demonstrating significantly lower FA in the breast cancer group compared to controls (p < 0.01, corrected). Color bar shows 1-p value.
Table 2. Fractional anisotropy data for peak voxels.
| No. of Voxels | p (FWE corrected) | X | Y | Z | Label |
|---|---|---|---|---|---|
| Controls > Breast Cancer | |||||
| 9594 | 0.002 | -7 | 26 | -3 | left genu of corpus callosum |
| 6079 | 0.008 | -26 | 12 | -10 | left inferior fronto-occipital fasciculus |
| 5601 | 0.006 | 41 | -16 | -14 | left inferior longitudinal fasciculus |
| 226 | 0.01 | 40 | -45 | -8 | right inferior longitudinal fasciculus |
| Breast Cancer > Controls | |||||
| None | |||||
Coordinates are shown in MNI space
Tract Characteristics
The breast cancer group showed a significantly greater number of streamlines compared to controls (p = 0.002, corrected) but these streamlines were shorter (p = 0.015, corrected) and had lower mean FA (p = 0.003, corrected, Table 3).
Table 3.
DTI tractography, connectome and attack data shown as mean (standard deviation).
| Breast cancer N = 34 | Healthy controls N = 36 | F | p (FDR corrected) | d | |
|---|---|---|---|---|---|
| Streamline number | 22.85 (3.3) | 21.04 (2.5) | 12.97 | 0.002 | 0.62 |
| Streamline length (mm) | 17.08 (3.1) | 18.38 (2.5) | 6.24 | 0.015 | 0.46 |
| Streamline mean FA | 0.078 (0.01) | 0.084 (0.01) | 12.87 | 0.003 | 0.60 |
| Clustering coefficient* | 2.65 (0.17) | 2.56 (0.12) | 6.14 | 0.025 | 0.62 |
| Characteristic path length* | 1.14 (0.01) | 1.13 (0.02) | 6.03 | 0.025 | 0.62 |
| Small-worldness index* | 2.32 (0.15) | 2.26 (0.10) | 4.19 | 0.045 | 0.47 |
| Global efficiency* | 0.509 (0.004) | 0.510 (0.004) | 1.48 | 0.229 | 0.25 |
| Local efficiency* | 0.764 (0.007) | 0.760 (0.010) | 3.51 | 0.130 | 0.46 |
| Targeted Attacks AUCs | |||||
| Node attack global efficiency | 23.32 (0.55) | 23.62 (0.61) | 4.77 | 0.043 | 0.52 |
| Node attack local efficiency | 36.81 (1.4) | 37.19 (1.5) | 1.24 | 0.27 | 0.26 |
| Edge attack global efficiency | 26.67 (0.59) | 27.03 (0.65) | 5.74 | 0.043 | 0.58 |
| Edge attack local efficiency | 41.13 (1.3) | 41.82 (1.3) | 4.87 | 0.043 | 0.53 |
| Random Attacks AUCs | |||||
| Node attack global efficiency | 28.45 (0.04) | 28.45 (0.05) | 0.165 | 0.686 | 0.0 |
| Node attack local efficiency | 42.49 (0.18) | 42.46 (0.15) | 0.715 | 0.400 | 0.18 |
| Edge attack global efficiency | 65.68 (0.44) | 65.65 (0.48) | 0.078 | 0.781 | 0.07 |
| Edge attack local efficiency | 50.30 (0.63) | 50.18 (0.61) | 0.659 | 0.420 | 0.19 |
d = Cohen's d effect size
Values are a minimum connection density (0.15)
FA = fractional anisotropy
AUC = area under the curve
Small-worldness and Hub Profiles
Both groups demonstrated small-world brain network organization having mean small-world indices greater than 1 (Table 3, Figure 3). There were no individual participants in either group who demonstrated a small-worldness index less than 1. At minimum network connection density, the breast cancer group showed significantly greater clustering coefficient (p = 0.025, corrected), path length (p = 0.013, corrected) and small-worldness index (p = 0.045, corrected) compared to controls (Table 3). These results were confirmed by AUC analysis across network densities (p < 0.04, corrected). As shown in Figure 4, the two groups showed a similar profile of hubs although controls demonstrated additional hubs in bilateral precentral gyrus and bilateral fusiform compared to the breast cancer group. The degree distributions of both groups followed an exponentially truncated power-law distribution (Figure 4). The R2 value for the breast cancer group was 0.962 and was 0.960 for the control group (z = 0.1, p = 0.46).
Figure 3. Small-worldness.
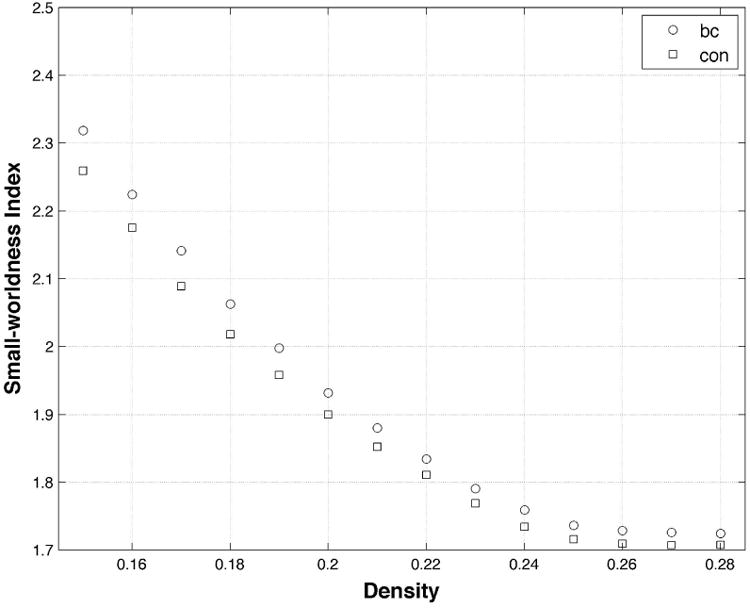
Both groups demonstrated a small-worldness brain network organization (i.e. small-worldness index > 1) across densities. The breast cancer (bc) group demonstrated significantly increased small-worldness index at minimum density (0.15) as well as across densities (p < 0.05, corrected) compared to controls (con).
Figure 4. Brain Graphs with Hub Profiles.
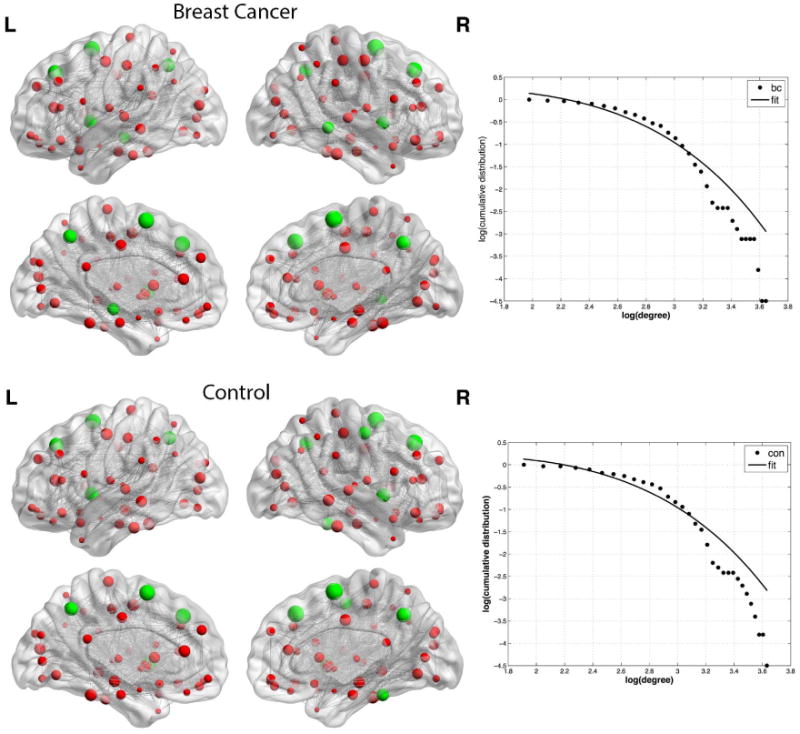
Spheres represent nodes with size indicating degree. Hub regions are colored green. Gray lines represent edges which are shown here unweighted for illustration purposes. The breast cancer group (bc) showed hubs in bilateral superior frontal gyrus, bilateral insula, bilateral precuneus, bilateral supplementary motor area and right middle temporal gyrus. Controls (con) also showed hubs in bilateral superior frontal gyrus, bilateral insula, bilateral precuneus and bilateral supplementary motor area as well as bilateral precentral gyrus and bilateral fusiform. The log-log plot of cumulative degree distributions is shown to the right of each brain graph. The solid line indicates the exponentially truncated power-law curve fitted to the cumulative degree distribution of the networks (dotted line).
3.2 Tolerance to Network Attack
As shown in Table 3, there were no significant differences in global or local efficiency prior to onset of attacks. However, attack AUCs (Table 3, Figure 5) were significantly lower in the breast cancer group corresponding to reduced tolerance to targeted attack on both nodes and edges compared to controls (p < 0.043, corrected). Tolerance to random attacks was not different between groups (p > 0.400).
Figure 5. Brain Network Attack Tolerance.
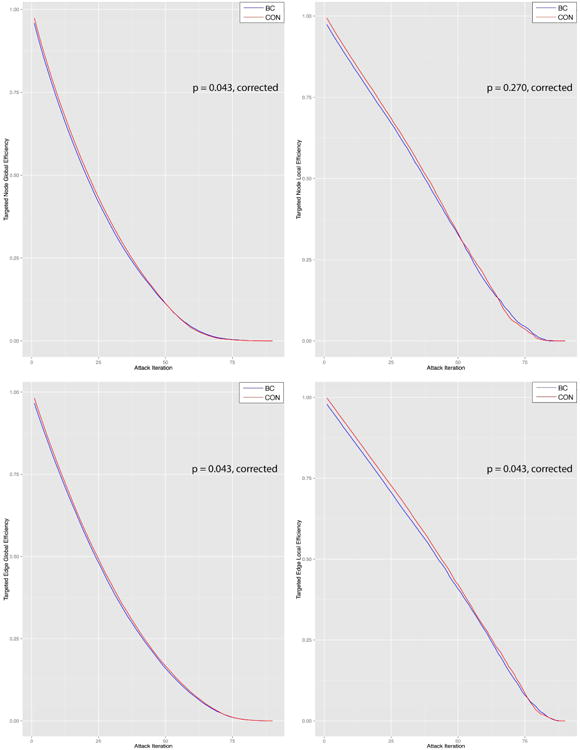
Compared to controls (con), the breast cancer group (bc) showed significantly lower tolerance to various targeted attacks on brain network nodes and edges as measured by both global and local efficiency. (A) Targeted node attack global efficiency, (B) targeted node attack local efficiency, (C) targeted edge attack global efficiency, (D) targeted edge attack local efficiency. Edge attacks were scaled to 1:90 to be more easily comparable visually with targeted attacks.
3.3 Cognitive Status
The breast cancer group demonstrated significantly reduced WCST, HVLT-R Total Recall and MMQ-A scores as well as significantly increased BRIEF scores compared to controls (Table 4). Higher BRIEF scores indicate elevated self-rated executive function difficulties. Cognitive impairment was significantly higher in the breast cancer group compared to controls (p = 0.005, corrected).
Table 4. Cognitive and self-report data shown as mean (standard deviation) unless otherwise indicated.
| Breast cancer N = 34 | Healthy controls N = 36 | F/Chi Sq. | p (FDR corrected) | d | |
|---|---|---|---|---|---|
| WCST Total | 46.52 (8.6) | 54.50 (8.2) | 13.32 | 0.003 | 0.95 |
| Letter Fluency | 56.96 (11.6) | 59.02 (11.4) | 0.360 | 0.689 | 0.18 |
| Matrix Reasoning | 57.11 (8.2) | 53.85 (11.7) | 1.30 | 0.371 | 0.32 |
| Symbol Search | 59.60 (9.8) | 60.13 (8.1) | 0.035 | 0.853 | 0.06 |
| HVLT-R Total Recall | 50.09 (7.1) | 54.97 (9.4) | 5.79 | 0.038 | 0.58 |
| HVLT-R Delayed Recall | 49.61 (7.9) | 53.63 (8.8) | 3.89 | 0.088 | 0.48 |
| Impaired* | N = 10 (29%) | N = 1 (3%) | 9.65 | 0.005 | 0.79 |
| BRIEF GEC** | 60.59 (12.7) | 45.41 (7.9) | 37.30 | < 0.0001 | 1.45 |
| MMQ-A | 45.61 (12.2) | 61.13 (7.0) | 22.29 | < 0.0001 | 1.58 |
| CAD** | 44.24 (6.4) | 45.13 (10.5) | 0.186 | 0.742 | 0.10 |
d: Cohen's d effect size
Impairment was defined as one or more test with a z score below -2.0 or two or more with a z score below -1.5.
Higher scores on the BRIEF or CAD indicate elevated symptoms, for all other cognitive measures, higher scores indicate better performance
WCST: Wisconsin Card Sorting Test, HVLT-R: Hopkins Verbal Learning Test Revised, BRIEF GEC: Behavioral Rating Inventory of Executive Function Global Executive Composite, MMQ-A: Multifactorial Memory Questionnaire Ability scale, CAD: Clinical Assessment of Depression
3.4 Predictors of Brain Network Tolerance to Attack
In the breast cancer group, small-worldness index was significantly positively correlated with targeted node global efficiency (p = 0.018, uncorrected). Attack tolerance was not associated with age, education or medical variables.
In the control group, small-worldness index was inversely correlated with targeted edge attack global efficiency AUC (p = 0.006, uncorrected). Education was inversely correlated with targeted edge attack local efficiency (p = 0.029, uncorrected). Age was not associated with attack tolerance.
The above correlations were significantly different between groups at p < 0.05, uncorrected.
3.5 Predictors of Cognitive Impairment
Lower global efficiency AUC following targeted nodal attack was associated with cognitive impairment in the breast cancer group (r = -0.605, p < 0.0001, uncorrected, Figure 6). Cognitive impairment was not associated with small-worldness index, age, education or medical variables.
Figure 6. Predictors of Cognitive Impairment.
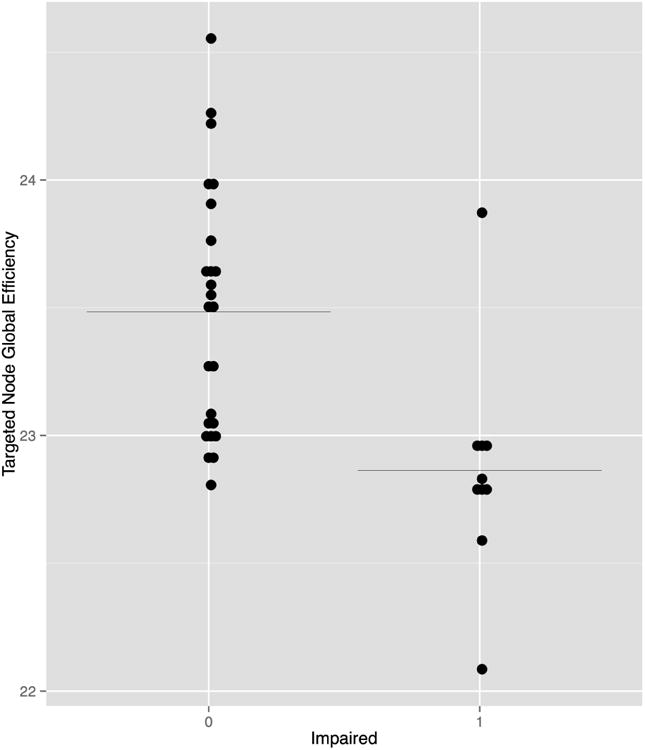
Cognitive impairment (0 = not impaired, 1 = impaired) in the breast cancer group was associated with global efficiency AUC following targeted node attack (r = -0.605, p < 0.0001, uncorrected). Black line indicates the mean.
4. Discussion
We examined brain network tolerance in chemotherapy treated breast cancer survivors in comparison with healthy controls using diffusion tensor imaging (DTI) and graph theory analyses. This approach allowed us to simulate the effects of neurodegeneration on brain network global and local efficiency, measures of the capacity for information processing. We demonstrated significantly reduced areas under the curve (AUC) following network attacks in the breast cancer group compared to controls. These findings indicate that the breast cancer group showed greater reduction of network efficiency in response to simulated neurodegeneration. Despite larger overall impact of the attacks on the breast cancer brain network, the shapes of the attack AUC curves were relatively similar for both groups suggesting a similar rate of decline. As Ahles (2012) recently explained, it is unknown whether age-related cognitive decline following cancer parallels that of individuals without history of cancer or whether decline is accelerated. Our findings provide support for a parallel rather than an accelerated decline.
Importantly, attack tolerance was reduced despite both groups demonstrating similar network efficiencies prior to attack onset. Following the very first attack, the two groups diverged with respect to attack tolerance with the breast cancer group requiring fewer number of attacks to reach zero efficiency compared to controls. Because attack targets were based on individual node/edge centrality distributions, the order of the nodes/edges removed across attacks was different for each participant. However, the profile of nodes that were high enough in degree to be classified as hubs was similar across the groups and the cumulative degree distributions did not differ between groups. Controls had some additional hubs compared to the breast cancer group that may have helped increase network attack tolerance. Although network attack tolerance was reduced in the breast cancer group across attacks, the attack AUCs inverted during the window of approximately 65-80 attack iterations (Figure 5). This was largely seen for local efficiency and may be related to the increased clustering noted in the breast cancer group.
Breast cancer survivors demonstrated significant cognitive impairment compared to controls and reduced tolerance to targeted node attack was associated with cognitive impairment. Cognitive deficits were most pronounced in executive function and verbal memory domains and these deficits were noted on both objective and subjective measures. However, cognitive function was preserved in the average breast cancer case, given that mean cognitive test scores were within the clinically normal range. This is consistent with the clinical presentation observed among breast cancer survivors wherein they tend to be able to complete various cognitive tasks but require more time, increased effort and/or different strategies than before (Kesler, et al., 2009; Von Ah, et al., 2013).
Consistent with previous studies (Albert, et al., 2000), brain networks in both groups were robust to random failures. Our findings also confirm prior studies showing preferential vulnerability of high degree nodes (hubs) to neuropathologic conditions (Crossley, et al., 2014). Targeted attack therefore warrants further evaluation as a useful representation of the neurodegenerative processes underlying breast cancer-related cognitive impairment. Future comparison of more sophisticated attack models could provide insight regarding specific mechanisms underlying brain network alterations following breast cancer. For example, it would be useful to know if inflammation more closely corresponds to a particularly network attack compared to chemotherapy or disease severity, for example.
Reduced brain network attack tolerance is consistent with lower cognitive reserve as well as the frail phenotype of aging, both significant predictors of cognitive decline (Mandelblatt, et al., 2013; Stern, 2012). We demonstrated that education, our cognitive reserve proxy, was inversely associated with local efficiency following network attack in controls. The surprisingly inverse direction of this correlation is a hallmark of cognitive reserve research and is interpreted to mean that, in individuals with higher cognitive reserve, greater neuropathology is required before clinical effects are manifest. Previous studies tend to show this inverse correlation only in disease groups while healthy individuals demonstrate a positive correlation between neurobiologic metrics and cognitive reserve proxies (Haut, et al., 2007; Kesler, et al., 2010; Sole-Padulles, et al., 2009). Our present findings are based on a simulated neuropathologic process being applied to both groups and therefore these results provide support for our network attack methods being accurate approximations of neurodegeneration. However, education was not associated with attack tolerance in the breast cancer group. This may partly relate to the difference in brain network topology between the groups. It is possible that there are one or more variables mediating this relationship in breast cancer such that the protectiveness of education on certain brain network characteristics is reduced. However, alternate proxies for cognitive reserve may be produce different results (Ahles, et al., 2010).
Unlike our prior studies of connectomes in breast cancer that demonstrated reduced small-world characteristics compared to controls, our present results indicate that small-worldness index was significantly increased in the breast cancer group. Our previous studies involved gray matter and resting state functional MRI connectomes that measure very different neurobiologic properties compared to DTI and are also associated with significantly different network densities. A recent review of connectome studies in Alzheimer's disease illustrates how structural and functional connectomes can produce opposite results with respect to small-world characteristics (Dai, et al., 2014). Importantly, studies that have compared multimodal connectome properties within the same samples show an inverse relationship between resting state functional MRI and DTI-based connectome properties (Caeyenberghs, et al., 2013; Rudie, et al., 2012). Further, the balance between functional and structural network characteristics appears to be associated with disease-related phenotype (Hawellek, et al., 2011; Rudie, et al., 2012) suggesting that this inverse association has biologic significance.
We found an increased number of streamlines in the breast cancer group compared to controls. These streamlines were shorter in length and had reduced mean FA compared to controls suggesting that they reflect brain network disconnectivity in breast cancer. This is consistent with our TBSS analysis showing widespread reduction in FA associated with breast cancer. There are several potential reasons for white matter vulnerability following breast cancer including toxicity of treatments to white matter progenitor cells (Dietrich, 2010) and toxicity of chronic inflammation to white matter myelin (Bettcher, et al., 2015).
The increased small-worldness in the breast cancer group was due to higher clustering as well as higher path length. Thus, lower white matter connectivity following breast cancer and its treatments may result in a re-organization of the large-scale brain network such that segregation (clustering) is increased while integration (path length) is reduced (greater path length = greater number of steps required to pass information to a neighboring region). This is consistent with the notion that white matter pathways support information transfer in the brain (Filley, 2010). This finding also provides insight regarding the neurobiologic mechanisms of breast cancer-related cognitive impairment as it is consistent with the clinical cognitive presentation observed among breast cancer survivors as described above. Specifically, these women are typically able to complete various cognitive tasks accurately (intact segregation) but require more time, increased effort and/or different strategies than before (impaired integration).
Based on previous studies as described above, a small-world network organization – in the typical case – is resilient to random failure but more vulnerable to targeted attack. Accordingly, we demonstrated that higher small-worldness was inversely correlated with targeted attack tolerance in healthy controls. However, higher small-worldness index was associated with increased targeted attack tolerance in the breast cancer group. Additionally, the breast cancer group showed slightly, though non-significantly, higher tolerance to random failure. Therefore, the alteration in small-worldness network organization following breast cancer could reflect a type of compensatory mechanism that strives to maintain overall network robustness at the expense of other network properties such as integration.
Cognition is negatively affected in the context of this altered network organization, although in some survivors more than others. We were unable to determine any specific host, medical or treatment predictors of these effects, likely due to our small, heterogeneous sample. Factors that we could not examine in the present study such as genotypic variations and/or specific treatment regimens, for example, may play important roles in brain network organization and attack tolerance based on previous studies (Ahles, et al., 2003; Small, et al., 2011; Stouten-Kemperman, et al., 2014). Further research in this area is required involving larger samples and longitudinal designs to determine the long-term impact of altered brain network organization and reduced network attack tolerance on cognitive outcome as well as individual factors that mediate or moderate these effects.
5. Conclusions
Our results provide further evidence that that breast cancer and/or its treatments are associated with lower white matter organization and connectivity. These effects were shown using convergent DTI measurements that assessed fractional anisotropy as well as tractography properties. Additionally, we demonstrated novel evidence that white matter disconnectivity alters the organization of the large-scale DTI white matter network such that segregation is increased but integration is lower compared to controls. This altered topology appears to make the brain network more vulnerable to targeted attack. The breast cancer group demonstrated significant cognitive impairment compared to controls and this impairment was associated with lower network attack tolerance. Lower brain resilience may help explain the new onset of previously non-existent cognitive impairment and progressive worsening of existing symptoms that have been noted in some breast cancer survivors (Wefel, et al., 2010).
Limitations of the current study include the cross-sectional design, restricted cognitive reserve measurement, heterogeneity of the breast cancer sample and lack of a non-chemotherapy treated comparison group with DTI data. As with other studies in the field of connectomics, different network construction approaches may yield different results, although it should be noted that global and local efficiency differences tend to be quite well preserved across divergent methods (Zhong, et al., 2015). Definitions of cognitive impairment in this field remain arbitrary and the definition used here has not been validated in terms of its accuracy, sensitivity or specificity. Our finding that impairment was correlated with global efficiency suggests this definition of impairment may have some biologic significance. However, correlational analyses were exploratory and uncorrected and results should therefore be considered preliminary. Despite the limitations, this study provides further evidence of brain injury following breast cancer and its treatments. The effects of this injury appear to extend several years beyond treatment completion and may increase the brain's vulnerability to the effects of aging, injury and disease. Additionally, this research further demonstrates the importance of the intersection between disease and neurobiologic status as well as the relevance of cognitive neuroscience for non-CNS medical conditions.
Supplementary Material
Highlights.
We constructed brain network models in breast cancer survivors and healthy females
Brain network models were subjected to simulated neurodegeneration
Breast cancer survivors showed reduced brain network tolerance to simulated neurodegeneration
Reduced brain network tolerance was associated with cognitive impairment in the breast cancer group
Acknowledgments
This research was supported by grants from the National Institutes of Health (1R01CA172145, 1DP2OD004445 and 1R01NR014195 to S.K.). The authors would like to thank Arvind Rao, PhD, Department of Bioinformatics and Computational Biology at University of Texas MD Anderson Cancer Center and Dalu Yang, BSE, Department of Electrical and Computer Engineering at Rice University for their assistance with random edge failure analyses.
Footnotes
Disclosure statement: The authors have no conflicts of interest.
Publisher's Disclaimer: This is a PDF file of an unedited manuscript that has been accepted for publication. As a service to our customers we are providing this early version of the manuscript. The manuscript will undergo copyediting, typesetting, and review of the resulting proof before it is published in its final citable form. Please note that during the production process errors may be discovered which could affect the content, and all legal disclaimers that apply to the journal pertain.
Contributor Information
Christa L. Watson, Email: christa.watson@ucsf.edu.
Douglas W. Blayney, Email: dblayney@stanford.edu.
References
- Achard S, Bullmore E. Efficiency and cost of economical brain functional networks. PLoS Computational Biology. 2007;3(2):e17. doi: 10.1371/journal.pcbi.0030017. [DOI] [PMC free article] [PubMed] [Google Scholar]
- Achard S, Salvador R, Whitcher B, Suckling J, Bullmore E. A resilient, low-frequency, small-world human brain functional network with highly connected association cortical hubs. J Neurosci. 2006;26(1):63–72. doi: 10.1523/JNEUROSCI.3874-05.2006. [DOI] [PMC free article] [PubMed] [Google Scholar]
- Aghakhani A, Chan EK. Test Reviews: Bracken, B. A., & Howell, K. (2004). Clinical Assessment of Depression. Odessa, FL: Psychological Assessment Resources. Journal of Psychoeducational Assessment. 2007;25(4):416–22. [Google Scholar]
- Ahles TA. Brain vulnerability to chemotherapy toxicities. Psychooncology. 2012;21(11):1141–8. doi: 10.1002/pon.3196. [DOI] [PMC free article] [PubMed] [Google Scholar]
- Ahles TA, Saykin AJ, McDonald BC, Li Y, Furstenberg CT, Hanscom BS, Mulrooney TJ, Schwartz GN, Kaufman PA. Longitudinal Assessment of Cognitive Changes Associated With Adjuvant Treatment for Breast Cancer: Impact of Age and Cognitive Reserve. Journal of Clinical Oncology. 2010;28(29):4434–40. doi: 10.1200/JCO.2009.27.0827. [DOI] [PMC free article] [PubMed] [Google Scholar]
- Ahles TA, Saykin AJ, Noll WW, Furstenberg CT, Guerin S, Cole B, Mott LA. The relationship of APOE genotype to neuropsychological performance in long-term cancer survivors treated with standard dose chemotherapy. Psycho-oncology. 2003;12(6):612–9. doi: 10.1002/pon.742. [DOI] [PubMed] [Google Scholar]
- Albert R, Jeong H, Barabasi AL. Error and attack tolerance of complex networks. Nature. 2000;406(6794):378–82. doi: 10.1038/35019019. [DOI] [PubMed] [Google Scholar]
- Alstott J, Breakspear M, Hagmann P, Cammoun L, Sporns O. Modeling the impact of lesions in the human brain. PLoS Comput Biol. 2009;5(6):e1000408. doi: 10.1371/journal.pcbi.1000408. [DOI] [PMC free article] [PubMed] [Google Scholar]
- Bassett DS, Brown JA, Deshpande V, Carlson JM, Grafton ST. Conserved and variable architecture of human white matter connectivity. NeuroImage. 2011;54(2):1262–79. doi: 10.1016/j.neuroimage.2010.09.006. [DOI] [PubMed] [Google Scholar]
- Bassett DS, Bullmore E. Small-world brain networks. The neuroscientist. 2006;12(6):512–23. doi: 10.1177/1073858406293182. [DOI] [PubMed] [Google Scholar]
- Benedict RHB, Schretlen D, Groninger L, Brandt J. Hopkins Verbal Learning Test – Revised: Normative Data and Analysis of Inter-Form and Test-Retest Reliability. The Clinical Neuropsychologist. 1998;12(1):43–55. [Google Scholar]
- Bettcher BM, Yaffe K, Boudreau RM, Neuhaus J, Aizenstein H, Ding J, Kritchevsky SB, Launer LJ, Liu Y, Satterfield S, Rosano C, Health ABCs. Declines in inflammation predict greater white matter microstructure in older adults. Neurobiol Aging. 2015;36(2):948–54. doi: 10.1016/j.neurobiolaging.2014.11.004. [DOI] [PMC free article] [PubMed] [Google Scholar]
- Brandes U. A faster algorithm for betweenness centrality*. Journal of Mathematical Sociology. 2001;25(2):163–77. [Google Scholar]
- Brown JA, Terashima KH, Burggren AC, Ercoli LM, Miller KJ, Small GW, Bookheimer SY. Brain network local interconnectivity loss in aging APOE-4 allele carriers. Proceedings of the National Academy of Sciences of the United States of America. 2011;108(51):20760–5. doi: 10.1073/pnas.1109038108. [DOI] [PMC free article] [PubMed] [Google Scholar]
- Bruno J, Hosseini SM, Kesler S. Altered resting state functional brain network topology in chemotherapy-treated breast cancer survivors. Neurobiol Dis. 2012;48(3):329–38. doi: 10.1016/j.nbd.2012.07.009. [DOI] [PMC free article] [PubMed] [Google Scholar]
- Caeyenberghs K, Leemans A, Leunissen I, Michiels K, Swinnen SP. Topological correlations of structural and functional networks in patients with traumatic brain injury. Front Hum Neurosci. 2013;7:726. doi: 10.3389/fnhum.2013.00726. [DOI] [PMC free article] [PubMed] [Google Scholar]
- Chao HH, Uchio E, Zhang S, Hu S, Bednarski SR, Luo X, Rose M, Concato J, Li CS. Effects of androgen deprivation on brain function in prostate cancer patients -a prospective observational cohort analysis. BMC cancer. 2012;12:371. doi: 10.1186/1471-2407-12-371. [DOI] [PMC free article] [PubMed] [Google Scholar]
- Chen Z, Liu M, Gross DW, Beaulieu C. Graph theoretical analysis of developmental patterns of the white matter network. Front Hum Neurosci. 2013;7:716. doi: 10.3389/fnhum.2013.00716. [DOI] [PMC free article] [PubMed] [Google Scholar]
- Cohen J. Statistical power analysis for the behavioral sciences. 2nd. Lawrence Earlbaum Associates; Hillsdale, NJ: 1998. [Google Scholar]
- Crossley NA, Mechelli A, Scott J, Carletti F, Fox PT, McGuire P, Bullmore ET. The hubs of the human connectome are generally implicated in the anatomy of brain disorders. Brain. 2014;137(Pt 8):2382–95. doi: 10.1093/brain/awu132. [DOI] [PMC free article] [PubMed] [Google Scholar]
- Crucitti P, Latora V, Marchiori M, Rapisarda A. Efficiency of scale-free networks: error and attack tolerance. Physica A: Statistical Mechanics and its Applications. 2003;320:622–42. [Google Scholar]
- D'Agata F, Costa T, Caroppo P, Baudino B, Cauda F, Manfredi M, Geminiani G, Mortara P, Pinessi L, Castellano G, Bisi G. Multivariate analysis of brain metabolism reveals chemotherapy effects on prefrontal cerebellar system when related to dorsal attention network. EJNMMI research. 2013;3(1):22. doi: 10.1186/2191-219X-3-22. [DOI] [PMC free article] [PubMed] [Google Scholar]
- Dai Z, Yan C, Li K, Wang Z, Wang J, Cao M, Lin Q, Shu N, Xia M, Bi Y, He Y. Identifying and Mapping Connectivity Patterns of Brain Network Hubs in Alzheimer's Disease. Cereb Cortex. 2014 doi: 10.1093/cercor/bhu246. [DOI] [PubMed] [Google Scholar]
- de Ruiter MB, Reneman L, Boogerd W, Veltman DJ, Caan M, Douaud G, Lavini C, Linn SC, Boven E, van Dam FS, Schagen SB. Late effects of high-dose adjuvant chemotherapy on white and gray matter in breast cancer survivors: converging results from multimodal magnetic resonance imaging. Hum Brain Mapp. 2012;33(12):2971–83. doi: 10.1002/hbm.21422. [DOI] [PMC free article] [PubMed] [Google Scholar]
- de Ruiter MB, Schagen SB. Functional MRI studies in non-CNS cancers. Brain Imaging Behav. 2013;7(4):388–408. doi: 10.1007/s11682-013-9249-9. [DOI] [PubMed] [Google Scholar]
- Deprez S, Amant F, Smeets A, Peeters R, Leemans A, Van Hecke W, Verhoeven JS, Christiaens MR, Vandenberghe J, Vandenbulcke M, Sunaert S. Longitudinal Assessment of Chemotherapy-Induced Structural Changes in Cerebral White Matter and Its Correlation With Impaired Cognitive Functioning. J Clin Oncol. 2012;30(3):274–81. doi: 10.1200/JCO.2011.36.8571. [DOI] [PubMed] [Google Scholar]
- Deprez S, Amant F, Yigit R, Porke K, Verhoeven J, Van den Stock J, Smeets A, Christiaens MR, Leemans A, Van Hecke W, Vandenberghe J, Vandenbulcke M, Sunaert S. Chemotherapy-induced structural changes in cerebral white matter and its correlation with impaired cognitive functioning in breast cancer patients. Human Brain Mapping. 2011;32(3):480–93. doi: 10.1002/hbm.21033. [DOI] [PMC free article] [PubMed] [Google Scholar]
- Deprez S, Billiet T, Sunaert S, Leemans A. Diffusion tensor MRI of chemotherapy-induced cognitive impairment in non-CNS cancer patients: a review. Brain Imaging Behav. 2013;7(4):409–35. doi: 10.1007/s11682-012-9220-1. [DOI] [PubMed] [Google Scholar]
- Dietrich J. Chemotherapy associated central nervous system damage. Advances in experimental medicine and biology. 2010;678:77–85. doi: 10.1007/978-1-4419-6306-2_11. [DOI] [PubMed] [Google Scholar]
- Feigl GC, Hiergeist W, Fellner C, Schebesch KM, Doenitz C, Finkenzeller T, Brawanski A, Schlaier J. Magnetic resonance imaging diffusion tensor tractography: evaluation of anatomic accuracy of different fiber tracking software packages. World neurosurgery. 2014;81(1):144–50. doi: 10.1016/j.wneu.2013.01.004. [DOI] [PubMed] [Google Scholar]
- Feldt S, Bonifazi P, Cossart R. Dissecting functional connectivity of neuronal microcircuits: experimental and theoretical insights. Trends Neurosci. 2011;34(5):225–36. doi: 10.1016/j.tins.2011.02.007. [DOI] [PubMed] [Google Scholar]
- Filley CM. White matter: organization and functional relevance. Neuropsychol Rev. 2010;20(2):158–73. doi: 10.1007/s11065-010-9127-9. [DOI] [PubMed] [Google Scholar]
- Fischer FU, Wolf D, Scheurich A, Fellgiebel A. Association of structural global brain network properties with intelligence in normal aging. PLoS One. 2014;9(1):e86258. doi: 10.1371/journal.pone.0086258. [DOI] [PMC free article] [PubMed] [Google Scholar]
- Girvan M, Newman ME. Community structure in social and biological networks. Proceedings of the National Academy of Sciences of the United States of America. 2002;99(12):7821–6. doi: 10.1073/pnas.122653799. [DOI] [PMC free article] [PubMed] [Google Scholar]
- Gong G, Rosa-Neto P, Carbonell F, Chen ZJ, He Y, Evans AC. Age- and gender-related differences in the cortical anatomical network. The Journal of neuroscience. 2009;29(50):15684–93. doi: 10.1523/JNEUROSCI.2308-09.2009. [DOI] [PMC free article] [PubMed] [Google Scholar]
- Haut M, Moran M, Lancaster M, Kuwabara H, Parsons M, Puce A. White Matter Correlates of Cognitive Capacity Studied With Diffusion Tensor Imaging: Implications for Cognitive Reserve. Brain Imaging and Behavior. 2007;1(3):83–92. [Google Scholar]
- Hawellek DJ, Hipp JF, Lewis CM, Corbetta M, Engel AK. Increased functional connectivity indicates the severity of cognitive impairment in multiple sclerosis. Proceedings of the National Academy of Sciences of the United States of America. 2011;108(47):19066–71. doi: 10.1073/pnas.1110024108. [DOI] [PMC free article] [PubMed] [Google Scholar]
- He Y, Chen Z, Evans A. Structural insights into aberrant topological patterns of large-scale cortical networks in Alzheimer's disease. J Neurosci. 2008;28(18):4756–66. doi: 10.1523/JNEUROSCI.0141-08.2008. [DOI] [PMC free article] [PubMed] [Google Scholar]
- Heaton RK. Wisconsin Card Sorting Test Computer Version 4 - Research Edition (WCST:CV4) Psychological Assessment Resources; Odessa, FL: 2004. [Google Scholar]
- Homack S, Lee D, Riccio CA. Test review: Delis-Kaplan executive function system. J Clin Exp Neuropsychol. 2005;27(5):599–609. doi: 10.1080/13803390490918444. [DOI] [PubMed] [Google Scholar]
- Hosseini SM, Hoeft F, Kesler SR. GAT: A Graph-Theoretical Analysis Toolbox for Analyzing Between-Group Differences in Large-Scale Structural and Functional Brain Networks. PLoS ONE. 2012a;7(7):e40709. doi: 10.1371/journal.pone.0040709. [DOI] [PMC free article] [PubMed] [Google Scholar]
- Hosseini SM, Kesler SR. Multivariate Pattern Analysis of fMRI in Breast Cancer Survivors and Healthy Women. J Int Neuropsychol Soc. 2013;19:1–11. doi: 10.1017/S1355617713001173. [DOI] [PMC free article] [PubMed] [Google Scholar]
- Hosseini SM, Koovakkattu D, Kesler SR. Altered small-world properties of gray matter networks in breast cancer. BMC Neurol. 2012b;12(1):28. doi: 10.1186/1471-2377-12-28. [DOI] [PMC free article] [PubMed] [Google Scholar]
- Howlader N, Noone A, Krapcho M, Garshell J, Neyman N, Altekruse S, Kosary C, Yu M, Ruhl J, Tatalovich Z, Cho H, Mariotto A, Lewis D, Chen H, Feuer E, Cronin K. SEER Cancer Statistics Review, 1975-2010. National Cancer Institute; 2013. [Google Scholar]
- Hsieh TC, Wu YC, Yen KY, Chen SW, Kao CH. Early changes in brain FDG metabolism during anticancer therapy in patients with pharyngeal cancer. Journal of neuroimaging: official journal of the American Society of Neuroimaging. 2014;24(3):266–72. doi: 10.1111/jon.12006. [DOI] [PubMed] [Google Scholar]
- Humphries MD, Gurney K. Network ‘small-world-ness’: a quantitative method for determining canonical network equivalence. PLoS One. 2008;3(4):e0002051. doi: 10.1371/journal.pone.0002051. [DOI] [PMC free article] [PubMed] [Google Scholar]
- Jones DK, Knosche TR, Turner R. White matter integrity, fiber count, and other fallacies: the do's and don'ts of diffusion MRI. NeuroImage. 2013;73:239–54. doi: 10.1016/j.neuroimage.2012.06.081. [DOI] [PubMed] [Google Scholar]
- Joyce KE, Hayasaka S, Laurienti PJ. The human functional brain network demonstrates structural and dynamical resilience to targeted attack. PLoS Comput Biol. 2013;9(1):e1002885. doi: 10.1371/journal.pcbi.1002885. [DOI] [PMC free article] [PubMed] [Google Scholar]
- Kesler SR. Default mode network as a potential biomarker of chemotherapy-related brain injury. Neurobiol Aging. 2014;35(Suppl 2):S11–9. doi: 10.1016/j.neurobiolaging.2014.03.036. [DOI] [PMC free article] [PubMed] [Google Scholar]
- Kesler SR, Bennett FC, Mahaffey ML, Spiegel D. Regional brain activation during verbal declarative memory in metastatic breast cancer. Clin Cancer Res. 2009;15(21):6665–73. doi: 10.1158/1078-0432.CCR-09-1227. [DOI] [PMC free article] [PubMed] [Google Scholar]
- Kesler SR, Kent JS, O'Hara R. Prefrontal cortex and executive function impairments in primary breast cancer. Archives of neurology. 2011;68(11):1447–53. doi: 10.1001/archneurol.2011.245. [DOI] [PMC free article] [PubMed] [Google Scholar]
- Kesler SR, Tanaka H, Koovakkattu D. Cognitive reserve and brain volumes in pediatric acute lymphoblastic leukemia. Brain Imaging Behav. 2010;4(3-4):256–69. doi: 10.1007/s11682-010-9104-1. [DOI] [PMC free article] [PubMed] [Google Scholar]
- Koppelmans V, Breteler MM, Boogerd W, Seynaeve C, Schagen SB. Late effects of adjuvant chemotherapy for adult onset non-CNS cancer; cognitive impairment, brain structure and risk of dementia. Crit Rev Oncol Hematol. 2013;88(1):87–101. doi: 10.1016/j.critrevonc.2013.04.002. [DOI] [PubMed] [Google Scholar]
- Koppelmans V, de Groot M, de Ruiter MB, Boogerd W, Seynaeve C, Vernooij MW, Niessen WJ, Schagen SB, Breteler MM. Global and focal white matter integrity in breast cancer survivors 20 years after adjuvant chemotherapy. Hum Brain Mapp. 2014;35(3):889–99. doi: 10.1002/hbm.22221. [DOI] [PMC free article] [PubMed] [Google Scholar]
- Koppelmans V, de Ruiter MB, van der Lijn F, Boogerd W, Seynaeve C, van der Lugt A, Vrooman H, Niessen WJ, Breteler MM, Schagen SB. Global and focal brain volume in long-term breast cancer survivors exposed to adjuvant chemotherapy. Breast Cancer Res Treat. 2012;132(3):1099–106. doi: 10.1007/s10549-011-1888-1. [DOI] [PubMed] [Google Scholar]
- Latora V, Marchiori M. Efficient Behavior of Small-World Networks. Physical Review Letters. 2001;87(19) doi: 10.1103/PhysRevLett.87.198701. [DOI] [PubMed] [Google Scholar]
- Lawes IN, Barrick TR, Murugam V, Spierings N, Evans DR, Song M, Clark CA. Atlas-based segmentation of white matter tracts of the human brain using diffusion tensor tractography and comparison with classical dissection. NeuroImage. 2008;39(1):62–79. doi: 10.1016/j.neuroimage.2007.06.041. [DOI] [PubMed] [Google Scholar]
- Li Y, Liu Y, Li J, Qin W, Li K, Yu C, Jiang T. Brain anatomical network and intelligence. PLoS Comput Biol. 2009;5(5):e1000395. doi: 10.1371/journal.pcbi.1000395. [DOI] [PMC free article] [PubMed] [Google Scholar]
- Lo CY, Wang PN, Chou KH, Wang J, He Y, Lin CP. Diffusion tensor tractography reveals abnormal topological organization in structural cortical networks in Alzheimer's disease. J Neurosci. 2010;30(50):16876–85. doi: 10.1523/JNEUROSCI.4136-10.2010. [DOI] [PMC free article] [PubMed] [Google Scholar]
- Lord LD, Expert P, Huckins JF, Turkheimer FE. Cerebral energy metabolism and the brain's functional network architecture: an integrative review. J Cereb Blood Flow Metab. 2013;33(9):1347–54. doi: 10.1038/jcbfm.2013.94. [DOI] [PMC free article] [PubMed] [Google Scholar]
- Mandelblatt JS, Hurria A, McDonald BC, Saykin AJ, Stern RA, VanMeter JW, McGuckin M, Traina T, Denduluri N, Turner S, Howard D, Jacobsen PB, Ahles T Thinking, Living With Cancer, S. Cognitive effects of cancer and its treatments at the intersection of aging: what do we know; what do we need to know? Semin Oncol. 2013;40(6):709–25. doi: 10.1053/j.seminoncol.2013.09.006. [DOI] [PMC free article] [PubMed] [Google Scholar]
- Mar Fan H, Houédé-Tchen N, Chemerynsky I, Yi QL, Xu W, Harvey B. Menopausal symptoms in women undergoing chemotherapy-induced and natural menopause: a prospective controlled study. Annals of Oncology. 2010;21(5):983–7. doi: 10.1093/annonc/mdp394. [DOI] [PubMed] [Google Scholar]
- McDonald BC, Saykin AJ. Alterations in brain structure related to breast cancer and its treatment: chemotherapy and other considerations. Brain Imaging Behav. 2013;7(4):374–87. doi: 10.1007/s11682-013-9256-x. [DOI] [PMC free article] [PubMed] [Google Scholar]
- Mirzasoleiman B, Jalili M. Failure tolerance of motif structure in biological networks. PLoS One. 2011;6(5):e20512. doi: 10.1371/journal.pone.0020512. [DOI] [PMC free article] [PubMed] [Google Scholar]
- Mori S, van Zijl PC. Fiber tracking: principles and strategies - a technical review. NMR in biomedicine. 2002;15(7-8):468–80. doi: 10.1002/nbm.781. [DOI] [PubMed] [Google Scholar]
- Mukherjee P, Berman JI, Chung SW, Hess CP, Henry RG. Diffusion tensor MR imaging and fiber tractography: theoretic underpinnings. AJNR Am J Neuroradiol. 2008;29(4):632–41. doi: 10.3174/ajnr.A1051. [DOI] [PMC free article] [PubMed] [Google Scholar]
- O'Donnell LJ, Westin CF. An introduction to diffusion tensor image analysis. Neurosurgery clinics of North America. 2011;22(2):185–96. viii. doi: 10.1016/j.nec.2010.12.004. [DOI] [PMC free article] [PubMed] [Google Scholar]
- Roth RM, Isquith PK, Gioia G. Behavioral Rating Inventory of Executive Function - Adult Version. Psychological Assessment Resources; Lutz, FL: 2005. [Google Scholar]
- Rubinov M, McIntosh AR, Valenzuela MJ, Breakspear M. Simulation of neuronal death and network recovery in a computational model of distributed cortical activity. Am J Geriatr Psychiatry. 2009;17(3):210–7. doi: 10.1097/JGP.0b013e318187137a. [DOI] [PubMed] [Google Scholar]
- Rubinov M, Sporns O. Complex network measures of brain connectivity: uses and interpretations. NeuroImage. 2010;52(3):1059–69. doi: 10.1016/j.neuroimage.2009.10.003. [DOI] [PubMed] [Google Scholar]
- Rudie JD, Brown JA, Beck-Pancer D, Hernandez LM, Dennis EL, Thompson PM, Bookheimer SY, Dapretto M. Altered functional and structural brain network organization in autism. NeuroImage Clinical. 2012;2:79–94. doi: 10.1016/j.nicl.2012.11.006. [DOI] [PMC free article] [PubMed] [Google Scholar]
- Sachdev PS, Zhuang L, Braidy N, Wen W. Is Alzheimer's a disease of the white matter? Curr Opin Psychiatry. 2013;26(3):244–51. doi: 10.1097/YCO.0b013e32835ed6e8. [DOI] [PubMed] [Google Scholar]
- Sanoff HK, Deal AM, Krishnamurthy J, Torrice C, Dillon P, Sorrentino J, Ibrahim JG, Jolly TA, Williams G, Carey LA, Drobish A, Gordon BB, Alston S, Hurria A, Kleinhans K, Rudolph KL, Sharpless NE, Muss HB. Effect of cytotoxic chemotherapy on markers of molecular age in patients with breast cancer. J Natl Cancer Inst. 2014;1064:dju057. doi: 10.1093/jnci/dju057. [DOI] [PMC free article] [PubMed] [Google Scholar]
- Santarnecchi E, Rossi S, Rossi A. The smarter, the stronger: Intelligence level correlates with brain resilience to systematic insults. Cortex. 2014;64C:293–309. doi: 10.1016/j.cortex.2014.11.005. [DOI] [PubMed] [Google Scholar]
- Scherling CS, Smith A. Opening up the window into “chemobrain”: a neuroimaging review. Sensors. 2013;13(3):3169–203. doi: 10.3390/s130303169. [DOI] [PMC free article] [PubMed] [Google Scholar]
- Small BJ, Rawson KS, Walsh E, Jim HSL, Hughes TF, Iser L, Andrykowski MA, Jacobsen PB. Catechol-O-methyltransferase genotype modulates cancer treatment-related cognitive deficits in breast cancer survivors. Cancer. 2011;117(7):1369–76. doi: 10.1002/cncr.25685. [DOI] [PubMed] [Google Scholar]
- Smith SM, Jenkinson M, Johansen-Berg H, Rueckert D, Nichols TE, Mackay CE, Watkins KE, Ciccarelli O, Cader MZ, Matthews PM, Behrens TE. Tract-based spatial statistics: voxelwise analysis of multi-subject diffusion data. NeuroImage. 2006;31(4):1487–505. doi: 10.1016/j.neuroimage.2006.02.024. [DOI] [PubMed] [Google Scholar]
- Smith SM, Jenkinson M, Woolrich MW, Beckmann CF, Behrens TE, Johansen-Berg H, Bannister PR, De Luca M, Drobnjak I, Flitney DE, Niazy RK, Saunders J, Vickers J, Zhang Y, De Stefano N, Brady JM, Matthews PM. Advances in functional and structural MR image analysis and implementation as FSL. NeuroImage. 2004;23(23):S208–19. doi: 10.1016/j.neuroimage.2004.07.051. [DOI] [PubMed] [Google Scholar]
- Smith SM, Zhang Y, Jenkinson M, Chen J, Matthews PM, Federico A, De Stefano N. Accurate, robust, and automated longitudinal and cross-sectional brain change analysis. NeuroImage. 2002;17(1):479–89. doi: 10.1006/nimg.2002.1040. [DOI] [PubMed] [Google Scholar]
- Sole-Padulles C, Bartres-Faz D, Junque C, Vendrell P, Rami L, Clemente IC, Bosch B, Villar A, Bargallo N, Jurado MA, Barrios M, Molinuevo JL. Brain structure and function related to cognitive reserve variables in normal aging, mild cognitive impairment and Alzheimer's disease. Neurobiol Aging. 2009;30(7):1114–24. doi: 10.1016/j.neurobiolaging.2007.10.008. [DOI] [PubMed] [Google Scholar]
- Sporns O, Honey CJ, Kotter R. Identification and classification of hubs in brain networks. PLoS ONE. 2007;2(10):e1049. doi: 10.1371/journal.pone.0001049. [DOI] [PMC free article] [PubMed] [Google Scholar]
- Stam CJ, de Haan W, Daffertshofer A, Jones BF, Manshanden I, van Cappellen van Walsum AM, Montez T, Verbunt JP, de Munck JC, van Dijk BW, Berendse HW, Scheltens P. Graph theoretical analysis of magnetoencephalographic functional connectivity in Alzheimer's disease. Brain. 2009;132(Pt 1):213–24. doi: 10.1093/brain/awn262. [DOI] [PubMed] [Google Scholar]
- Stern Y. Cognitive reserve in ageing and Alzheimer's disease. The Lancet Neurology. 2012;11(11):1006–12. doi: 10.1016/S1474-4422(12)70191-6. [DOI] [PMC free article] [PubMed] [Google Scholar]
- Stern Y. Cognitive Reserve: Implications for Assessment and Intervention. Folia phoniatrica et logopaedica: official organ of the International Association of Logopedics and Phoniatrics. 2013;65(2):49–54. doi: 10.1159/000353443. [DOI] [PMC free article] [PubMed] [Google Scholar]
- Stouten-Kemperman MM, de Ruiter MB, Koppelmans V, Boogerd W, Reneman L, Schagen SB. Neurotoxicity in breast cancer survivors >/=10 years post-treatment is dependent on treatment type. Brain Imaging Behav. 2014 doi: 10.1007/s11682-014-9305-0. [DOI] [PubMed] [Google Scholar]
- Sun J, Tong S, Yang GY. Reorganization of Brain Networks in Aging and Age-related Diseases. Aging and Disease. 2012;3(2):181–93. [PMC free article] [PubMed] [Google Scholar]
- Tijms BM, Wink AM, de Haan W, van der Flier WM, Stam CJ, Scheltens P, Barkhof F. Alzheimer's disease: connecting findings from graph theoretical studies of brain networks. Neurobiol Aging. 2013;34(8):2023–36. doi: 10.1016/j.neurobiolaging.2013.02.020. [DOI] [PubMed] [Google Scholar]
- Troyer AK, Rich JB. Psychometric Properties of a New Metamemory Questionnaire for Older Adults. The Journals of Gerontology Series B: Psychological Sciences and Social Sciences. 2002;57(1):P19–P27. doi: 10.1093/geronb/57.1.p19. [DOI] [PubMed] [Google Scholar]
- Tucker AM, Stern Y. Cognitive reserve in aging. Curr Alzheimer Res. 2011;8(4):354–60. doi: 10.2174/156720511795745320. [DOI] [PMC free article] [PubMed] [Google Scholar]
- Tzourio-Mazoyer N, Landeau B, Papathanassiou D, Crivello F, Etard O, Delcroix N, Mazoyer B, Joliot M. Automated anatomical labeling of activations in SPM using a macroscopic anatomical parcellation of the MNI MRI single-subject brain. NeuroImage. 2002;15(1):273–89. doi: 10.1006/nimg.2001.0978. [DOI] [PubMed] [Google Scholar]
- Von Ah D, Habermann B, Carpenter JS, Schneider BL. Impact of perceived cognitive impairment in breast cancer survivors. European journal of oncology nursing: the official journal of European Oncology Nursing Society. 2013;17(2):236–41. doi: 10.1016/j.ejon.2012.06.002. [DOI] [PubMed] [Google Scholar]
- Wang R, Benner T, Sorensen AG, Wedden VJ. Diffusion Toolkit: a software package for diffusion imaging data processing and tractography. Proc Int Soc Mag Reson Med. 2007;15:3720. [Google Scholar]
- Wechsler D. Wechsler Adult Intelligence Scale Fourth Edition. The Psychological Corporation; San Antonio, TX: 2008. [Google Scholar]
- Wefel JS, Saleeba AK, Buzdar AU, Meyers CA. Acute and late onset cognitive dysfunction associated with chemotherapy in women with breast cancer. Cancer. 2010;116(14):3348–56. doi: 10.1002/cncr.25098. [DOI] [PubMed] [Google Scholar]
- Wefel JS, Schagen SB. Chemotherapy-related cognitive dysfunction. Current neurology and neuroscience reports. 2012;12(3):267–75. doi: 10.1007/s11910-012-0264-9. [DOI] [PubMed] [Google Scholar]
- Wefel JS, Vardy J, Ahles T, Schagen SB. International Cognition and Cancer Task Force recommendations to harmonise studies of cognitive function in patients with cancer. The lancet oncology. 2011;12(7):703–8. doi: 10.1016/S1470-2045(10)70294-1. [DOI] [PubMed] [Google Scholar]
- Wu K, Taki Y, Sato K, Kinomura S, Goto R, Okada K, Kawashima R, He Y, Evans AC, Fukuda H. Age-related changes in topological organization of structural brain networks in healthy individuals. Hum Brain Mapp. 2011;33(3):552–68. doi: 10.1002/hbm.21232. [DOI] [PMC free article] [PubMed] [Google Scholar]
- Wu K, Taki Y, Sato K, Qi H, Kawashima R, Fukuda H. A longitudinal study of structural brain network changes with normal aging. Front Hum Neurosci. 2013;7:113. doi: 10.3389/fnhum.2013.00113. [DOI] [PMC free article] [PubMed] [Google Scholar]
- Xia M, Wang J, He Y. BrainNet Viewer: a network visualization tool for human brain connectomics. PLoS One. 2013;8(7):e68910. doi: 10.1371/journal.pone.0068910. [DOI] [PMC free article] [PubMed] [Google Scholar]
- Xiang J, Guo H, Cao R, Liang H, Chen J. An abnormal resting-state functional brain network indicates progression towards Alzheimer's disease. Neural regeneration research. 2013;8(30):2789–99. doi: 10.3969/j.issn.1673-5374.2013.30.001. [DOI] [PMC free article] [PubMed] [Google Scholar]
- Zhong S, He Y, Gong G. Convergence and divergence across construction methods for human brain white matter networks: An assessment based on individual differences. Hum Brain Mapp. 2015 doi: 10.1002/hbm.22751. [DOI] [PMC free article] [PubMed] [Google Scholar]
Associated Data
This section collects any data citations, data availability statements, or supplementary materials included in this article.