Abstract
Recent studies suggest a functional role for neuronal cytochrome P450 monooxygenase (P450) activity in opioid analgesia. To characterize the relevant receptors, brain areas, and circuits, detailed in vitro and in vivo studies were performed with the highly selective μ opioid receptor agonist DAMGO in neuronal P450-deficient mutant (Null) and control mice. Homogenates of brain regions and spinal cord showed no differences in DAMGO-induced activation of [35S]-GTPγS binding between Null and control mice, indicating no genotype differences in μ opioid receptor signaling, receptor affinities or receptor densities. Intracerebroventricular (icv) DAMGO produced robust, near-maximal, analgesic responses in control mice which were attenuated by 50% in Null mice, confirming a role for μ opioid receptors in activating P450-associated responses. Intra-periaqueductal gray (PAG) and intra-rostral ventromedial medulla (RVM) injections of DAMGO revealed deficits in Null (vs. control) analgesic responses, yet no such genotype differences were observed after intrathecal DAMGO administration. Taken with earlier published findings, the present results suggest that activation of μ opioid receptors in both the PAG and in the RVM relieves pain by mechanisms which include nerve-terminal P450 enzymes within inhibitory PAG-RVM projections. Spinal opioid analgesia, however, does not seem to require such P450 enzyme activity.
Keywords: cytochrome P450, opioid, μ opioid receptor, pain, analgesia, brain stem
1. Introduction
Opioids remain an important category of medications for the treatment of many types of pain. Clinically useful opioids produce analgesia by activation of μ opioid receptors in the periaqueductal gray (PAG), the rostral ventromedial medulla (RVM), and the spinal dorsal horn (Heinricher and Ingram, 2008). In the PAG, μ stimulation inhibits pre-synaptic GABAergic activity, with the subsequent activation of descending, pain-relieving circuits, but details of these circuits remain unclear. At the neurochemical level, several cellular transduction mechanisms are used by μ opioid receptors (Williams, et al., 2013;Law, 2011), but opening of voltage-gated potassium channels in pre-synaptic GABAergic terminals (thereby reducing GABA release) is a favored hypothesis to account for the activation of descending, pain-relieving circuits (Vaughan, et al., 1997). As considered further below (see Discussion), both pre- and post-synaptic mechanisms are likely to be involved.
While exploring brain stem analgesic actions of opioids, our lab reported that knockout mice with deficiencies in brain neuronal cytochrome P450 monooxygenase (P450) lacked normal antinociceptive responses to morphine (Conroy, et al., 2010). Although P450 enzymes are most commonly associated with drug metabolism, they also participate in numerous types of endogenous lipid oxidation (Spector, 2009; Morisseau and Hammock, 2013). Based on the defective responses in P450-deficient mice and other results, Conroy et al. (2010) suggested that μ opioids inhibit GABAergic activity by stimulating the release and P450-mediated epoxidation of arachidonic acid. The epoxide products of some fatty acids are reported to have analgesic or anti-allodynic activity (Terashvili, et al., 2008; Wagner, et al., 2013). Although the actual mechanism has not been established, μ opioid receptor activation was suggested to release arachidonic acid via sequential activation of phospholipase Cγ, inositol-1,4,5-triphosphate receptors and calcium-dependent PLA2 (Conroy, et al., 2010). More recent in vivo (Conroy, et al., 2013; Hough, et al., 2014b) and in vitro (Zhang and Pan, 2012) work supports this P450 epoxygenase theory of μ opioid receptor action.
Notwithstanding this recent support, many questions remain unanswered concerning the relationship between neuronal P450 activity and opioid analgesia. For example, based on results with morphine, μ opioid receptors have been proposed to utilize P450-related signal transduction, but a P450 requirement for highly selective μ agonists has not been studied. Similarly, brains from neuronal P450-deficient mice (which have defective morphine analgesia) have no deficits in whole brain μ opioid receptor number or affinity, but the possible relevance of brain P450 activity to μ opioid G protein-coupled signaling efficacy has not been studied. Finally, since opioids elicit analgesia from several CNS locations, the anatomical localization of the P450-relevant opioid receptors is of interest, but has not been determined. Presently, we describe detailed biochemical and CNS mapping studies with the highly selective μ agonist [D-Ala2, N-Me-Phe4, Gly5-ol]-enkephalin (DAMGO) in control and neuronal P450-deficient knockout mice in order to answer these questions.
2. Results
Brain neuron-specific P450-deficient mice (designated here as Null) were generated as described in the Methods section and studied by in vivo and in vitro methods.
2.1. DAMGO analgesia (icv administration)
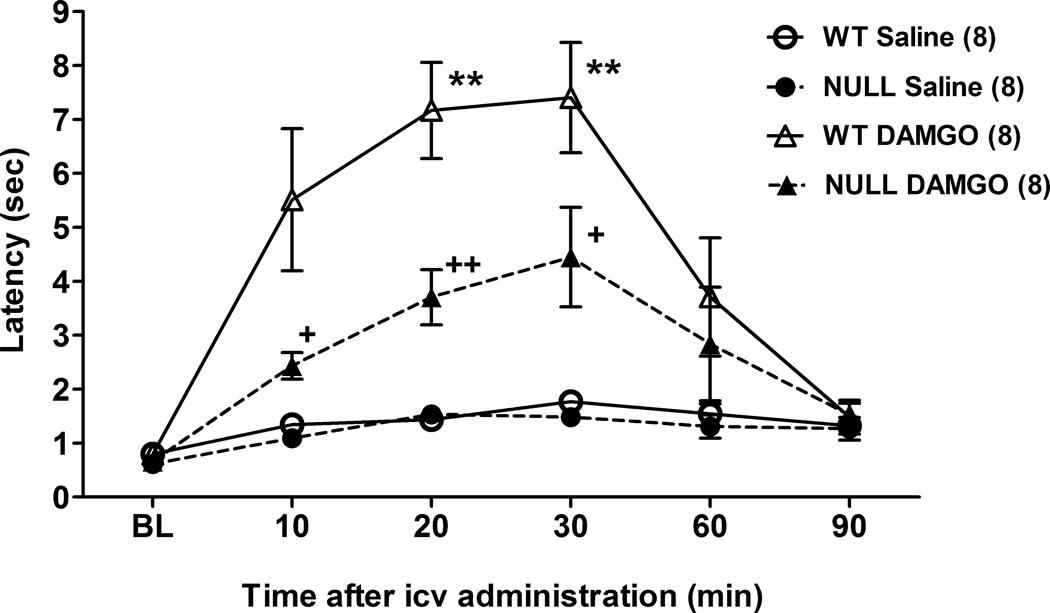
Icv administration of DAMGO (0.1 nmol) to control mice produced a robust increase in tail immersion nociceptive latencies which lasted approximately 30 min (Fig. 1). In Null subjects, the analgesic effects of DAMGO were approximately 50% less than in controls at the 10, 20 and 30 min test intervals (Fig. 1). ANOVA of the data in Fig. 1 (between groups: DAMGO, gender, and genotype; within groups [repeated measures]: time) found significant main effects of DAMGO (F1,24=34.7, P<0.0001), genotype (F1,24=6.8, P<0.02), and time (F5,120=24.6, P<0.0001), with significant DAMGO by genotype (F1,24=4.5, P<0.05) and DAMGO by genotype by time (F5,120 =2.9, P<0.02) interaction terms. There were no gender-related main effects or interaction terms, which permitted pooling of the data across genders (Fig. 1).
Figure 1.
DAMGO antinociception in brain P450-deficient and control mice following icv administration. Control (WT) and Null mice of either sex were tested for nociceptive responses (time zero = baseline, BL), received DAMGO (0.1 nmol) or saline, and were re-tested at the indicated times (abscissa, min). Ordinate shows latencies (sec, mean ± S.E.M.) for the n values in parentheses. Data from both genders were pooled. **P < 0.01 vs. WT Saline at the same time. +, ++P < 0.05, 0.01, respectively vs. WT DAMGO at the same time.
2.2. DAMGO – stimulated binding of [35S]-GTPγS
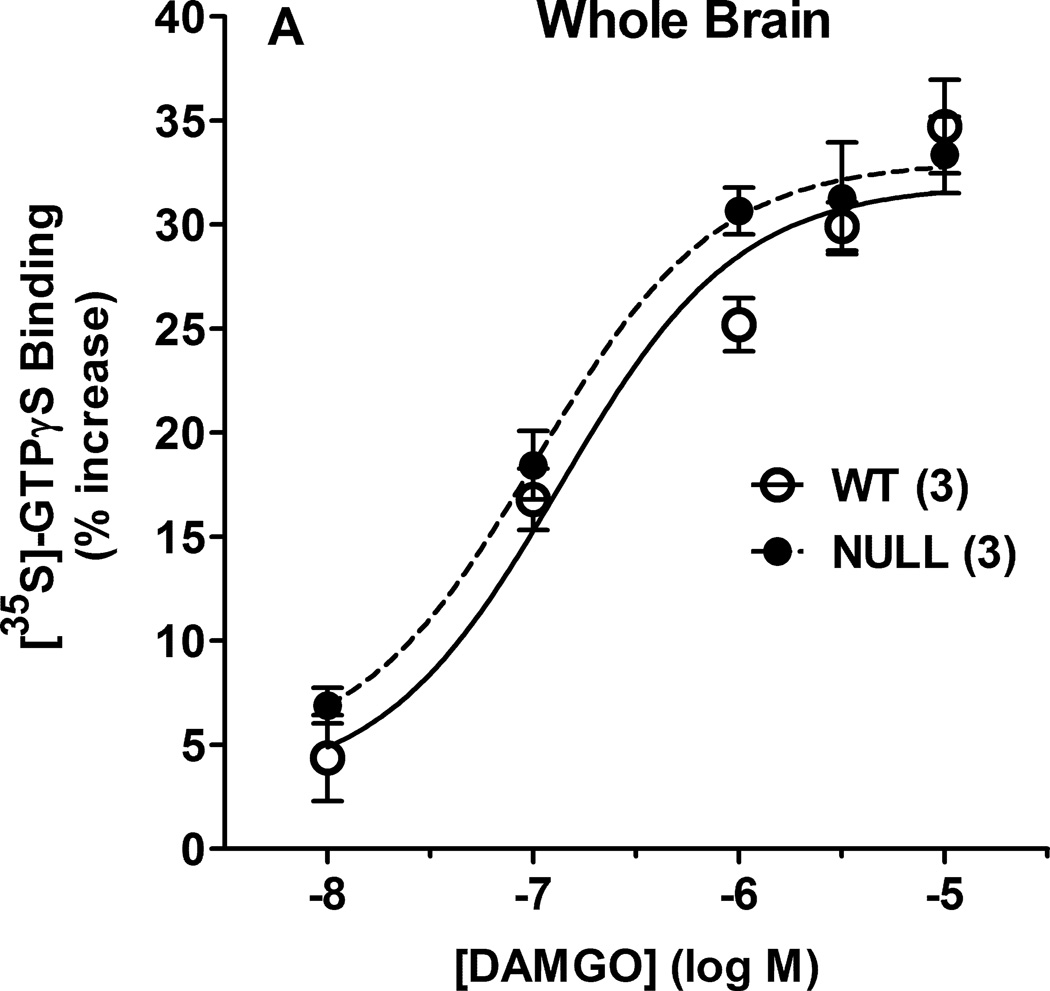
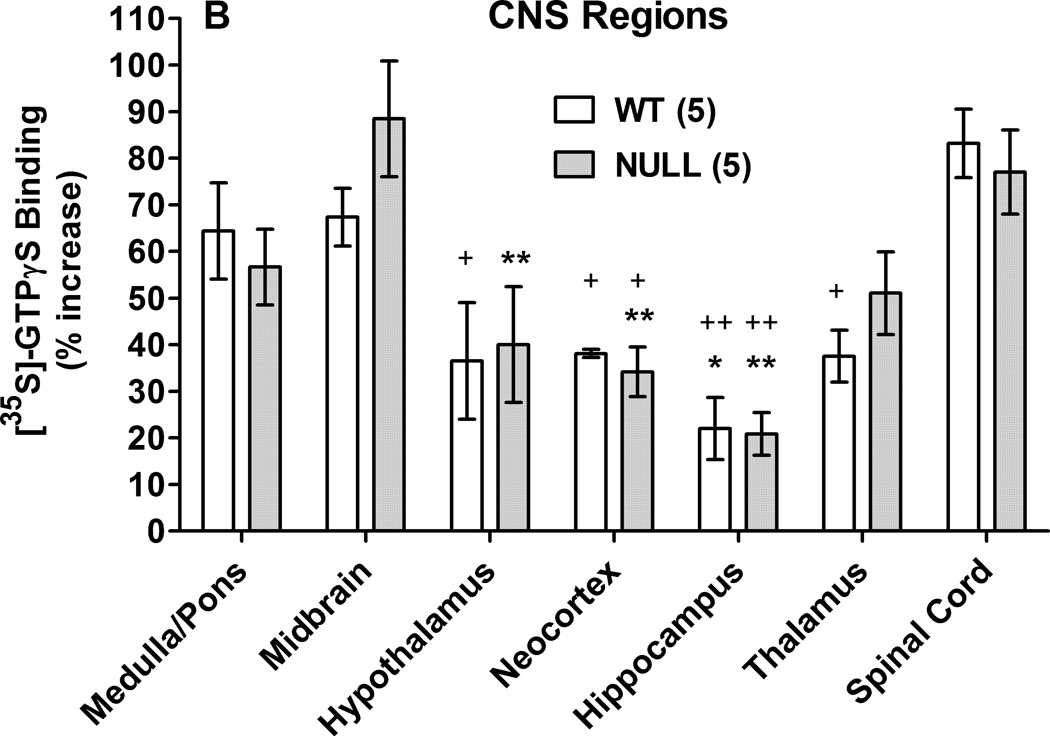
In whole brain membranes from control and Null mice, DAMGO produced concentration-dependent increases in [35S]-GTPγS binding, with no genotype differences (Fig. 2A). ANOVA of the data in Fig. 2A (between groups: DAMGO concentration, genotype) found a significant main effect across DAMGO concentration (F4,16=82.7, P<0.001), with no significant genotype-related terms. Brain regions and spinal cord of the two genotypes were also examined for DAMGO-stimulated [35S]-GTPγS binding (Fig. 2B). ANOVA (between groups: CNS region, genotype) found significant differences in DAMGO stimulation across regions (main effect of regions, F6,57 = 13.87, P<0.001) with no significant genotype-related terms.
Figure 2.
DAMGO-induced activation of [35S]- GTPγS binding in P450-deficient and control mouse brains. A) Membranes prepared from control (WT) and Null whole brains were incubated with [35S]-GTPγS and the specified concentrations of DAMGO (abscissa, log M), then filtered as described. Specifically bound [35S]- GTPγS values (ordinate, % of basal binding, mean ± S.E.M.) are shown for 3 male subjects from each genotype. Basal binding (in the absence of DAMGO) was 204.4 ± 34.4 and 180.8 ± 4.6 fmol/mg protein (mean ± S.E.M.) for WT and Null, respectively, not significantly different from each other. B) [35S]-GTPγS binding values are shown (as in A) for membranes incubated with DAMGO (10 µM) for seven specified CNS regions from five male subjects of each genotype. Basal binding values (mean ± S.E.M.) ranged from 87.9 ± 10.3 and 64.5 ± 9.9 (WT, Null, respectively for spinal cord) to 215.9 ± 16.0 and 228.0 ± 60.0 (WT, Null, respectively for neocortex). ANOVA of basal binding values found significant (P < 0.05) differences across regions, but not across genotypes. *,**P < 0.05, 0.01 respectively vs. midbrain value in the same genotype; +,++P < 0.05, 0.01 vs. spinal cord value in the same genotype.
2.3. DAMGO analgesia following intra-PAG administration
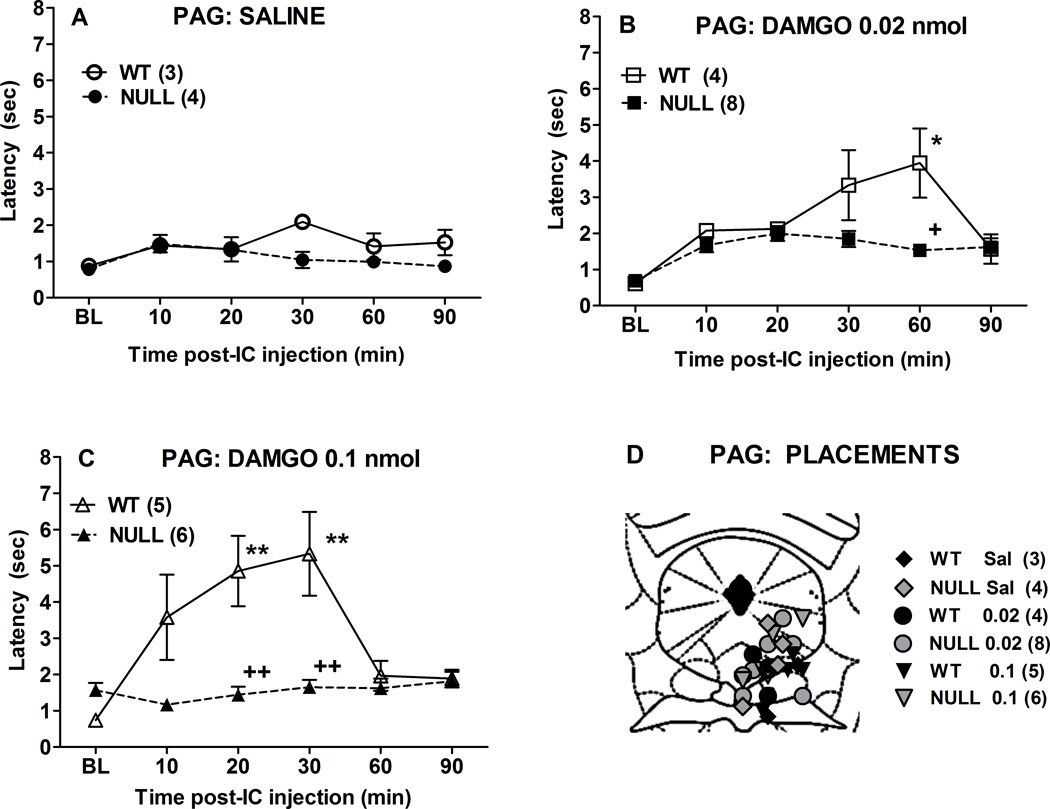
Intracerebral injections into the PAG of control mice produced dose-dependent, reversible antinociception for up to 30 min after administration (Fig. 3). The analgesic activity of DAMGO was almost completely absent in P450-deficient Null mice (Fig. 3). ANOVA of the data in Fig. 3 (between groups: DAMGO dose and genotype; within groups [repeated measures]: time) found significant main effects of DAMGO (F2,24=9.98, P<0.0001), genotype (F1,24=22.52, P<0.0001), and time (F5,120 =15.4, P<0.0001), with significant DAMGO by genotype (F2,24=3.55, P<0.05) and DAMGO by genotype by time (F10,120 =3.67, P<0.001) interaction terms. Post-hoc testing confirmed loss of DAMGO analgesia in Null vs. control mice after both doses of DAMGO (Fig. 3B). Placements for intra-PAG injections are shown in Fig. 3D.
Figure 3.
DAMGO antinociception in brain P450-deficient and control mice following intra-PAG administration. Control (WT) and Null mice were tested for nociceptive responses (baseline, BL), received either A) saline, B) DAMGO (0.02 nmol) or C) DAMGO (0.1 nmol), and were re-tested at the indicated times (abscissa, min). Ordinate shows latencies (sec, mean ± S.E.M.) for the n values in parentheses. Except for saline groups (which included both sexes), all subjects were male. D) Placements for all intra-PAG injections are shown. Actual AP locations ranged from −3.52 to −4.96 mm from bregma, but are drawn at the AP −4.6 mm plane. *,**P < 0.05, 0.01 respectively vs. WT Saline at the same time. +, ++P < 0.05, 0.01, respectively, vs. WT DAMGO at the same dose and time.
2.4. DAMGO analgesia following intra-RVM administration
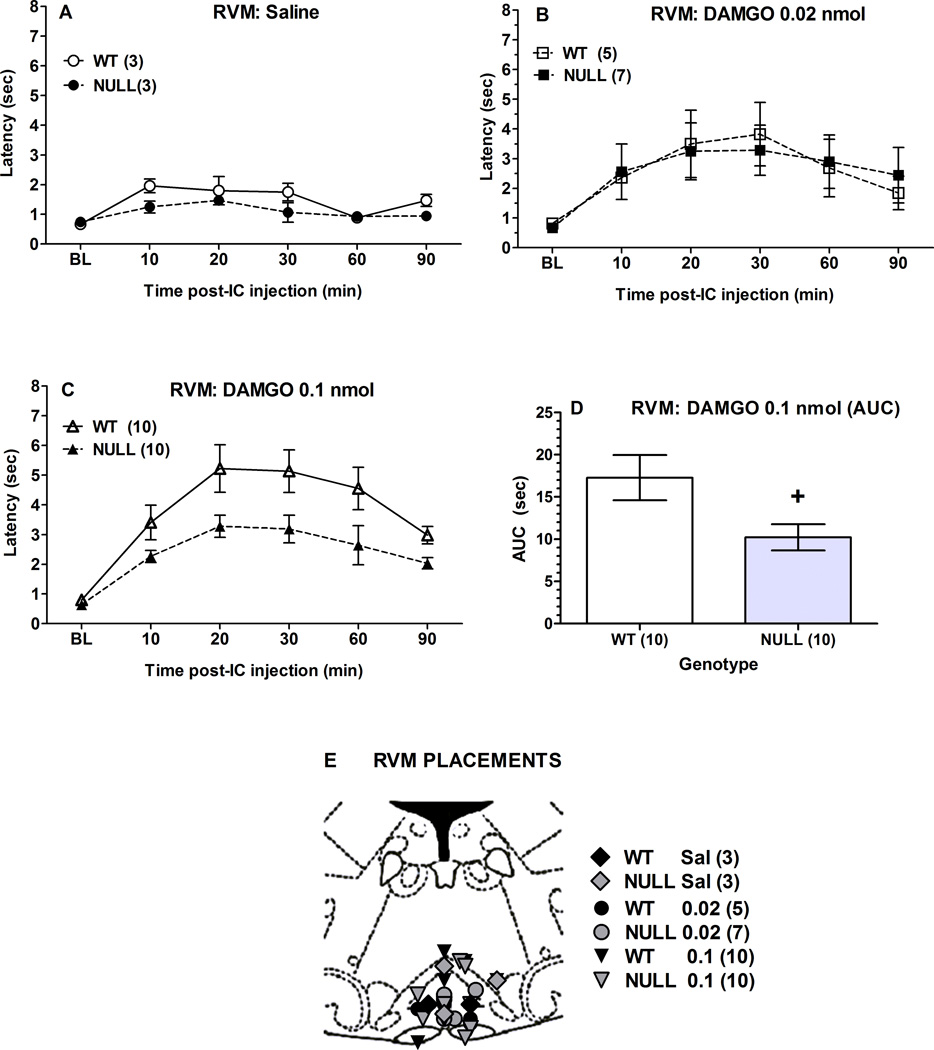
The effects of two doses of i.c.-administered DAMGO into the RVM were studied in two mouse genotypes (Fig. 4). The lower dose (0.02 nmol) produced modest analgesic responses which did not differ between genotypes (Figs. 4A, 4B). However, a larger dose (0.1 nmol) produced a robust, time-dependent effect that was attenuated in Null vs. control mice (Fig. 4C). ANOVA of the data in Fig. 4C (between groups: genotype; within groups [repeated measures]: time) found significant main effects of genotype (F1,18=6.8, P<0.02), and time (F5,90 =25.5, P<0.0001), with no significant interactions. Since time by genotype interactions were not significant, the areas under the analgesic time curves were calculated from latencies in Fig. 4C, shown in Fig. 4D. These results confirm a statistically significant, 41% loss in analgesic responses in Null as compared with control mice. Placements for intra-RVM injections are shown in Fig. 4E.
Figure 4.
DAMGO antinociception in brain P450-deficient and control mice following intra-RVM administration. Control (WT) and Null mice were tested for nociceptive responses (baseline, BL), received either A) saline, B) DAMGO (0.02 nmol), or C) DAMGO (0.1 nmol), and were re-tested at the indicated times (abscissa, min). Ordinate shows latencies (sec, mean ± S.E.M.) for the n values in parentheses. Panel D shows AUC (area under the curve, sum of post-test scores at 10–90 min minus baseline) calculations for the data in C. Except for saline groups (which included both sexes), all subjects were male. E) Placements for all intra-RVM injections are shown. Actual AP locations ranged from −5.32 to − 6.24 mm from bregma, but are depicted at the AP −5.8 mm plane. +P < 0.05 for Null vs WT receiving 0.1 nmol DAMGO (t-test, panel D).
2.5. DAMGO analgesia following intrathecal administration
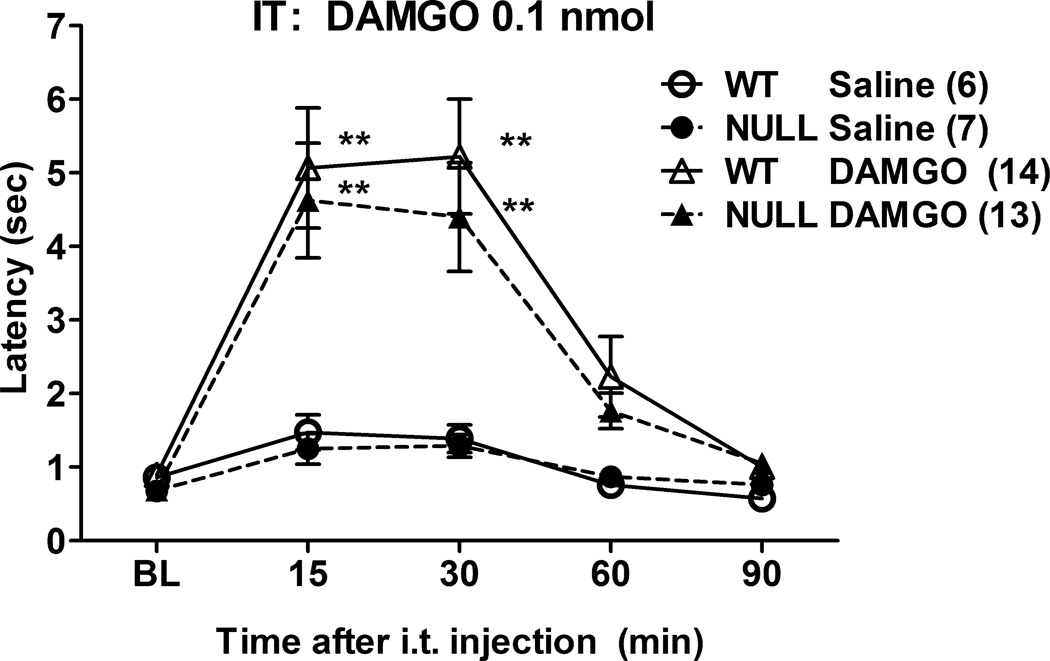
Administration of DAMGO (0.1 nmol) into the spinal subarachnoid space of control and Null mice produced robust, time-dependent analgesia, with no genotype differences. (Fig. 5). ANOVA of the data in Fig. 5 (between groups: DAMGO, gender, genotype; within groups [repeated measures]: time) found significant main effects of DAMGO (F1,32=18.44, P<0.0002) and time (F4,128 =23.96, P<0.0001), with a significant DAMGO by time interaction (F4,128 =12.27, P<0.0001). The absence of significant gender-related main effects or interaction terms permitted pooling of the data across genders (Fig. 5). The ANOVA yielded no significant genotype-related main effects or interaction terms.
Figure 5.
DAMGO antinociception in brain P450-deficient mice following intrathecal (i.t.) administration. Control (WT) and Null mice were tested for nociceptive responses (baseline, BL), received either saline or DAMGO (0.1 nmol), and were re-tested at the indicated times (abscissa, min). Ordinate shows latencies (pooled sexes, sec, mean ± S.E.M.) for the n values in parentheses. **P < 0.01 respectively vs. Saline at the same time in the same genotype.
3. Discussion
The inhibition of morphine analgesia by P450 inhibitors, and the attenuated opioid analgesic responses in brain P450-deficient (Null) mice show that brain P450 enzyme activity is required for the brain's normal opioid analgesic responses (Conroy, et al., 2010; Conroy, et al., 2013; Hough, et al., 2014b). Since the present study focused exclusively on knockout mice engineered to lack P450 activity in neurons, it is important to mention some of the limitations of the use of these subjects. These include the heterogeneous distribution of the putative neuronal marker Camk2a (designed to control the deletion of neuronal CPR, see Methods), the possible failure of floxed genes to express normally, and possible compensatory changes in mutant gene expression profiles. These and other concerns have been addressed in earlier studies (Wu, et al, 2003; Conroy, et al., 2010), and by comparing the characteristics of Null mice with the effects produced by treatment with P450 inhibitors in control animals.
However, many questions related to this analgesia-associated P450 activity remain unanswered. Three of these are addressed presently: 1) What neurochemical mechanism(s) underlie the association between brain P450s and opioid analgesia? 2) Which neurons and/or CNS areas contain the analgesia-relevant P450 enzymes? 3) How do these P450s fit into brain stem analgesic circuits ? Other questions have been addressed in recent publications (Hough, et al., 2014a; Hough, et al., 2014b).
To further understand the neurochemical mechanisms associated with opioid analgesia, it is important to identify which opioid receptors are linked to P450 activity. Based on the presumption of morphine’s opioid receptor preference, published studies (Conroy, et al., 2010; Conroy, et al., 2013) suggest the importance of μ opioid receptors for engaging P450-associated analgesia. The presently-observed attenuated responses in Null mice to the highly μ-selective agonist DAMGO (Fig. 1) confirm the existence of a P450-related mechanism for μ opioid analgesia. In vitro experiments with RVM brain slices support this μ opioid–P450 link. Interestingly, no such δ opioid-P450 link was identified (Zhang and Pan, 2012).
Mechanisms which implicate neuronal P450s in opioid receptor signaling need to exclude pharmacokinetic explanations for the reduced DAMGO responses in Null mice (Fig. 1). Although P450 enzymes are best known to function in hepatic drug metabolism, hepatic metabolism plays no role in the present findings because 1) DAMGO was administered directly into the CNS, bypassing systemic biotransformation, and 2) Null mice have normal liver P450 activity (Conroy, et al., 2010). In addition to hepatic metabolism, recent studies show that brain P450s may participate in some drug metabolism (Ferguson and Tyndale, 2011). However, if brain metabolism of opioids were playing a role in controlling the present Null responses, then Null mice should show increased (not decreased) responses to DAMGO.
Several other mechanisms might account for the reduced DAMGO responses in Null mice. Mu opioid receptor signaling could be reduced in these subjects, related to receptor number or receptor-ligand affinity. However, results (Fig. 2) showing no genotype-related differences in either whole brain or regional brain DAMGO-induced activation of [35S]- GTPγS binding, confirm that neither receptor numbers nor receptor affinity changes can account for the analgesic deficits. These findings confirm and extend earlier whole brain radioligand binding studies (Conroy, et al., 2010).
Neuronal P450-deficient mice could have other types of deficits in μ opioid signal transduction. For example, the structure, location, or composition of cholesterol-containing lipid rafts may influence μ opioid receptor signaling efficiency (Williams, et al., 2013). Since brain cholesterol metabolism is regulated by a neuronal P450 isozyme (Lund, et al., 2003), the data of Fig. 1 could possibly be explained by altered lipid raft-related signaling in Null mice. However, the lack of genotype differences across regional DAMGO-induced activation of [35S]-GTPγS binding (Fig. 2B) argues against this hypothesis. These results, which show that opioids produce similar levels of μ receptor signaling in both strains of mice, are additional, novel findings suggesting that neuronal P450 activity is required in a post-receptor opioid signaling pathway needed for analgesic responses. Because Fig. 2 studied [35S]- GTPγS binding, this conclusion may be limited to G protein-related opioid signaling, and may not apply to non-G protein dependent signaling (Williams, et al., 2013).
Related to questions #2 and #3 (above), three approaches (Table 1) have been taken in an attempt to identify the cells, the CNS areas, and circuits relevant to the P450-opioid analgesia connection. Interest in the localization of P450-deficient neurons in Null mice stems from the fact that these mice are conditional knockouts. Because Cpr deletion in these mice is linked to expression of the neuronal marker Camk2a (not found in all neurons), then only selected Null neurons lack P450 activity. Since Null mice lack normal opioid analgesia, the identification of the P450-deficient neurons can facilitate characterization of the opioid-P450 circuitry. As shown in Table 1, confocal immunohistochemistry found P-450-deficient neurons in the ventrolateral PAG, but not in other analgesia-related brain areas (Conroy, et al., 2010). The spinal cord was not studied.
Table 1.
P450 relevance for opioid analgesic circuits.
| Criteria | CNS Site | ||
|---|---|---|---|
| PAG | RVM | Dorsal Horn | |
| Sites containing neuronal CPR deficit in Null mice:a | Yes | No | n.d. |
| Sites where P450 blocker inhibits μ opioid analgesia:b | No | Yes | No |
| Site where DAMGO analgesia is reduced in Null mice:c | Yes | Yes | No |
The table summarizes three types of experiments characterizing the role of CNS P450 activity in opioid analgesia. Opioids act in the three CNS areas shown to produce analgesia, but the significance of P450 activity in each region was unclear. Brain CPR Null (Null) mice have selected losses of neuronal cytochrome P450 reductase (CPR) and show deficient analgesic responses to μ opioids (Fig. 1). As depicted in the Table, Null neurons from the PAG were shown to lack CPR, and therefore lack normal P450 activity. However, P450 blockers antagonize opioid analgesia when injected into the RVM, but not into the PAG. In addition, Null mice show defective analgesia when opioids are injected into either the PAG (Fig. 3) or the RVM (Fig. 4). Taken together, the experiments show that terminals within the RVM from RVM-projecting PAG neurons contain the opioid-relevant P450 activity, and that μ opioid actions in both the PAG and the RVM utilize these terminals for pain relief. Fig. 6 illustrates these concepts.
N.d., not determined.
A second approach outlined in Table 1 used intracerebrally-administered P450 inhibitors to identify the CNS areas containing analgesia-related P450s. Results showed that intra-RVM, but not intra-PAG or intrathecal P450 blockers inhibit opioid analgesia (Conroy, et al., 2013). Integration of these findings with the histochemical results of Table 1 suggests that P450 – containing neurons in the ventrolateral PAG project to the RVM, where P450-containing terminals participate in activating descending, pain-relieving neurons following opioid administration.
Since opioids act on μ opioid receptors in the PAG, RVM and lumbar dorsal horn to relieve pain (Heinricher and Ingram, 2008), it was still not clear which of these receptors would use the P450-containing terminals of the RVM. As summarized in Table 1, the present data (Figs. 3–4) show that both intra-PAG and intra-RVM DAMGO injections evoke analgesia which requires this RVM P450 mechanism. In contrast, two kinds of experiments indicate that stimulation of spinal μ opioid receptors does not require P450 activity to relieve pain (Conroy, et al., 2013 and Fig. 5). Collectively, the findings of Table 1 imply that opioid analgesia produced by activation of μ opioid receptors in both the PAG and the RVM depends upon P450-containing RVM terminals originating from neurons in the ventrolateral PAG.
Suppl. Fig. 1 depicts a schematic of proposed opioid analgesic circuits of the brain stem and localizes the P450-relevant components of these circuits based on Table 1. As shown, acute analgesic activity of μ opioids administered into the PAG or the RVM occurs by inhibition of spinal nociceptive processing via activation of RVM “OFF” cells. The diagram illustrates three mechanisms (#1, #2, #4) by which opioids in the PAG and/or RVM lead to activation of these cells. The mechanisms consist of combinations of excitatory / inhibitory and pre- and post-synaptic μ opioid receptor sites of action (Suppl. Fig. 1). As summarized from Table 1, RVM terminals from PAG-projecting, inhibitory neurons (shown in red terminals of mechanism #4, Suppl. Fig. 1) are depicted as the site of the P450 requirement of opioid actions. The model is consistent with the following findings: 1) Selected PAG neurons from morphine-resistant, Null mice lack microsomal P450 activity (due to the absence of CPR, Conroy, et al., 2010). In Suppl. Fig.1, these P450-containing cells are designated as the GABAergic neurons in circuit #4. 2) P450 inhibitor injections into the RVM (but not into the PAG or into the spinal subarachnoid space) of normal mice attenuate opioid analgesia (Conroy, et al., 2013). 3) DAMGO injections into either the PAG or the RVM (but not into the spinal subarachnoid space) evoke deficient analgesic responses in Null mice (Figs. 3, 4). Opioids are likely to use more than one of these mechanisms (Heinricher, et al., 2001; Morgan, et al., 2008).
The epoxygenase hypothesis of opioid analgesia postulates that μ opioid receptor signaling in the brain utilizes a P450-dependent epoxidation of a fatty acid (e.g. arachidonic acid, Conroy, et al., 2010). The present results support this hypothesis for analgesic responses and localize this reaction to RVM-projecting terminals of PAG neurons. Ongoing studies seek to identify analgesic epoxidation products (e.g. Terashvili, et al., 2008), as well as the specific analgesia-relevant P450 isoforms/genes. New kinds of pain relievers are being developed based upon the analgesic activity of lipid epoxides and congeners (Brostram and Falck, 2011;Piomelli, et al., 2014).
4. Experimental procedure
4.1. Animals
Although mice contain over 100 functional P450 genes (Nelson, et al., 2004), cytochrome P450 reductase (CPR, encoded by the Cpr [also known as Por] gene) is required for all microsomal P450 activity. Because of this, tissue-specific inactivation of P450 has been achieved through deletion of Cpr. Brain neuron-specific P450-deficient mice (designated here as Null) were generated by targeted deletion of the loxP-flanked Cpr gene in Cre-expressing brain neurons (via Camk2a-cre, under control of the Camk2a promoter) as described (Conroy, et al., 2010). Null (Cre+/− Cprlox/lox) and wild-type control (Cre−/− Cprlox/lox) adults (either sex, as specified, greater than 10 weeks of age) were used for all studies. Animals were maintained on a 12-h light/ dark cycle (lights on from 0700 to 1900), provided with food and water and housed in groups of 3–5 until the time of surgery. Genotypes were verified by PCR. All animal experiments were approved by the Institutional Animal Care and Use Committee of Albany Medical College.
4.2. Drugs and solutions
Tris, HCl, MgCl2, EGTA, NaCl, guanosine-5’-diphosphate sodium salt, BSA, adenosine deaminase, guanosine 5′-O-(3-thiotriphosphate) tetralithium salt (GTPγS) and DAMGO acetate were purchased from Sigma Aldrich (St. Louis, MO). [35S]-GTPγS was purchased from PerkinElmer (Boston, MA). Ecoscint was purchased from National Diagnostics (Atlanta, GA). DAMGO acetate was dissolved in saline for all experiments.
4.3. Surgery
Cannulas were chronically implanted for intracerebroventricular (icv) and intracerebral microinjections. Following anesthesia with pentobarbital sodium (50 mg/kg, i.p., supplemented with isoflurane), stainless steel guide cannulae were stereotaxically inserted into either the lateral ventricle, the PAG, or the RVM. Coordinates for these placements were AP −0.5, ML −1.0, DV −2.0 mm (icv); AP −6.0, ML 0, DV −3.5 mm (RVM), and (AP [26 degrees from vertical] −4.8, ML 1.0, DV −0.7 mm (PAG) from Bregma (Paxinos and Franklin, 2001). Cannulae were anchored to the skull with stainless steel screws and dental cement. After surgery, subjects were individually housed and were allowed to recover for at least 5 to 7 days before testing.
4.4. Intracerebral and icv drug injections
Animals were gently secured using a laboratory pad, the cannula stylet removed, and the injection cannula inserted. The injection cannula extended 1 mm beyond the guide. Injections were administered in a 2 µl (icv) or 100 nl (RVM and PAG) volume over a 1 min period. One min after the end of the infusion, the injection cannula was clipped and sealed approximately 2 mm above the juncture with the guide cannula. Successful injections were verified by following the movement of an air bubble in the tubing. After testing, animals received pentobarbital sodium (100 mg/kg, i.p.) and India Ink (0.1 to 2 µl). Brains were removed, and sectioned to verify proper distribution of the ink in the cerebroventricular system (icv) or to localize the specific area of drug delivery (PAG and RVM). Subjects with poor placements or unsuccessful injections comprised less than 10% of the experimental population, and data from these subjects were excluded. Each animal was used for a single experiment.
4.5. Intrathecal drug injections
Intrathecal injections were made exactly as described (Hylden and Wilcox, 1980). Briefly, Injections were made with 30 gauge syringes in conscious subjects at the level of L4/L5 with a total of 5 µl of solution injected over 30 s. The subject is secured by holding the pelvic girdle in one hand while holding the syringe at a 20 ° angle above the vertebral column with the other. As described below, subjects were tested both before and after injections.
4.6. Nociceptive testing
The hot water tail immersion test was used to measure DAMGO analgesia (Sewell and Spencer, 1976). Briefly, subjects were restrained in a conical polypropylene tube, the tip of the tail immersed (2–3 cm) into a 55°C water bath, and latency to sudden tail movement or removal of the tail from the water was recorded. Cutoff latencies were 8s. Subjects were baseline tested once, received a single icv, intracerebral, or intrathecal injection, and were re-tested as described in the figure legends. Subjects were only used for a single experiment.
4.7. GTPγS Binding Assay
GTPγS activity in whole brain and regional membrane preparations was assessed using a modification of a previously described method (DiMarzo, et al., 2000). Animals were euthanized with CO2, brains and spinal cords removed, and homogenized in 19 volumes of ice-cold homogenate buffer (50 mM Tris-HCl, 3 mM MgCl2, 0.2 mM EGTA, pH 7.4) using an Ultra-Turrax T25 (IKA Works, Wilmington, NC) or Tissue Master 125 (OMNI International, Kennesaw, GA) homogenizer. Samples were centrifuged (Beckman Coulter, 42,000 g for 15 min) at 4°C. The supernatant was removed, the sample resuspended in 19 volumes of homogenate buffer, centrifuged a second time and the supernatant discarded. The resulting pellet was then suspended in assay buffer without BSA (50 mM Tris-HCl, 3 mM MgCl2, 0.2 mM EGTA, 100 mM NaCl) and aliquots stored at −80°C until use. On the day of assay, aliquots were thawed, kept on ice, diluted with assay buffer containing 0.1% BSA and homogenized. All samples were pre-incubated with adenosine deaminase (0.01 U/ml) at 30°C for 10 min. Samples were centrifuged as described, the supernatant discarded, and the pellet re-suspended in assay buffer with 0.1% BSA for use in GTPγS binding assays. Membranes were assayed in 1 ml final volume with assay buffer containing 0.1% BSA, 30 µM GDP, 0.05 nM [35S]GTPγS (1,250 Ci/mmol) and DAMGO as specified; unlabeled 10 µM GTPγS was added to determine nonspecific binding. Samples were incubated at 30°C for 2 hr. Incubation was terminated by filtration using a 24 well Brandell Cell Harvester (Gaithersburg, MD) onto presoaked Whatman GF/B glass-fiber filters subsequently rinsed with 10 ml ice cold assay buffer with 0.1% BSA. Filters were placed in 7 ml scintillation vials with 5 ml Ecoscint, allowed to sit 3 hr then counted using a Beckman scintillation counter.
Percent increase in GTPγS binding was calculated as:
Protein content was determined from samples stored in assay buffer without BSA using a bicinchoninic acid colorimetric method (Thermo Fisher Scientific, Waltham, MA).
4.8. Data analysis
All data were analyzed by the analysis of variance (ANOVA), followed by Neuman-Keuls post-hoc testing where permitted (Statistica, StatSoft, Tulsa, OK). Comparisons involving two groups only were made by use of the Student’s unpaired t-test. Dose-response curves were generated by non-linear regression with Prism 5.0 software (Graphpad, San Diego, CA).
Supplementary Material
Opioids act at spinal, brain stem and non-brain stem CNS sites to relieve pain.
Critical areas are the periaqueductal grey (PAG) and rostral ventral medulla (RVM).
Mu opioid analgesia requires neuronal cytochrome P450 activity.
Nerve-terminal P450s in PAG-RVM projection neurons participate in opioid analgesia.
Spinal opioid analgesia does not require neuronal cytochrome P450 activity.
Acknowledgments
This work was supported by a grant from the National Institutes of Health National Institute on Drug Abuse (Grant DA027835).
Abbreviations
- ANOVA
analysis of variance
- CPR
cytochrome P450 reductase
- DAMGO
[D-Ala2, N-Me-Phe4, Gly5-ol]-enkephalin acetate
- GTPγS
guanosine 5′-O-(3-thiotriphosphate) tetralithium salt
- icv
intracerebroventricular
- Null
neuronal cytochrome P450 reductase deficient
- PAG
periaqueductal gray
- P450
cytochrome P450 monooxygenase
- RVM
rostral ventromedial medulla
Footnotes
Publisher's Disclaimer: This is a PDF file of an unedited manuscript that has been accepted for publication. As a service to our customers we are providing this early version of the manuscript. The manuscript will undergo copyediting, typesetting, and review of the resulting proof before it is published in its final citable form. Please note that during the production process errors may be discovered which could affect the content, and all legal disclaimers that apply to the journal pertain.
The authors declare no competing financial interests.
REFERENCES
- Brostram L, Falck JR. Arachidonic acid analogs and methods for analgesic treatment using same. PCT/US2010/058041(WO/2011/066414) WI, USA: [3-6-2011];CYTOMETIX, INC. :1–58.
- Conroy JL, Fang C, Gu J, Zeitlin SO, Yang W, VanAlstine MA, Nalwalk JW, Albrecht PJ, Mazurkiewicz JE, Snyder-Keller A, Shan Z, Zhang S, Wentland MP, Behr M, Knapp BI, Bidlack JM, Zuiderveld OP, Leurs R, Ding X, Hough LB. Opioids activate brain analgesic circuits through cytochrome P450/epoxygenase signaling. Nature Neuroscience. 2010;13:284–286. doi: 10.1038/nn.2497. [DOI] [PMC free article] [PubMed] [Google Scholar]
- Conroy JL, Nalwalk JW, Phillips JG, Hough LB. CC12, a P450/epoxygenase inhibitor, acts in the rat rostral, ventromedial medulla to attenuate morphine antinociception. Brain Res. 2013;1499:1–11. doi: 10.1016/j.brainres.2012.12.030. [DOI] [PMC free article] [PubMed] [Google Scholar]
- Di Marzo V, Breivogel CS, Tao Q, Bridgen DT, Razdan RK, Zimmer AM, Zimmer A, Martin BR. Levels, metabolism, and pharmacological activity of anandamide in CB(1) cannabinoid receptor knockout mice: evidence for non-CB(1), non-CB(2) receptor-mediated actions of anandamide in mouse brain. J Neurochem. 2000;75:2434–2444. doi: 10.1046/j.1471-4159.2000.0752434.x. [DOI] [PubMed] [Google Scholar]
- Ferguson CS, Tyndale RF. Cytochrome P450 enzymes in the brain: emerging evidence of biological significance. Trends Pharmacol Sci. 2011;32:708–714. doi: 10.1016/j.tips.2011.08.005. [DOI] [PMC free article] [PubMed] [Google Scholar]
- Heinricher MM, Ingram SL. The Brainstem and Nociceptive Modulation. In: Basbaum AI, Bushnell MC, Julius D, editors. The Senses: A Comprehensive Reference. Volume 5: Pain. New York: Elsevier; 2008. pp. 593–626. [Google Scholar]
- Heinricher MM, Schouten JC, Jobst EE. Activation of brainstem N-methyl-D-aspartate receptors is required for the analgesic actions of morphine given systemically. Pain. 2001;92:129–138. doi: 10.1016/s0304-3959(00)00480-2. [DOI] [PubMed] [Google Scholar]
- Hough LB, Nalwalk JW, Cleary RA, Phillips JG, Fang C, Yang W, Ding X. Deficits in neuronal cytochrome P450 activity attenuate opioid analgesia but not opioid side effects. Eur J Pharmacol. 2014a;740:255–262. doi: 10.1016/j.ejphar.2014.07.028. [DOI] [PMC free article] [PubMed] [Google Scholar]
- Hough LB, Nalwalk JW, Yang W, Ding X. Significance of neuronal cytochrome P450 activity in opioid-mediated stress-induced analgesia. Brain Res. 2014b;1578:30–37. doi: 10.1016/j.brainres.2014.07.007. [DOI] [PMC free article] [PubMed] [Google Scholar]
- Hylden JL, Wilcox GL. Intrathecal morphine in mice: a new technique. Eur J Pharmacol. 1980;67:313–316. doi: 10.1016/0014-2999(80)90515-4. [DOI] [PubMed] [Google Scholar]
- Law PY. Opioid Receptor Signal Transduction Mechanims. In: Pasternak GW, editor. The Opioid Receptors. New York: Humana Press; 2011. pp. 195–238. [Google Scholar]
- Lund EG, Xie C, Kotti T, Turley SD, Dietschy JM, Russell DW. Knockout of the cholesterol 24-hydroxylase gene in mice reveals a brain-specific mechanism of cholesterol turnover. J Biol Chem. 2003;278:22980–22988. doi: 10.1074/jbc.M303415200. [DOI] [PubMed] [Google Scholar]
- Morgan MM, Whittier KL, Hegarty DM, Aicher SA. Periaqueductal gray neurons project to spinally projecting GABAergic neurons in the rostral ventromedial medulla. Pain. 2008;140:376–386. doi: 10.1016/j.pain.2008.09.009. [DOI] [PMC free article] [PubMed] [Google Scholar]
- Morisseau C, Hammock BD. Impact of soluble epoxide hydrolase and epoxyeicosanoids on human health. Annu Rev Pharmacol Toxicol. 2013;53:37–58. doi: 10.1146/annurev-pharmtox-011112-140244. [DOI] [PMC free article] [PubMed] [Google Scholar]
- Nelson DR, Zeldin DC, Hoffman SM, Maltais LJ, Wain HM, Nebert DW. Comparison of cytochrome P450 (CYP) genes from the mouse and human genomes, including nomenclature recommendations for genes, pseudogenes and alternative-splice variants. Pharmacogenetics. 2004;14:1–18. doi: 10.1097/00008571-200401000-00001. [DOI] [PubMed] [Google Scholar]
- Paxinos G, Franklin KBJ. The Mouse Brain in Stereotaxic Coordinates. San Diego: Academic Press; 2001. [Google Scholar]
- Piomelli D, Hohmann AG, Seybold V, Hammock BD. A lipid gate for the peripheral control of pain. J Neurosci. 2014;34:15184–15191. doi: 10.1523/JNEUROSCI.3475-14.2014. [DOI] [PMC free article] [PubMed] [Google Scholar]
- Sewell RDE, Spencer PSJ. Antinociceptive activity of narcotic agonist and partial agonist analgesics and other agents in the tail-immersion test in mice and rats. Neuropharmacol. 1976;15:683–688. doi: 10.1016/0028-3908(76)90037-x. [DOI] [PubMed] [Google Scholar]
- Spector AA. Arachidonic acid cytochrome P450 epoxygenase pathway. J Lipid Res. 2009;50(Suppl):S52–S56. doi: 10.1194/jlr.R800038-JLR200. [DOI] [PMC free article] [PubMed] [Google Scholar]
- Terashvili M, Tseng LF, Wu HE, Narayanan J, Hart LM, Falck JR, Pratt PF, Harder DR. Antinociception produced by 14,15-epoxyeicosatrienoic acid is mediated by the activation of {beta}-endorphin and Met-enkephalin in the rat ventrolateral periaqueductal gray. J Pharmacol Exp Ther. 2008;326:614–619. doi: 10.1124/jpet.108.136739. [DOI] [PMC free article] [PubMed] [Google Scholar]
- Vaughan CW, Ingram SL, Connor MA, Christie MJ. How opioids inhibit GABA-mediated neurotransmission. Nature. 1997;390:611–614. doi: 10.1038/37610. [DOI] [PubMed] [Google Scholar]
- Wagner K, Inceoglu B, Dong H, Yang J, Hwang SH, Jones P, Morisseau C, Hammock BD. Comparative efficacy of 3 soluble epoxide hydrolase inhibitors in rat neuropathic and inflammatory pain models. Eur J Pharmacol. 2013;700:93–101. doi: 10.1016/j.ejphar.2012.12.015. [DOI] [PMC free article] [PubMed] [Google Scholar]
- Williams JT, Ingram SL, Henderson G, Chavkin C, von ZM, Schulz S, Koch T, Evans CJ, Christie MJ. Regulation of mu-opioid receptors: desensitization, phosphorylation, internalization, and tolerance. Pharmacol Rev. 2013;65:223–254. doi: 10.1124/pr.112.005942. [DOI] [PMC free article] [PubMed] [Google Scholar]
- Wu L, Gu J, Weng Y, Kluetzman K, Swiatek P, Behr M, Zhang QY, Zhuo X, Xie Q, Ding X. Conditional knockout of the mouse NADPH-cytochrome P450 reductase gene. Genesis. 2013;36:177–181. doi: 10.1002/gene.10214. [DOI] [PubMed] [Google Scholar]
- Zhang Z, Pan ZZ. Signaling cascades for delta-opioid receptor-mediated inhibition of GABA synaptic transmission and behavioral antinociception. Mol Pharmacol. 2012;81:375–383. doi: 10.1124/mol.111.076307. [DOI] [PMC free article] [PubMed] [Google Scholar]
Associated Data
This section collects any data citations, data availability statements, or supplementary materials included in this article.


