

Abstract
In this study, we have shown for the first time the effectiveness of a non-viral gene transfection strategy to re-polarize macrophages from M1 to M2 functional sub-type for the treatment of rheumatoid arthritis (RA). An anti-inflammatory (IL-10) cytokine encoding plasmid DNA was successfully encapsulated into non-condensing alginate based nanoparticles and the surface of the nano-carriers was modified with tuftsin peptide to achieve active macrophage targeting. Enhanced localization of tuftsin-modified alginate nanoparticles was observed in the inflamed paws of arthritic rats upon intraperitoneal administration. Importantly, targeted nanoparticle treatment was successful in reprogramming macrophage phenotype balance as ~66% of total synovial macrophages from arthritic rats treated with the IL-10 plasmid DNA loaded tuftsin/alginate nanoparticles were in the M2 state compared to ~9% of macrophages in the M2 state from untreated arthritic rats. Treatment significantly reduced systemic and joint tissue pro-inflammatory cytokines (TNF-α, IL-1β, and IL-6) expression and prevented the progression of inflammation and joint damage as revealed by magnetic resonance imaging and histology. Treatment enabled animals to retain their mobility throughout the course of study, whereas untreated animals suffered from impaired mobility. Overall, this study demonstrates that targeted alginate nanoparticles loaded with IL-10 plasmid DNA can efficiently re-polarize macrophages from an M1 to an M2 state, offering a novel treatment paradigm for treatment of chronic inflammatory diseases.
Keywords: IL-10 Gene Therapy, Macrophage Repolarization, Inflammation, Rheumatoid Arthritis, Alginate Nanoparticles, Targeted Delivery
1. INTRODUCTION
Rheumatoid arthritis (RA) is an autoimmune systemic disease associated with stiffness, pain, and swelling of several joints [1]. The disease is marked an infiltration of macrophages, T- and B-cells, dendritic cells, neutrophils, osteoclasts, fibroblasts, and chondrocytes, and over-expression of endothelial adhesion molecules [2, 3]. Severity of rheumatoid arthritis has been directly linked to the number of macrophages present in the arthritic synovium [4]. Macrophages from arthritic synovium secret inflammation promoting cytokines (e.g., IL-1β, IL-6, and TNF-α), growth factors (e.g., granulocyte macrophage colony stimulating factor, GM-CSF), and chemokines that contribute to bone erosion and tissue destruction [5, 6]. Such pro-inflammatory macrophage activation in the diseased state has been termed as M1-macrophage phenotype. Alternatively, macrophages involved with anti-inflammatory processes are considered to be depicting M2-state. Therefore, strategies that can effectively switch macrophage from predominant M1 in the synovium to M2 state may be potential for the treatment of rheumatoid arthritis.
Therapies involving macrophages have primarily focused on depletion of systemic and joint macrophages with clodronate-loaded liposomes [7]. However, this is not a viable strategy given the key role of these cells in immuno-surveillance. Towards that end, we decided to selectively modify the macrophage phenotype by delivering an anti-inflammatory cytokine (Interleukin 10) encoding plasmid DNA encapsulated into a nanoparticle system. Rationale for selecting gene therapy over conventional treatment was based on much safety profile of non-viral gene delivery platforms, limited success with disease modifying anti-rheumatic agents, and considerable side effects associated with biologics [8, 9]. Interleukin-10 (mIL-10) was chosen because of its pleiotropic anti-inflammatory properties [10, 11]. The efficacy of IL-10 gene delivery for the treatment of rheumatoid arthritis has been established in animal models using viral vectors [12, 13]. However, inherent problems associated with viral vectors, such as immunogenicity, oncogenic potential, and the relatively high cost of production has prompted researchers to design novel non-viral vectors [14]. We have previously reported the design of a novel gene delivery system using alginate, a natural occurring biocompatible polymer [15]. Alginate is a random block copolymer that is made up of (1→4) linked β-D-mannuronic acid (M) and α-L-guluronic acid (G) residues of widely varying composition and sequences, depending on the source of algae [16, 17]. An external gelation method was adopted and optimized to make alginate nanoparticles. To actively target macrophages, the surface of the alginate-based nanoparticle was decorated with tuftsin, a four amino acid peptide (with amino acid sequence L-threonine-lysine-proline-arginine), that interacts with macrophages and promotes phagocytosis by binding with Fc and neuropilin-1 receptors on macrophages [18, 19]. Tuftsin is formed by the enzymatic cleavage of the Fc portion of the immunoglobulin (IgG) molecule [20, 21]. Scrambled peptide (with amino acid sequence L-proline-threonine-lysine-arginine) modified nanoparticles along with additional treatment groups (listed in Table 1) were also used as for assessment of efficacy. Lastly, intra-peritoneal route was chosen as the preferred mode of administration to allow delivery into a blood free macrophage rich environment. Upon successful delivery, macrophages can act as Trojan horse vectors for the particles and ferry particles to the site of inflammation-arthritic joints (in this case). Previous study conducted by Howard et al [22] also conferred the effectiveness of such a strategy by demonstrating the superiority of chitosan polymer/TNF-α siRNA polyplex system in treatment of murine arthritis. In addition, the group mentioned that serum-protein induced polyplex aggregation was also avoided upon intra-peritoneal administration.
Table 1.
Highlighting Alginate Polymer Based Nanoparticle Treatments for Assessment of Therapeutic Efficacy
| Type of Treatment | Description |
|---|---|
| Blank-Tuftsin Modified Nanoparticles | Particle has the macrophage targeting peptide (tuftsin) but does not contain the therapeutic IL-10 encoding plasmid DNA |
| Unmodified Nanoparticle | Particles without peptide on surface but contain therapeutic IL-10 encoding plasmid DNA |
| Scrambled-Peptide Modified Nanoparticle | Particles with scrambled-peptide sequence containing therapeutic IL-10 encoding plasmid DNA |
| Tuftsin-Peptide Modified Nanoparticle | Particles with macrophage targeting-peptide sequence containing therapeutic IL-10 encoding plasmid DNA |
Collectively, our studies demonstrate that mIL-10 gene therapy targeted to macrophages in a tuftsin/alginate system reprogrammed the macrophage phenotype from a predominantly M1 (pro-inflammatory) to M2 (anti-inflammatory) phenotype, preventing the joint damage associated with adjuvant-induced arthritis.
2. EXPERIMENTAL MATERIALS AND METHODS
2.1 Materials
Medium viscosity grade sodium alginate (80–120 KDa), calcium chloride dihydrate, and indocyanine green (ICG) were purchased from Sigma Aldrich (St. Louis, MO). The peptide (M.W. ~1666 Da) sequences containing tuftsin and scrambled motifs were custom synthesized at the Tufts University’s Peptide Synthesis Core Facility (Boston, MA). A disk of lyophilized GT100 E. coli transformed with pORF5-mIL-10 plasmid DNA (3.7 kb) encoding the murine cytokine IL-10 (mIL-10) was obtained from Invitrogen (San Diego, CA). The transformed E. coli were grown in culture and the plasmid was harvested and purified using HiSpeed® plasmid purification Giga kit supplied by Qiagen (Valencia, CA). Primers specific for IL-1β, TNF-α, and β-actin were purchased from Eurofins MWG Operon (Huntsville, AL). The J774A.1 adherent murine macrophage cell line obtained from the American Type Culture Collection (ATCC; Manassas, VA) was cultured in Dulbecco’s modified Eagle medium (DMEM) (Cellgro, Manassas, VA) containing 10% fetal bovine serum (FBS) (HyClone, Logan, UT), and penicillin/streptomycin antibiotics (Gibco Invitrogen, Woburn, MA) at 37 °C and 5% CO2. Rabbit anti-CD163/M130 polyclonal antibody conjugated with Alexa Fluor 488 dye was purchased from Bioss Antibodies (Woburn, MA). Lipopolysaccharide (LPS) was purchased from Sigma (St. Louis, MO, USA) and murine interferon-gamma (IFN-γ) was obtained from PeproTech (Rocky Hill, NJ).
2.2 Induction of the Adjuvant-Arthritis in Male Lewis Rats upon Intra-Dermal Route of Administration
All animal studies were performed according to an approved protocol by Institutional Animal Care and Use Committee (IACUC) at Northeastern University. Male Lewis rats (150–170 g) were procured from Charles River Laboratories (Wilmington, MA) and allowed to acclimatize for two days. Arthritis was induced via inoculating the rats with 0.05 mL of the 10 mg/mL heat-killed Mycobacterium butyricum suspended in incomplete Freund’s adjuvant as described previously [23–25]. The suspension was injected at the base of the tail via intra-dermal administration. The animals were distributed randomly in various treatment groups once the first signs of inflammation (red spots across the paws) were observed at day 10. The rats were euthanized via thoracotomy as per the guidelines set forth by the Institutional Animal Care and Utilization Committee (IACUC) at Northeastern University. Nanoparticles containing 100 μg of mIL-10 pDNA dose were administered via intra-peritoneal route on day 12, post-adjuvant administration. Scheme 1 below highlights the time course of arthritis development and assessment time points
Scheme 1.

Depicting adjuvant-arthritis induced inflammation development profile including time point for administration of nanoparticle versions presented below and end point of the study for therapeutic evaluations.
2.3 Preparation and Surface Modification of DNA-Encapsulated Alginate Nanoparticles
An external gelation method was used to form the optimized blank and DNA-encapsulated calcium alginate nanoparticles. Briefly, 10 mL of sodium-alginate (0.1% w/v) solution was pre-mixed with the plasmid DNA (mIL-10) and 2 mL of 9 mM calcium chloride solution was added drop-wise to the alginate solution using a peristaltic pump while stirring at 800 rpm. After an hour of Ca2+ ion induced cross-linking, the nanoparticles were dialyzed overnight and freeze-dried. Blank nanoparticles were prepared similarly without the addition of any plasmid DNA. Following the preparation of blank and DNA-encapsulated nanoparticles, the surface of the nanoparticles was modified using 1 mg/mL of the peptide sequences with tuftsin and scrambled amino acid residues. The peptides had six positively charged L-arginine (i.e., RRRRRR) residues for anchoring to the negatively charged alginate nanoparticle surface, four L-glycine (i.e., GGGG) spacer residues, and either TKPR residues of tuftsin or PTKR residues of the scrambled sequence. The morphology of the targeted NPs was imaged by Transmission Electron Microscopy (TEM) (JEOL, Peabody, MA). Specimens were prepared by adding a suspension of the nanoparticles dropwise to a Formvar/carbon film grid followed by negative staining with 1% phosphoric tungstic acid and air drying.
2.4 In Vitro Study to Analyze CD163 Expression on Macrophages Using FACS Analysis
J774A1 macrophages at 80% confluency were plated in T25 flasks (400,000 cells per flask) and cultured at 37 °C and 5% CO2. The cells were polarized to M1 phenotype by incubating with LPS (100 ng/mL) and IFN-γ (100 ng/mL) for 6hours. The M1 macrophages were then transfected with plasmid IL10-encapsulated unmodified, scrambled, and tuftsin modified NPs at 40μg equivalent dose of plasmid IL 10 for 48 hours. The transfected M1 macrophages were then fixed in 4% formalin, followed by blocking non-specific binding with bovine albumin serum (3% w/v) at room temperature for 30min. The cells were stained with anti-CD163 antibody conjugated with Alexa Fluor 488 dye for 1hour at room temperature at a dilution of 1:200. The cells were then washed thrice with PBS for FACS analysis in FL1 channel using a BD FACScalibur instrument (San Jose, CA). The data were analyzed using Cell-Quest Pro software.
2.5 In Vivo Imaging of Control and Tuftsin-Modified Alginate Nanoparticles Following Intraperitoneal Administration
Biodistribution of control (unmodified and scrambled peptide-modified alginate nanoparticles) and tuftsin-modified alginate nanoparticles was assessed upon performing in vivo near-infrared (NIR) imaging. A NIR fluorophore, indocyanine green (ICG), was encapsulated into the alginate nanoparticles at 5% (w/w), followed by surface modification as described above. The ICG-loaded alginate nanoparticles were obtained after ultracentrifugation at 30,000 rpm for 30 min at 4°C, followed by lyophilization. The loading content of ICG was determined spectrophotometrically at a wavelength of 750 nm. The ICG-loaded control and tuftsin-modified nanoparticles in phosphate buffer saline (pH 7.4) (3 mL of 1 mg/mL nanoparticles) were injected intraperitoneally into naïve rats and arthritic rats at day 19 post-adjuvant administration. Whole body images were obtained from 1 hour to 24 hours after injection using the IVIS in vivo imaging system (Perkin Elmer Inc., Hopkinton, MA, USA). Images of various organs, including heart, kidney, liver, spleen, lung, and paws were also obtained after sacrifice of the rat 24 hours after injection.
2.6 Extraction, Collection, and Separation of Primary Synovial Macrophages from Joint Tissue
Joint samples were processed and synovial macrophages were extracted according to the previously established methods with slight modification [26, 27]. Upon sacrificing the animals, the hind paw tissues were excised, phalanges were removed, and tissue samples were collected from a total of five animals and cut into small pieces. Then, these hind paw pieces were placed into a 50mL centrifuge tube containing 10mL of sterile-filtered complete DMEM 1X media containing collagenase solution (collagenase type I/II (250 U/mL) and DNase-10μg/mL (purchased from Worthington biochemical corporation) as per previously described methods. The samples were then brought into a biosafety cabinet and placed into a 50mm petri-dish containing 5mL of the same media. The samples were further cut into smaller pieces to the best of the ability. The excised samples from the five animals were then placed into 15mL conical tube containing sterile-filtered complete DMEM 1X media (15 mL) containing collagenase solution (collagenase type I/II (250 U/ml) and DNase-10μg/ml (purchased from Worthington biochemical corporation). Hind paws (right and left) were placed in separate tubes to ensure complete digestion. The samples were then placed on a shaker incubator at 37 °C and agitated at 250 rpm for 2–2.5hours. Thereafter, the digested tissue was passed through a 70μm cell strainer fitted into a 50 ml conical tube. The cell suspension was then centrifuged at 2500 rpm for 10 min to collect the cell pellet. The tube and strainer were then washed twice with 10mL DMEM 1X complete without collagenase.
The cells were then treated with 3mL of ACK lysis buffer (Invitrogen, CA) for 5 min to remove red blood cells. Then, 9mL of complete DMEM media was added to the buffer. The suspension was then pelleted upon centrifugation (2500 rpm/8 min). The pellet was washed twice with complete DMEM 1X media. At this point, the cells collected from the five animals (10 paws) were combined and placed in a T-75 tissue culture flask, and incubated at 37 °C for 1 hour. Following incubation, non-adherent cells were removed. The flask was washed twice with cold 1X PBS and once with complete DMEM 1X. Then, the adherent cells were removed upon treatment with Accutase solution (Invitrogen, CA) as per the manufacturer’s instructions. The suspension was then centrifuged to collect the pellet. The pellet was then washed twice with cold PBS 1X and subjected to magnetic bead separation using Miltenyi Biotec system (Auburn, CA). Collected cell pellet was then re-suspended in 90 μL of proprietary Miltenyi buffer and stained with the 10 μL of CD11b-FITC-conjugated antibody according to the manufacturer’s recommendations (AbD Serotec, NC). The suspension was mixed and incubated for 20 min at 4 °C in a refrigerator under dark condition. Subsequently, the cells were washed wells to remove unbound primary antibody by adding 1 mL of buffer per 107 cells and centrifuge at 3000 rpm for 10 min. Supernatant was completely removed and cell pellet was re-suspended in 90 μL of buffer per one million cells. Afterwards, 10 μL of anti-FITC coated magnetic micro beads (Miltenyi Biotec, CA) was added and mixed well. The suspension was again incubated for 20 min at 4 °C in a refrigerator under dark condition. Cells were then washed by adding 1 mL of buffer and centrifuged at 3000rpms for 10 min. Supernatant was then removed and cells were re-suspended in 500 μL of buffer. The cells were then separated using magnetic cell sorting (MACS) apparatus (Miltenyi Biotec, CA) as per the manufacturer’s instructions.
2.7 RT-PCR Analysis to Evaluate Macrophage Polarity Profile
Macrophages collected via this process were subjected to RT-PCR analysis to evaluate the expression of M1 (CD86) and M2 (CD163) state markers. CD11b was used as a general marker for macrophages. β-actin was used as the internal control in the PCR experiments. Briefly, total RNA was isolated from the cell lysates with High Pure RNA Isolation Kit from Roche Applied Sc. (Indianapolis, IN). The reagents for first cDNA strand synthesis and DNA amplification were all purchased from Invitrogen and samples were processed as per guidelines mentioned in the respective kits. The validated primer sequences for β –actin (Refseq No. NM_031144) [28] were as follows:
Rat β–actin Forward Primer: ATGGTGGGTATGGGTCAGAA
Rat β–actin Reverse Primer: TCCATATCGTCCCAGTTGGT
Rat CD11b (NM_012711), CD86 (NM_020081), and CD163 (NM_001107887) primers were purchased from SA Biosciences (Valencia, CA).
The PCR was performed with the cDNA and primers. The samples were heated at 94°C for 5 minutes and 35 cycles of 94°C for 30 seconds, 56°C for 30 seconds, and 72°C for 30 seconds. The samples were subjected to gel electrophoresis and agarose gels were visualized using Kodak FX imager. Semi-quantitative analysis depicting the percentage of M1/CD11b and M2/CD11b across all treatment groups was obtained by calculating the band intensity values using NIH Image J software.
2.8 In Vivo Magnetic Resonance Imaging (MRI)
Imaging was performed to visualize the presence of edema in the joints as a function of day’s post-adjuvant administration. For this set of experiments, naïve rats, arthritic rats-no treatment, unmodified nanoparticles, and tuftsin-peptide modified nanoparticle treatment groups were considered as rest of the control groups were rendered ineffective. Three rats were used for each group. Prior to MRI scanning, each rat was anesthetized by 1.5–2.0% isoflurane carried by oxygen flowing at 1 L/min. A 7.0 Tesla spectrometer was used for image acquisition (Biospec® 70/20 USR, Bruker, Billerica, MA, USA). The scanner was equipped with a 72-mm Bruker quadrature transmitter/receiver coil. T1-weighted images were taken by the RARE Variable TR (RAREVTR) pulse sequence, and the parameters were as follows: multiple repetition time (TR)= 254.32 ms, 681.86 ms, 1282.121 ms, 2298.27 ms, and 7500.00 ms; Echo Time (TE) = 12.5 ms; field of view (FOV)-, 120mm × 40mm; number of slices-12; slice thickness-1.5 mm; matrix-128 × 256. The imaging was performed at day 0 (pre-arthritis induction scan), 18, 23, and 28 post-adjuvant administration. Quantitative analysis of the edema profile was done to obtain the T1 relaxivity measurements in milliseconds using MIVA® and ITKSNAP® softwares.
2.9 Tissue Histopathology Analysis
Tissue histopathology was conducted to determine the classical features of arthritis such as pannus formation, narrowing of the joint space, osteoclast infiltration, bone resorption, and cellular infiltration. The paws were fixed for 5 days in 10% neutral buffered formalin (Fisher Scientific) and then placed in CALFOR® decalcifying solution (Cancer Diagnostics, Inc.) for another six days. Forepaws were decaled for 2 days and the hind limbs were decaled for 3 days. They were then rinsed in water, trimmed of any extra tissue and processed overnight using a Tissue Tek® Vacuum Infiltration Processor (VIP). Processed samples were embedded in paraffin and sectioned on a microtome at 5μm. Slides were stained with Masson tri-Chrome dye to determine the features of arthritis. After the slides were prepared, bright field images were acquired with a BX51-TRF Olympus (Center Valley, PA) inverted microscope at 4X original magnification. The joint sections were provided to a certified histotechnician at Tufts University Veterinary School, Grafton, MA in a blinded fashion for processing sections and staining the slides. The images are representative of n=3 rats per treatment group.
2.10 Cytokine Determination in Synovial Tissue using qPCR
All the paws of the animals were excised and placed in the RNA later® solution (Invitrogen, Carlsbad, CA) in RNAse/DNAse free conical tubes and stored in −80°C refrigerator. Next day, the paws were thawed on ice and were flash frozen in liquid nitrogen. The paws were then grinded using an alloy steel mortar/pestle to obtain the joint powder, while maintaining the samples in liquid nitrogen contained in a styro-foam box. The tissue samples obtained were homogenized along with 1mL of Trizol™ (Invitrogen) in 4 mL sterile homogenization tubes. After letting sample sit on ice for 5 min, 200 μL of chloroform was added to each tube and the tubes were vortexed for 30 sec and then left on ice for another 10 min. Finally the tubes were centrifuged at 13,000 rpms for 20 min at 4 °C to separate the aqueous layer containing the mRNA from the organic layer containing the tissue proteins. The aqueous layer was carefully taken out of the tubes and added to another eppendorf tube containing equal volume of 70% (v/v) ethanol and gently mixed by swirling the tube up and down few times. Total RNA was then further purified using PureLink® RNA Mini Kit (Invitrogen, Carlsbad, CA). The isolated mRNA from the tissue samples described above was quantified by UV spectrophotometry using the Nano-Drop Instrument (Thermo Fisher Corp.). Briefly, the mRNA samples were diluted 1:100 with nuclease treated water and 3 μL of this sample was placed on the pedestal of the instrument. Optical density of the samples was then determined at 260 and 280 nm for RNA concentration. The absorbance ratio of 260/280 was used to calculate the purity of the obtained RNA sample. A range of 1.9–2 was considered as a quality check mark.
The cDNA synthesis was then carried out as per the guidelines provided in the First Strand cDNA Synthesis Kit (Invitrogen, Carlsbad, CA). In order to perform the DNA amplification, the tubes containing the cDNA were placed on ice-bath and these used for real time PCR. Real time PCR procedure was carried out in the following manner. Five μL of cDNA sample was added to new Eppendorf tubes to which was added 12.5 μL of Light-cycler® 480 SYBR Green I Master mix (Roche Applied Sc., Indianapolis, IN). To this mixture were added 7.5 μL of PCR grade water and 0.2 μM of primer set(s). β-actin was used as the internal control in the PCR experiments. The validated primer sequences for TNF-α (NM_012675) [29], IL-1β (NM_031512) [30], and β–actin were as follows:
Rat TNF-α Forward Primer: ACTCCCAGAAAAGCAAGCAA
Rat TNF-α Reverse Primer: CAGTTCCACATCTCGGATCA
Rat IL-1β Forward Primer: TGACCCATGTGAGCTGAAAG
Rat IL-1β Reverse Primer: AGGGATTTTGTCGTTGCTTG
Rat β–actin Forward Primer: ATGGTGGGTATGGGTCAGAA
Rat β–actin Reverse Primer: TCCATATCGTCCCAGTTGGT
Rat IL-10 (NM_012854) and IL-6 (NM_012589) primers were purchased from SA Biosciences (Valencia, CA).
The samples were heated at 95°C for 10 minutes and 45 cycles of 95°C for 10 seconds, 60°C for 10 seconds, and 72°C for 10 seconds. The samples were run in a barcoded 96-well format compatible with Light cycler® 480 PCR instrument. The samples were run in triplicates, analyzed via established ΔCt method, and expressed as relative cytokine: β–actin.
2.11 Serum Cytokine ELISA
Rat specific-cytokine kits for TNF-α, IL-1β, IL-6, and IL-10 were purchased from R&D Systems (Minneapolis, MN). The blood samples collected upon cardiac puncture at the end of study on day 18 and 28, post-adjuvant administration. The samples were allowed to sit at room temperature for 30 min and then centrifuged at 3500 rpm to collect the serum. The samples were then diluted as per the manufacturer’s instruction to determine the cytokine levels. The samples were tested with n=5 samples/group. The results were reported as mean ± standard deviation.
2.12 Measuring Body Weight Changes and Liver Histopathology
Periodic measurements of the body weight were performed upon injecting the control and macrophage-targeted nanoparticles containing IL-10 plasmid DNA via intra-peritoneal route of administration on day 12. Frequent body weight measurements were made through the course of the study. A total of 5 animals/group were used. The results were plotted as percent change in body weight as a function of day’s post-adjuvant administration for all the treatment groups. Liver samples were also collected for histo pathological analysis from animals under various treatment groups at the end of study on day 18. Tissue samples were fixed in 10% formalin and sent out to Tufts University Veterinary School, Grafton for H&E staining and analysis (n=3/treatment) in a blinded manner. The conclusions were made by the histotechnician in an independent fashion.
2.13 Statistical Analysis
Statistical significance of results was determined using one-way ANOVA and Tukey’s Multiple Comparison Test with a 95% confidence interval (p<0.05).
3. RESULTS
The particle size and morphology of plasmid IL10-encapsulated unmodified, scrambled, and tuftsin modified NPs measured by DLS and TEM, respectively. The average particle size of the unmodified NPs was 470 nm with a broad size distribution. The size was significantly decreased with narrow size distribution when the nanoparticle surface was modified with scrambled and tuftsin peptides, showing the values of 327.5 ± 3.5 nm and 299.7 ± 2.2 nm for scrambled-NPs and tuftsin-NPs, respectively (Fig. 1A). The TEM images showed that all nanoparticles were spherical in shape with diameters of 180–250 nm (Fig. 1B). The particle sizes determined by TEM were slightly smaller than the size measured by DLS. As reported previously, based on this method, mIL-10 encoding Plasmid DNA encapsulation efficiency into the nanoparticle matrix was reported to be ~60% [15]. Figure 1C shows uptake of plasmid IL10-encapsulated tuftsin-NPs in J774A.1 macrophages after 2 h of incubation. Strong green (FITC) signal of plasmid IL10 and red signal (Cy5.5) of tuftsin-NPs were visible in the cytoplasm, indicating that plasmid IL10-encapsulated tuftsin-NPs were effectively internalized by J774A.1 macrophages.
Figure 1. Tuftsin-modified alginate nanoparticles.

Characterization of plasmid IL10-encapsulated targeted alginate nanoparticles: size distribution (A), TEM image (B), and cellular uptake in J774A.1 macrophages after 2 h of incubation in which plasmid DNA was labeled with FITC (green), and alginate nanoparticles were conjugated with Cy5.5 (red) (C)
3.1 CD163 Surface Expression as M2 State Marker in Cultured Macrophages
To confirm the macrophage polarizing effect by plasmid IL10-encapsulated alginate NPs, we evaluated the change in the expression of CD163, a surface marker for M2 macrophages [31], of J774A.1 macrophages treated with plasmid IL10-encapsulated control (unmodified and scrambled-NPs) and tuftsin-NPs by FACS analysis. The histograms in Fig. 2A showed CD163 expression in J774A.1 macrophages (M1 state) transfected with plasmid IL10-encapsulated control and tuftsin-NPs. Compared to untreated macrophages, there was a shift in the histogram of the cells treated with plasmid IL10-encapsulated alginate NPs, indicating upregulation of M2 surface marker CD163 in macrophages treated with the NPs for 48hours. The tuftsin-NPs showed significant higher mean fluorescence intensity than the scrambled-NPs (Fig. 2B), indicating superior effect of the targeted NPs. However, the mean fluorescence intensity of unmodified NPs was insignificantly different from that of the tuftsin-NPs, indicating similar effect of unmodified and tuftsin-NPs in regulating M2 surface marker expression.
Figure 2. FACS analysis of M2 surface marker (CD163).

Histogram plot (A) and mean fluorescence intensity (B) of CD163 expression in J774A.1 macrophages transfected with plasmid IL10-encapsulated control (unmodified NPs and scrambled NPs) and targeted alginate nanoparticles.
3.2 In Vivo Near-IR Imaging of Control and Tuftsin-Modified Alginate Nanoparticles in Arthritic and Naïve Rats Following Intraperitoneal Administration
To evaluate the biodistribution of alginate nanoparticles in arthritic rats following intraperitoneal administration, indocyanine green (ICG) was encapsulated inside the nanoparticles (5% w/w) followed by surface modification with tuftsin or scrambled peptides. Figure 3A shows near infrared (NIR) images of naïve and arthritic rats at different time points from 1hour to 24hours post-IP injection of ICG-encapsulated control (unmodified and scrambled peptide-modified alginate nanoparticles) and tuftsin-modified alginate nanoparticles. At 1hour post-injection, fluorescence signal could be detected in the paws of arthritic rats injected with tuftsin-modified alginate nanoparticles while no signal was seen in the arthritic rat injected with control nanoparticles, indicating fast accumulation of tuftsin-modified alginate nanoparticles in the inflamed paws. At 2hour post-injection, an enhanced fluorescence signal was observed in the paws of the arthritic rats injected with the tuftsin-modified nanoparticles and this strong signal was retained up to 24hour post-injection. On the contrary, fluorescence signal was low in the arthritic rat injected with the control nanoparticles during 24 hour of the study. At 24 hour post-injection, the rats were sacrificed for ex vivo imaging of the paws and tissues (Figure 3B–C). The arthritic rat treated with tuftsin-modified nanoparticles showed strong fluorescence signal in the paws and livers. The fluorescence intensity in the paw was about 8-fold higher for tuftsin-modified nanoparticles compared to the control nanoparticles in arthritic rats. In arthritic rats treated with control nanoparticles, highest fluorescence signal was observed in liver while low signal was seen in other tissues and the paws. The results indicated that upon IP administration, the tuftsin-modified alginate nanoparticles were effectively accumulated in the inflamed paws of the arthritic rats. In contrast, very low fluorescence signal was observed in naïve rats injected with ICG-loaded control and tuftsin-modified nanoparticles, indicating that the nanoparticle accumulation was negligible following IP administration in naïve rats.
Figure 3. Near-IR imaging and biodistribution of control and tuftsin-modified alginate nanoparticles in arthritis bearing and naïve rats.

(A) In vivo images of arthritic and naïve rats after IP administration at day 19 post-adjuvant administration of ICG-loaded control and tuftsin-modified alginate nanoparticles. The images were taken at pre-injection, 1 hour, 2 hour, and 24 hours post-administration. (B) Ex vivo images of paws (P) and tissues (Lv: Liver, Lg: Lungs, K: Kidneys, H: Heart, S: Spleen) at 24 hours post-IP administration (C) Fluorescence intensity of the paws collected from arthritic and naïve rats at 24 hours post-administration. NP = nanoparticle formulation.
3.2 Synovial Macrophage Re-polarization in Adjuvant-Induced Arthritis Model
Assessing macrophage polarity and determining if treatment reprogramed the macrophage phenotype from the pro-inflammatory M1 phenotype to the anti-inflammatory M2 phenotype was central to our studies. To this end, we extracted synovial macrophages from the joints of naive and arthritic rats and performed PCR analysis, using CD11b as a general macrophage marker, CD86 as a M1 specific marker, and CD163 as a M2 specific marker. Figure 4 (top panel) shows the agarose gel image depicting the M1/M2 macrophage phenotype profile for various treatment groups. A very faint band for CD11b (Figure 4A) was observed in naïve rats, indicating that the macrophage population is not abundant in the synovial joint; there was low expression of both macrophage phenotypes. Semi-quantitative analysis revealed a similar percentage of about 16–19% for both CD86: CD11b (M1) and CD163: CD11b (M2) (bottom panel). In arthritic rats (Figure 4B), band intensity of the M1 marker (CD86) was significantly higher than that of the M2 marker (CD163). The semi-quantitative data showed that ~80% of the total macrophages (CD11b+) were the M1 phenotype and ~9% of macrophages were the M2 phenotype.
Figure 4. Synovial macrophage polarity profile for various control and targeted nanoparticle treatments containing murine IL-10 plasmid DNA evaluated via RT-PCR analysis.

Top Panel represents the agarose gel image of the PCR products for CD11b, CD86, CD163 and β-actin. The PCR product sizes are 146 bp, 99bp, 98bp, and 119 bp, respectively. β-Actin served as an internal control. Bottom Panel represents the ratio of the CD86: CD11b and CD163:CD11b to semi-quantitatively analyze the M1 and M2 percentage of total macrophages (positive for CD11b), respectively. The band intensity was calculated via NIH ImageJ software. The data is representative of macrophage population that was obtained by pooling together cells collected from hind paws of five animals per treatment group.
Similarly, out of the total macrophages (CD11b+), M1-state percentages ranged between 78–83% and M2 state percentages ranged from 9–13% for arthritic rats treated with naked IL-10 plasmid DNA (Figure 4C), treated with blank-tuftsin peptide modified nanoparticles without IL-10 plasmid DNA (Figure 4D) and treated with scrambled–sequence-peptide modified nanoparticles loaded with IL-10 plasmid DNA (Figure 4F). Approximately 46% of the total macrophage (CD11b+) cells were in the M2 state and 24% of CD11b+ cells in the M1-state for the unmodified (no tuftsin) nanoparticles loaded with IL-10 plasmid DNA treatment group (Figure 4E). This increase in M2 phenotype subsequent to effective IL-10 delivery was further extenuated after treatment with tuftsin-modified nanoparticles loaded with IL-10 plasmid DNA (Figure 4G); a very high percentage of macrophages expressed the M2 marker (~66%) and ~15% of CD11b+ cells expressed the M1 marker.
3.3 Caliper Measurements of Paw Width and Depth upon Treatment with Nanoparticles Containing IL-10 Plasmid DNA
Changes in paw width and depth were used as an assessment of inflammation in the adjuvant induced RA model that was developed for these studies. Figure 5A and 5B show the paw width and depth of arthritic rats treated with different nanoparticle formulations as a function of day’s post-adjuvant administration. The treatment was given at day 12 post-adjuvant administration. The data has been reported as the cumulative measurement of all the four paws of the animal. As per the figure, average percent increase in terms of paw width and depth of the arthritic-rat without treatment, and arthritic-rats treated with naked plasmid DNA, blank-tuftsin nanoparticle, and scrambled-peptide nanoparticle, showing the values in the range of 72–77% and 140–200%, respectively. At day 18, the percent increase for the unmodified nanoparticle treated animals were 17.9±3.0% (width) and 41.6±3.5% (depth), which was significantly increased to 68.2±11.7% and 129.9±10.3%, respectively, at day 28 post-adjuvant administration. In the tuftsin-peptide modified nanoparticle treated animals, the percent increase in paw width and depth at day 18 and 28 were 5.3±1.5% and 10.1±2.2% vs. 17.8±5.1% and 36.7±6.8%, respectively. The results indicated that paw width and depth for the tuftsin-peptide modified nanoparticle treated rats were significantly lower than those for unmodified nanoparticle treated group at day 18 and day 28, post adjuvant-administration (p<0.0001).
Figure 5. Qualitative assessment of treatment efficacy in terms of change in paw width (A) and depth (B) and animal mobility (C) due to inflammation in rats as a function of days post-adjuvant administration.

Paw width and depth values from the fore and hind limbs were combined to calculate the cumulative percent increase and reported as % Mean+/−Standard Deviation (n=20 paws/group). Differences between the arthritis-bearing rats with no treatment and control groups (naked IL-10 plasmid DNA, blank-tuftsin particles, scrambled-peptide modified IL-10 containing plasmid DNA particles) were not significant. ***p<0.0001 represents significant levels of differences while comparing arthritic rats (no treatment) to tuftsin-peptide modified IL-10 plasmid DNA containing nanoparticle treatment group and unmodified IL-10 plasmid DNA containing nanoparticle to tuftsin-modified IL-10 plasmid DNA containing nanoparticles. Corresponding images in panels A and B represent paw width and depth profiles for (a) arthritic rat (no treatment) at day 18 and IL-10 plasmid containing (b) unmodified nanoparticle treatment (day 28), (c) tuftsin-modified peptide nanoparticle treatment (day 28), and (d) naïve rats (No Arthritis-day 28) (top to bottom), respectively. (C) Beam-Walking Test -Average time to cross the 40 cm beam was recorded and plotted against days post-adjuvant administration. The values represented here are Mean+/−Standard deviation (n=5 rats/group). Animals in all the groups were conditioned to get used to the beam set-up on days 1, 3, and 5. The average values to cross the beam for rats within each treatment groups were recorded from day 7 onwards. Progression of inflammation in the arthritis-bearing rats hindered the animal movement. Animals treated with unmodified IL-10 plasmid containing particles maintained mobility till day 18, post-adjuvant administration and struggled to walk on the beam thereafter. Tuftsin-peptide modified IL-10 plasmid DNA containing nanoparticle treated rats maintained mobility till the end of study (day 28).
Paw width and depth values from the fore and hind limbs were combined to calculate the cumulative percent increase and reported as % Mean+/−Standard Deviation (n=20 paws/group). Differences between the arthritis-bearing rats with no treatment and control groups (naked IL-10 plasmid DNA, blank-tuftsin particles, and scrambled-peptide modified IL-10 containing plasmid DNA particles) were not significant. ***p<0.0001 represents significant levels of differences while comparing arthritic rats (no treatment) to tuftsin-peptide modified IL-10 plasmid DNA containing nanoparticle treatment group and unmodified IL-10 plasmid DNA containing nanoparticle to tuftsin-modified IL-10 plasmid DNA containing nanoparticles. Corresponding images in panels A and B represent paw width and depth profiles for the IL-10 plasmid containing unmodified nanoparticle treatment, tuftsin-modified peptide nanoparticle treatment, and naïve rats (No Arthritis) (top to bottom), respectively.
3.4 Beam Walking Test
A beam walking test was conducted to assess animal mobility at various time intervals in the naïve rat (disease free), after adjuvant induced RA, and following treatment with the different formulations. Video file shows the average time of conditioned animals to cross the beam at various time points spanning from 7 to 28 says post-adjuvant administration. Progressive inflammation adversely effects animal mobility. As shown in Figure 5C, on day 10 post-adjuvant administration, the animals in all treatment groups were able to traverse the entire length of the beam from 3–5 sec. However, after day 12, arthritic rats without treatment and control treatment groups (blank tuftsin nanoparticles, scrambled-peptide nanoparticle, and naked plasmid DNA) suffered from reduced mobility. The average time for the rats to cross the beam in the above groups was 11–16 sec. Subsequently, animals started crawling on their fore paws to cross the beam by day 14, to accommodate for their more severely affected hind limbs. The average times at day 14 were 42–56 sec. From day 16, these animals completely stopped walking on the beam and struggled to maintain balance. In contrast, for the unmodified nanoparticle and targeted nanoparticle treated groups, the values on day 18 were 3–5seconds, which was comparable to naïve rats. By day 23, the unmodified nanoparticle treatment group had developed inflammation and as a result animals struggled to walk on the beam. However, in the targeted nanoparticle treated group, the animals retained their mobility throughout the course of the study and crossed the beam in about 3–5sec.
3.5 T1-Weighted Magnetic Resonance Imaging
Imaging was performed to visualize the presence of edema in the joints as a function of day’s post-adjuvant administration. Figure 6A shows the T1-weighted magnetic resonance images of representative paws for the treatment groups as a function of days post adjuvant administration. Naïve rats did not show accumulation of fluid or the presence of edema in the paws. On the other hand, as indicated with dotted lines (high contrast), arthritic rats without treatment suffered from uncontrolled inflammation and significant fluid accumulation/edema. On day 18 post-adjuvant administration, there were no signs of edema in the paw of rat treated with unmodified nanoparticle and targeted nanoparticle, indicating the resistance of inflammation in these groups. Figure 6D compares the tissue relaxivity profile (T1-values in milliseconds) of the joints in various treatment groups. The relaxivity profile shows that baseline levels in the naïve animals were 1856.8±30.3 milliseconds [22] indicating the water proton spin relaxation time in a normal joint tissue of the rat. This value was used a guideline to compare the water relaxivity in other treatment groups. The average values observed in the arthritic rat-no treatment, unmodified nanoparticle, and tuftsin-modified nanoparticle treated groups were 2576.2±110.5 ms, 2184.6±84.9 ms, and 1858.5±29.3 ms, respectively. Higher relaxivity values were considered as an indicator of higher water content or edema in the joint tissues.
Figure 6. T1-weighted magnetic resonance imaging showing the presence of edema.

The scans were performed at days 18 (A), 23 (B), and 28 (C) post-adjuvant administration. Absence of bright contrast in paw scans of naïve rats (no disease) indicated no edema in the paws. At day 18, paw scans of arthritis-bearing animals (no treatment) showed bright contrast in both fore/hind paws (highlighted by dotted circles), which is indicative of marked edema or fluid accumulation. Similar pattern was observed for IL-10 plasmid DNA containing unmodified nanoparticles at days 23 and 28. Tuftsin-peptide modified nanoparticles containing IL-10 plasmid DNA showed pattern very similar to naïve rats till day 23. From day 28 onwards, edema was evident in the upper extremities of rats paws treated with tuftsin nanoparticles. (D) Quantitative analysis of the edema profile was performed by calculating the T1 relaxivity measurements in milliseconds using MIVA and ITKSNAP software. These value represent the water proton spin relaxation times in the biological tissue. T1 value calculated for joint samples in case of naïve rats (no arthritis) was found to be ~1850 ms. In the case of arthritic-bearing rats (no treatment), these values were relatively higher indicating more water content or edema in paws of these animals. The cumulative values for fore and hind paws were reported as Mean+/−Std. Dev (n=3 rats/group). NP = nanoparticle formulation.
At day 23 (Figure 6B), unmodified nanoparticle treated group had significant contrast coming from the paws, which was indicative of the massive inflammation/edema in the joints (fore and hind) of the rats. tuftsin-modified nanoparticle treated rats did not have any significant contrast in the paws. The relaxivity values for the unmodified nanoparticle and targeted nanoparticle groups were 2478±65.4 ms and 1899±48.6 ms, respectively.
Lastly, animals imaged on day 28 (Figure 6C) shows significantly enhanced contrast in the unmodified nanoparticle-nanoparticle treated rats were even more pronounced on day 18, indicating pronounced inflammation. The quantitative values for this group were observed to be 2636.8±44.2 ms. On the other hand, targeted nanoparticle treated animals showed a slight increase in the contrast, especially from the upper extremities of the hind paws. T1-values for this data point were found to be 2047±75.6 ms.
3.6 Histo-pathological Analysis to Evaluate Tissue Damage
The histology of excised paws was conducted to determine the classical features of arthritis such as pannus formation, narrowing of the joint space, osteoclast infiltration, bone resorption, and cellular infiltration. Figure 7A summarizes the histology results that were conducted on the excised paw samples upon euthanizing the animals on day 18, post-adjuvant administration. The histo-pathology profile shows that classical features of arthritis including cellular infiltration (C), narrowing of the joint space or pannus formation (P), high osteoclast activity (O) and subsequent bone resorption in arthritic rats, naked plasmid DNA treated rats, and scrambled-peptide modified treated rats, whereas no damage was observed in the naive rats. Similar arthritic features were also observed in the case of blank tuftsin-modified nanoparticles without the therapeutic IL-10 plasmid DNA (Data not shown). Similarly, the features of arthritis were not apparent in the paw samples collected from unmodified and tuftsin-peptide modified nanoparticle treated groups. Figure 7B depicts the day 28 histology profile for the naïve and the two nanoparticle treatments groups. Evidently, in the case of unmodified nanoparticle treatment group, it was observed that once the effect of plasmid DNA is exhausted, the inflammatory processes become more predominant causing swelling and subsequent joint damage. Joint tissues were marked by the presence of high osteoclast activity, pannus formation, and massive cellular infiltration. However, only initial signs of inflammation (mostly cellular infiltration) were observed in the tuftsin IL-10 nanoparticle treatment group.
Figure 7. Histology images evaluating features of arthritis.

Represents the Masson Trichrome stained sections of the fore and hind paws of the rats dosed i.p. with various treatment groups containing 100μg of murine IL-10 plasmid DNA at day 18 (A) and day 28 (B), post-adjuvant administration. Classical features of arthritis such as pannus formation (P), high osteoclast activity (O), cellular infiltration (C), and joint space narrowing (JS) are indicated with arrows/symbols in the two panels. pDNA-Plasmid DNA. Images are representive of n=3 rats per treatment group. NP = nanoparticle formulation. Scale Bar = 400μm.
3.7 Local Joint Tissue Cytokine Profile
To assess the anti-inflammatory effect of IL-10 plasmid DNA therapy, levels of IL-10 and pro-inflammatory cytokines (TNF-α, IL-1β, IL-6) were measured in the joint tissue of the treatment groups. Figure 8A–D represents the relative cytokine: β-actin ratios for the different treatment groups at days 18 and 28, post-adjuvant administration. Samples were not collected post day 28 as signs of inflammation were observed in targeted nanoparticle group. Levels of pro-inflammatory cytokines for the arthritic rats with no treatment and control groups (naked IL-10 plasmid DNA, blank tuftsin nanoparticle, and scrambled-peptide modified IL-10 plasmid DNA containing nanoparticle) was significantly higher compared to treated groups. For example, ratios of TNF-α: β-actin, IL-1β: β-actin, and IL-6: β-actin were 8.5±0.8, 13.2±1.1, and 1.1±0.6, respectively in arthritic rats while the ratio of IL-10: β-actin was 0.25±0.05. The levels of pro-inflammatory cytokines were significantly reduced in the unmodified IL-10 nanoparticle and tuftsin-IL-10 nanoparticle treated rats (***p<0.0001). The ratios of TNF-α: β-actin, IL-1β: β-actin, and IL-6: β-actin were 0.55±0.29, 0.30±0.12, and 0.49±0.26, respectively for the unmodified IL-10 nanoparticle treated group. Similarly, the ratios were 0.24±0.05, 0.24±0.05, and 0.13±0.11 for the tuftsin IL-10 nanoparticle treated group. In contrast, the ratio of IL-10: β-actin was found to be 2.19±0.49 and 3.82±0.43 for the unmodified nanoparticle and targeted nanoparticle treated group, respectively. This is indicative of successful and prolonged genetic therapy with IL-10 plasmid DNA delivered in these two systems.
Figure 8. Comparison of joint tissue cytokine profile by quantitative PCR.

Joint tissue sections were excised at days 18 (indicated in black bars) and 28 (indicated in gray bars), post-adjuvant administration and analyzed for local cytokine expression. The levels are expressed as ratio of TNF-α (A), IL-1β (B), IL-6 (C), and IL-10 (D) cytokines to β-actin and reported as arbitrary units (a.u.). Beta-actin was used as an internal loading control. The values are presented as Mean ± S.D. (n=12 paws/group). ***p<0.0001. Treatment with tuftsin-modified nanoparticles containing murine IL-10 cytokine plasmid DNA at 100μg dose resulted in sustained transgene expression at the local site and accordingly, expression of pro-inflammatory markers were alleviated. Samples were not collected past day 28, post-adjuvant administration as the signs of inflammation were observed in the targeted nanoparticle group accompanied with loss of body weight.
At day 28, the ratio of IL-1β: β-actin (3.92±0.33) and IL-6:β-actin (1.70±0.38) were significantly higher in the case of unmodified nanoparticles as compared to tuftsin-modified particles (***p<0.0001). Accordingly, the ratio of IL-10:β-actin was also significantly lower in the unmodified nanoparticle (0.21±0.06) vs. tuftsin-modified nanoparticle (1.41±0.15) treated group. This implies that surface modification of the nanoparticles with tuftsin is beneficial in prolonging the IL-10 transgene expression relative to the unmodified nanoparticles.
3.8 Serum Cytokine Analysis
Serum cytokine analysis of IL-10 and pro-inflammatory markers was performed to assess the effects of genetic therapy beyond local joint tissue. Figure 9A–D represents the serum cytokine profile for different groups at days 18 and 28. Samples were not collected post day 28 as signs of inflammation were observed in targeted nanoparticle group. The TNF-α (121.2±6.2 pg/mL), IL-1β (183.7±1.7 pg/mL), and IL-6 (166.4±16.7 pg/mL) levels for the arthritis group (no treatment) were in accordance with the qPCR data. The range for these cytokines for the control groups (naked IL-10 plasmid DNA, blank tuftsin nanoparticle, and scrambled-peptide modified IL-10 plasmid DNA containing nanoparticle) was 102–143 pg/mL (TNF-α), 125–177 pg/mL (IL-1β), and 174–182 pg/mL (IL-6). The levels of IL-10 (54.6±2.31 pg/mL) were suppressed and comparable to normal rats. Similar, IL-10 levels were observed for control groups including arthritis-bearing rats (no-treatment). The levels of TNF-α, IL-1β, and IL-6 for the unmodified IL-10 nanoparticle treatment group were calculated to be 81.2±12.8 pg/mL, 95.9±3.64 pg/mL, and 97.2±14.6 pg/mL, respectively. Serum IL-10 was calculated to be 108.4±1.96 pg/mL. For tuftsin-IL-10 nanoparticle’s, the levels of TNF-α, IL-1β, IL-6, and IL-10 were 56.9±6.30 pg/mL, 62.4±5.60 pg/mL, 76.5±14.8 pg/mL, and 155.4±5.74 pg/mL, respectively. Successful transfection of IL-10 plasmid DNA using the unmodified IL-10 nanoparticle and tuftsin modified delivery systems was apparent with the significant reduction in pro-inflammatory cytokine levels relative to control groups (***p<0.0001).
Figure 9. Serum Cytokine-Specific ELISA.

Represents the serum levels of the pro/anti-inflammatory cytokines expression in different treatment groups at Day 18 (indicated in black bars) and 28 (indicated in gray bars), post-adjuvant administration. The values are presented as Mean ± S.D. (n=5 animals/group). Elevated levels of pro-inflammatory cytokines (A–C) were observed in arthritis-bearing rats (no treatment), naked plasmid DNA, blank-tuftsin-peptide modified nanoparticle, and scrambled-peptide modified nanoparticle treatment groups. Significant higher serum levels of IL-10 obtained in case of tuftsin-modified nanoparticle treatment led to delay in the onset of inflammation. ***p<0.0001, *p<0.01. Samples were not collected past day 28, post-adjuvant administration when the signs of inflammation were observed in the targeted nanoparticle group accompanied with loss of body weight.
The levels of pro- and anti-inflammatory cytokines were also calculated for the unmodified IL-10 nanoparticle and tuftsin IL-10 nanoparticle groups at day 28. Levels of TNF-α (28.9±0.99 pg/mL and 30.7±1.55 pg/mL) were comparable; however, the levels of IL-1β and IL-6 were significantly higher in the unmodified IL-10 nanoparticle group as compared to the tuftsin IL-10 nanoparticle group due to inflammation associated with the disease state (***p<0.0001). This was marked by significantly lower expression of the transgene IL-10 in the unmodified nanoparticle IL-10 (38.1±2.63 pg/mL) treatment group as compared to tuftsin IL-10 nanoparticle (67.9±5.73 pg/mL) treatment. Similar to the local joint tissue analysis, serum cytokine analysis demonstrates that surface modification of the nanoparticles with tuftsin enables a prolonged effect and sustained IL-10 genetic therapy compared to unmodified nanoparticles.
3.9 Changes in Body Weight Measurements and Liver Toxicity
Figure 10 (Left) shows that the arthritis-induced rats tend to lose weight rapidly once the disease starts to progress from day 9–10 onwards. As per the IACUC guidelines, one of the main reasons of curtailing the studies at day 18 (post-adjuvant administration) was that the disease-induced animals lose 15% of their body weight. Similar phenomenon was observed in the case of control treatment groups, where the average percentage loss was found to be between 12–15%. Unmodified nanoparticle containing IL-10 plasmid DNA treatment caused a transient stabilization of the body weight. On the other hand, animals treated with tuftsin-modified nanoparticles gained weight till day 23. Although; towards the end of the study, the body weight started to decline and between day 23 and 28, the rats lost ~4.3% of the body weight as the transient therapeutic effect of anti-inflammatory IL-10 cytokine started to diminish. Consequently, inflammation started to progress, which explains the dramatic loss in body weight for the tuftsin-modified nanoparticle treated rats.
Figure 10. Safety and tolerability of the control and macrophage-targeted nanoparticles containing IL-10 plasmid DNA.
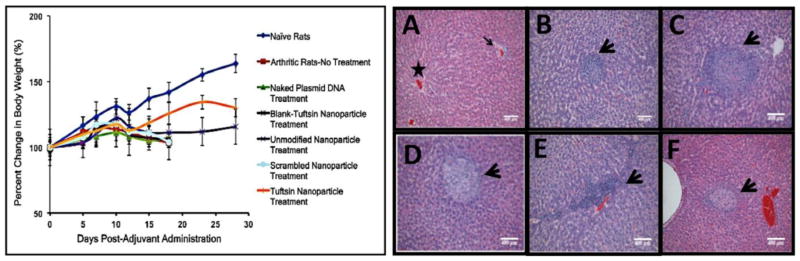
(Left)-Body weight measurements reported as percent change in body weight as a function of day’s post-adjuvant administration. The data is representative as %Mean ± S.D. (n=5 animals/group). Dramatic loss in body weight was observed for arthritis bearing animals (no treatment), and control treatments. Effective therapy with tuftsin-peptide modified nanoparticles encapsulating IL-10 plasmid DNA ameliorated signs of arthritis and accordingly, the treated rats survived for an extended period. Drastic drop in weight after day 23 was attributed to exhaustion of the transient therapeutic effect of IL-10 gene expression. (Right)-H&E staining of the liver to determine alginate based nanoparticles particle-mediated toxicity in arthritis-induced male Lewis rats. The liver samples were collected on day 18, post-adjuvant administration for all the treatment groups. Panel (A) represents Naïve Rats with normal hepatocellular architecture illustrating a central vein (star) and a portal area (arrow). (B)-Arthritis-No Treatment, (C)-Blank-Tuft NP Treatment, (D)-Unmodified Nanoparticle Treatment, (E)-Scrambled-Peptide modified Nanoparticle Treatment, (F) Tuftsin-Peptide modified Nanoparticle Treatment. (n=3 rats/group). Arrow heads in panels A-F represent fibro-histocytic nodules comprising of lymphocytes and plasma cells. These are considered to be common findings observed in the liver of arthritis-bearing rats and are not attributed to nanoparticle administration. Scale Bar = 400μm.
With regards to liver histology shown in Figure 10 (Right), it was interesting to note that disease-induced animals (Panel B) without treatment had number of scattered mild to moderate multifocal nodules, and consisting of histio-cytic and fibrous proliferation (indicated by black arrowheads). These nodules were comprised of lymphocytes and few plasma cells and occasional neutrophils present. As indicated in Panels C–F, the same pattern was also observed regardless of the nanoparticle treatment. These nodules were considered to be a common anamoly of the adjuvant-induced arthritis model and nanoparticles (regardless of treatment) were not found to be contributing to this observation. In comparison, liver sections from the naïve rats (Panel A) appeared normal and did not show any signs of lesions or damage.
4. DISCUSSION
Our previous in vitro polarization study showed that treatment of J774A1 macrophages with tuftsin-modified nanoparticles containing mIL-10 plasmid DNA led to enhanced levels of IL-10 cytokine (M2 marker) at both transcriptional and translational level. Furthermore, treatment also resulted in successfully alleviating levels of TNF-α (M1 marker) cytokine, indicating an effective switch from M1 state (high TNF-α expression and low IL-10 expression) to M2 state (high IL-10 expression and low TNF-α expression) [15]. To further support our claims, it was decided to also evaluate CD163 expression using FACS analysis. Results obtained in Figure 2 clearly show polarization effect as significant differences were found between untreated (LPS stimulated) and plasmid DNA containing alginate nanoparticles. Although, levels of CD163 were not significantly different between unmodified and tuftsin-peptide modified nanoparticles, the results were nevertheless encouraging and paved the path for in-vivo biodistribution and efficacy studies.
As stated before, the main objective of the pre-clinical studies was to investigate qualitative biodistribution and efficacy of the macrophage-targeted alginate based nanoparticles containing IL-10 encoding plasmid DNA in a model of adjuvant-induced arthritis. Both physical and molecular aspects of nanoparticle treatment in ameliorating inflammation were analyzed. Based on the in-vitro study results, the first goal was to establish the ability of the nanoparticle system-containing gene of interest to revert the macrophage to an anti-inflammatory state. Next, the therapeutic efficacy studies were conducted in two rounds. For the initial round, the efficacy was evaluated at day 18, post-adjuvant administration. The next sets of experiments were conducted up-till day 28, post-adjuvant administration. These studies were curtailed at day 28 as initial signs of inflammation were detected at this point in the targeted formulation group.
As evident from the bio-distribution study (Figure 3), i.p. administration of tuftsin-modified alginate nanoparticles led to superior uptake by murine peritoneal macrophages and subsequent localization in the inflamed paws of arthritic rats due to continuous recruitment of systemic monocytes/macrophages to the inflamed tissues in RA. Next, the ability of our gene delivery platform to alter the macrophage state from an M1 to M2 anti-inflammatory phenotype was established (Figure 4). As observed in the case of naïve rats, under homoeostatic conditions, macrophages do not comprise a major part of synovial cell population. This was evident based on the relatively low CD11b expression. Moreover, macrophages may not even exist as M1 or M2-sub type as shown by low expression of CD86 and CD163 markers, respectively and may attain a resting unpolarized state (M0). However, the synovial joints in arthritic rats (no treatment) had a significantly higher percentage of CD11b+ macrophages in the pro-inflammatory state (M1). This observation is in accordance with the disease pathophysiology as macrophages are found in abundance in the arthritis-bearing synovial joint, driving the inflammatory cascade and subsequent joint damage. The inability of the naked IL-10 plasmid DNA (Figure 4C) and scrambled-IL-10 nanoparticles (Figure 4F) to repolarize macrophages from an M1 to M2 phenotype was also observed in a previously conducted in-vitro study [15]. Largely, the lack of effectiveness in the case of scrambled-peptide modified nanoparticles was attributed to cell-toxicity due to positive charge on the nanoparticle surface. Blank tuftsin modified nanoparticles (Figure 4D) were included as a control to demonstrate that tuftsin peptide alone does not have a therapeutic effect. Unmodified IL-10 plasmid DNA containing nanoparticles illustrated the ability to switch the macrophage phenotype in the disease model. Since the particles are being injected into the macrophage-rich peritoneal cavity and because these cells are phagocytic in nature the nanoparticles are also engulfed by the target population of macrophages and are capable of repolarizing the cells. However, tuftsin-modified nanoparticles encapsulating the mIL-10 plasmid DNA were the most effective in reprogramming the target macrophages to the M2 anti-inflammatory state.
Caliper measurement data (Figure 5A and B) and the beam-walk test indicated that swelling in the paws increased in the arthritis-induced rats and control groups from day 12 onwards. These findings were complemented by the histology studies and T1-weighted MRI images. Unmodified nanoparticles containing IL-10 plasmid DNA had comparable therapeutic efficacy to tuftsin-modified IL-10 nanoparticles at day 18. To further compare the two formulations, the studies were extended until day 28 post-adjuvant administration. Since the arthritic rats, naked IL-10 plasmid DNA, blank tuftsin nanoparticle, and scrambled-peptide modified IL-10 plasmid DNA containing nanoparticle approached pre-determined ethical and safety standards for termination (percentage of weight loss) and the treatments did not demonstrate efficacy throughout the study, these groups were not considered for the extended time point therapeutic efficacy studies. Naïve rats were used as controls for this data set. By day 28, significant swelling was evident in the case of the unmodified IL-10 nanoparticle treatment group (Figure 6C and 7B). There were no appreciable physical changes in the paw swelling/edema profile in the tuftsin IL-10 nanoparticle treated animals but molecular analysis did reveal the first signs of inflammation, which indicates that the effect of anti-inflammatory IL-10 plasmid DNA therapy had declined by this time point.
The q-PCR (Figure 8A–D) analysis conducted on the excised joint samples showed that induction of arthritis (disease only, no treatment) causes a significant increase in the production of pro-inflammatory cytokines such as TNF-α, IL-1β, and IL-6. At the same time, IL-10 ratios were diminished because of the prevalence of the M1-macrophage phenotype. Treatment with the tuftsin IL-10 nanoparticles resulted in a direct elevation of the IL-10 transgene product and significant therapeutic effect. A 15-fold difference existed between the IL-10 ratios of the tuftsin IL-10 nanoparticles compared to the arthritis-bearing rats (no-treatment) at day 18. A similar trend was observed for the unmodified nanoparticle IL-10 treatment group. At day 28, once inflammation was apparent in the unmodified IL-10 nanoparticle treated group, a rapid increase in the ratios of IL-1β: β-actin and IL-6: β-actin at the diseased sites was observed. The ratio of IL-10: β-actin also declined as the effect of plasmid DNA subsided. Interestingly, it was also observed that by day 28, the levels of TNF-α at both transciptional and translational level returned to baseline values in both the treatment groups (Figures 8A and 9A). Cai et al also reported such a pattern with regard to this particular RA model, whereby alleviation in serum levels of TNF-α to baseline levels by day 30 [32].
In addition, at day 28, the levels of IL-1β and IL-6 were significantly higher in relation to TNF-α in the group treated with unmodified IL-10 nanoparticles. This synergy between the pro-inflammatory cytokine expressions at various states of the disease progression suggests that TNF-α may be predominant during the early phase of disease onset and other cytokines such as IL-1β and IL-6 propel the inflammatory processes at later time points. Lastly, together with the body weight measurements and liver histology profile, it was concluded that nanoparticle administration itself did not induce any overt toxicity, as the percent decrease in the body weight between the arthritis (no treatment) and control nanoparticle groups (blank-tuftsin modified and scrambled-peptide modified was insignificant. Although, liver histology data revealed the presence of mild lesions regardless of the treatment, this pattern was considered as an inert consequence of treatment as it did not correlate to the other safety parameter (body weight change).
5. CONCLUSIONS
Macrophages are phagocytic cells with critical functions in orchestrating an immune response to infection/inflammation. Macrophage plasticity has been implicated to play a significant role in progression of inflammatory autoimmune diseases like RA. As mentioned earlier, the side effects associated with biologics and cost of the treatment are some of the major drawbacks that have prompted researchers to develop other treatment options. Gene therapy has been considered as an alternative treatment modality to address multiple types of diseases, including autoimmune disorders such as RA. However, from the perspective of gene therapy, the biggest bottleneck is safe and efficient delivery in conjunction with target specific intracellular localization of the nucleic acid construct.
In this study, the main focus was to address above-mentioned issues by employing a non-viral natural occurring polymer based gene delivery system encapsulating IL-10 plasmid DNA targeted towards macrophages with an intent to shift the macrophage phenotype balance and assess the efficacy in adjuvant-induced arthritis model. Combination of targeted therapy along with administration into macrophage-rich peritoneal cavity was proven to be the key factors in effectively controlling the progression of arthritis. Enhanced localization of tuftsin-peptide modified alginate nanoparticles was observed into the limbs of arthritic animals in comparison to unmodified and scrambled-peptide modified nanoparticles. Consequently, single dose of the targeted formulation loaded with IL-10 plasmid DNA demonstrated superior transfection efficiency, sustained local and systemic IL-10 expression (leading to alleviation in levels of pro-inflammatory cytokines), and reduction in paw edema. More importantly, the therapeutic effects observed with targeted formulation prevented joint damage and delayed the onset of inflammation. Lastly, preliminary safety assessments showed that nanoparticles were very well tolerated in pre-clinical animal model of rheumatoid arthritis and signs of overt particle mediated toxicity were not observed in animals.
Overall, current results provide a solid foundation for a rheumatoid arthritis treatment that could be administered as a monthly i.p. injection. Future studies will focus on using this system to deliver other biologics such as miRNA [33, 34].
Supplementary Material
Animals in all the groups were conditioned to get used to the set-up on days 1, 3, and 5, post-arthritis induction. The video is representative for n=5 rats/group.
Acknowledgments
This study was partially supported by a grant (R01-DK080477) from the National Institute of Diabetes, Digestive Diseases, and Kidney Diseases of the National Institutes of Health. We deeply appreciate the assistance of Dr. Robert Lafyatis in the Department of Rheumatology at Boston University School of Medicine for his advice on adjuvant-induced arthritis animal model development and characterization. We also appreciate the assistance of Ms. Linda Wrijil and Ms. Frances Brown for preparing Masson tri-chrome stained slides and of Dr. Jerry Lyon all at the Tufts University Veterinary School in Grafton, MA for preparing the liver histology slides and providing blinded pathological analysis of the tissue samples. We thank Dr. Praveen Kulkarni at the Center for Translational Neuro-Imaging at Northeastern University, Boston, MA for his help with magnetic resonance imaging experiments. Lastly, Dr. Lara Milane’s assistance with the review of the manuscript is deeply appreciated.
Footnotes
Publisher's Disclaimer: This is a PDF file of an unedited manuscript that has been accepted for publication. As a service to our customers we are providing this early version of the manuscript. The manuscript will undergo copyediting, typesetting, and review of the resulting proof before it is published in its final citable form. Please note that during the production process errors may be discovered which could affect the content, and all legal disclaimers that apply to the journal pertain.
References
- 1.Bresnihan B, Youssef P. Macrophages in Rheumatoid Arthritis. In: Burke B, Lewis CE, editors. The Macrophage. Oxford University Press; New York: 2002. pp. 391–433. [Google Scholar]
- 2.Hamilton JA, Tak PP. The dynamics of macrophage lineage populations in inflammatory and autoimmune diseases. Arthritis Rheum. 2009;60:1210–21. doi: 10.1002/art.24505. [DOI] [PubMed] [Google Scholar]
- 3.Firestein GS. Evolving concepts of rheumatoid arthritis. Nature. 2003;423:356–61. doi: 10.1038/nature01661. [DOI] [PubMed] [Google Scholar]
- 4.Kinne RW, Stuhlmuller B, Burmester GR. Cells of the synovium in rheumatoid arthritis. Macrophages. Arthritis Res Ther. 2007;9:224. doi: 10.1186/ar2333. [DOI] [PMC free article] [PubMed] [Google Scholar]
- 5.Li J, Hsu HC, Mountz JD. Managing macrophages in rheumatoid arthritis by reform or removal. Curr Rheumatol Rep. 2012;14:445–54. doi: 10.1007/s11926-012-0272-4. [DOI] [PMC free article] [PubMed] [Google Scholar]
- 6.Kinne RW, Brauer R, Stuhlmuller B, Palombo-Kinne E, Burmester GR. Macrophages in rheumatoid arthritis. Arthritis research. 2000;2:189–202. doi: 10.1186/ar86. [DOI] [PMC free article] [PubMed] [Google Scholar]
- 7.Richards PJ, Williams AS, Goodfellow RM, Williams BD. Liposomal clodronate eliminates synovial macrophages, reduces inflammation and ameliorates joint destruction in antigen-induced arthritis. Rheumatology (Oxford) 1999;38:818–25. doi: 10.1093/rheumatology/38.9.818. [DOI] [PubMed] [Google Scholar]
- 8.Franz JK, Burmester GR. The needle and the damage done. Ann Rheum Dis. 2005;64:798–800. doi: 10.1136/ard.2005.039248. [DOI] [PMC free article] [PubMed] [Google Scholar]
- 9.Edwards CJ. Immunological therapies for rheumatoid arthritis. Br Med Bull. 2005;73–74:71–82. doi: 10.1093/bmb/ldh051. [DOI] [PubMed] [Google Scholar]
- 10.Ming-Cai Li SHH. IL-10 and its related cytokines for treatment of inflammatory bowel disease. World Journal of Gastroenterology. 2004;10:620–25. doi: 10.3748/wjg.v10.i5.620. [DOI] [PMC free article] [PubMed] [Google Scholar]
- 11.Moore KW, de Waal Malefyt R, Coffman RL, O’Garra A. Interleukin-10 and the interleukin-10 receptor. Annual review of immunology. 2001;19:683–765. doi: 10.1146/annurev.immunol.19.1.683. [DOI] [PubMed] [Google Scholar]
- 12.Lechman ER, Keravala A, Nash J, Kim SH, Mi Z, Robbins PD. The contralateral effect conferred by intra-articular adenovirus-mediated gene transfer of viral IL-10 is specific to the immunizing antigen. Gene Ther. 2003;10:2029–35. doi: 10.1038/sj.gt.3302109. [DOI] [PubMed] [Google Scholar]
- 13.Lechman ER, Jaffurs D, Ghivizzani SC, Gambotto A, Kovesdi I, Mi Z, Evans CH, Robbins PD. Direct adenoviral gene transfer of viral IL-10 to rabbit knees with experimental arthritis ameliorates disease in both injected and contralateral control knees. Journal of immunology. 1999;163:2202–08. [PubMed] [Google Scholar]
- 14.Kay MA, Glorioso JC, Naldini L. Viral vectors for gene therapy: the art of turning infectious agents into vehicles of therapeutics. Nat Med. 2001;7:33–40. doi: 10.1038/83324. [DOI] [PubMed] [Google Scholar]
- 15.Jain S, Amiji M. Tuftsin-modified alginate nanoparticles as a noncondensing macrophage-targeted DNA delivery system. Biomacromolecules. 2012;13:1074–85. doi: 10.1021/bm2017993. [DOI] [PubMed] [Google Scholar]
- 16.Draget KI, Smidsrod O, Gudmund S-B. Alginates from Algae. In: Rhee ASaSK., editor. Polysaccharides and Polyamides in Food Industry Properties, Production and Patents. Wiley-VCH Verlag GmbH & Co.KGaA; Weinheim: 2005. pp. 1–30. [Google Scholar]
- 17.Laurienzo P. Marine polysaccharides in pharmaceutical applications: an overview. Mar Drugs. 2010;8:2435–65. doi: 10.3390/md8092435. [DOI] [PMC free article] [PubMed] [Google Scholar]
- 18.Phillips JH, Babcock GF, Nishioka K. Tuftsin: a naturally occurring immunopotentiating factor. I. In vitro enhancement of murine natural cell-mediated cytotoxicity. J Immunol. 1981;126:915–21. [PubMed] [Google Scholar]
- 19.Bar-Shavit Z, Stabinsky Y, Fridkin M, Goldman R. Tuftsin-macrophage interaction: specific binding and augmentation of phagocytosis. Journal of cellular physiology. 1979;100:55–62. doi: 10.1002/jcp.1041000106. [DOI] [PubMed] [Google Scholar]
- 20.Amoscato AA, Davies PJ, Babcock GF, Nishioka K. Receptor-mediated internalization of tuftsin. Annals of the New York Academy of Sciences. 1983;419:114–34. doi: 10.1111/j.1749-6632.1983.tb37097.x. [DOI] [PubMed] [Google Scholar]
- 21.Najjar VA. Tuftsin, a natural activator of phagocyte cells: an overview. Annals of the New York Academy of Sciences. 1983;419:1–11. doi: 10.1111/j.1749-6632.1983.tb37086.x. [DOI] [PubMed] [Google Scholar]
- 22.Howard KA, Paludan SR, Behlke MA, Besenbacher F, Deleuran B, Kjems J. Chitosan/siRNA nanoparticle-mediated TNF-alpha knockdown in peritoneal macrophages for anti-inflammatory treatment in a murine arthritis model. Mol Ther. 2009;17:162–68. doi: 10.1038/mt.2008.220. [DOI] [PMC free article] [PubMed] [Google Scholar]
- 23.Bendele A. Animal models of rheumatoid arthritis. Journal of musculoskeletal & neuronal interactions. 2001;1:377–85. [PubMed] [Google Scholar]
- 24.Joe B, Griffiths MM, Remmers EF, Wilder RL. Animal models of rheumatoid arthritis and related inflammation. Curr Rheumatol Rep. 1999;1:139–48. doi: 10.1007/s11926-999-0011-7. [DOI] [PubMed] [Google Scholar]
- 25.Williams RO. Models of Rheumatoid Arthritis. In: Zollner HRT, Asadullah K, editors. Animal Models of T cell Mediated Skin Diseases. Vol. 50. Springer; Berlin Heidelberg: 2007. pp. 89–117. [Google Scholar]
- 26.Yang YH, Hutchinson P, Santos LL, Morand EF. Glucocorticoid inhibition of adjuvant arthritis synovial macrophage nitric oxide production: role of lipocortin 1. Clin Exp Immunol. 1998;111:117–22. doi: 10.1046/j.1365-2249.1998.00438.x. [DOI] [PMC free article] [PubMed] [Google Scholar]
- 27.Moghaddami M, Cleland LG, Mayrhofer G. MHC II+ CD45+ cells from synovium-rich tissues of normal rats: phenotype, comparison with macrophage and dendritic cell lineages and differentiation into mature dendritic cells in vitro. Int Immunol. 2005;17:1103–15. doi: 10.1093/intimm/dxh290. [DOI] [PubMed] [Google Scholar]
- 28.Donnelly CJ, Park M, Spillane M, Yoo S, et al. Axonally synthesized beta-actin and GAP-43 proteins support distinct modes of axonal growth. The Journal of neuroscience : the official journal of the Society for Neuroscience. 2013;33:3311–22. doi: 10.1523/JNEUROSCI.1722-12.2013. [DOI] [PMC free article] [PubMed] [Google Scholar]
- 29.Tamura R, Nemoto T, Maruta T, Onizuka S, Yanagita T, Wada A, Murakami M, Tsuneyoshi I. Up-regulation of NaV1.7 sodium channels expression by tumor necrosis factor-alpha in cultured bovine adrenal chromaffin cells and rat dorsal root ganglion neurons. Anesthesia and analgesia. 2014;118:318–24. doi: 10.1213/ANE.0000000000000085. [DOI] [PubMed] [Google Scholar]
- 30.Yan X, Weng HR. Endogenous interleukin-1beta in neuropathic rats enhances glutamate release from the primary afferents in the spinal dorsal horn through coupling with presynaptic N-methyl-D-aspartic acid receptors. The Journal of biological chemistry. 2013;288:30544–57. doi: 10.1074/jbc.M113.495465. [DOI] [PMC free article] [PubMed] [Google Scholar]
- 31.Edin S, Wikberg ML, Dahlin AM, Rutegard J, Oberg A, Oldenborg PA, Palmqvist R. The distribution of macrophages with a M1 or M2 phenotype in relation to prognosis and the molecular characteristics of colorectal cancer. PloS one. 2012;7:e47045. doi: 10.1371/journal.pone.0047045. [DOI] [PMC free article] [PubMed] [Google Scholar]
- 32.Cai X, Wong YF, Zhou H, Xie Y, Liu ZQ, Jiang ZH, Bian ZX, Xu HX, Liu L. The comparative study of Sprague-Dawley and Lewis rats in adjuvant-induced arthritis. Naunyn Schmiedebergs Arch Pharmacol. 2006;373:140–47. doi: 10.1007/s00210-006-0062-5. [DOI] [PubMed] [Google Scholar]
- 33.Liu G, Abraham E. MicroRNAs in immune response and macrophage polarization. Arterioscler Thromb Vasc Biol. 2013;33:170–77. doi: 10.1161/ATVBAHA.112.300068. [DOI] [PMC free article] [PubMed] [Google Scholar]
- 34.Zhuang G, Meng C, Guo X, Cheruku PS, et al. A novel regulator of macrophage activation: miR-223 in obesity-associated adipose tissue inflammation. Circulation. 2012;125:2892–903. doi: 10.1161/CIRCULATIONAHA.111.087817. [DOI] [PubMed] [Google Scholar]
Associated Data
This section collects any data citations, data availability statements, or supplementary materials included in this article.
Supplementary Materials
Animals in all the groups were conditioned to get used to the set-up on days 1, 3, and 5, post-arthritis induction. The video is representative for n=5 rats/group.