

Abstract
Objectives
Symptomatic peripheral arterial disease (PAD) results in significant gait impairment. In an attempt to fully delineate and quantify these gait alterations, we analyzed joint kinematics, torques (rotational forces) and powers (rotational forces times angular velocity) in PAD patients with unilateral claudication for both the affected and non-affected legs.
Methods
Twelve patients with unilateral PAD (age: 61.69±10.53 years, ABI: Affected Limb 0.59 ± 0.25; Non-Affected Limb 0.93 ± 0.12) and ten healthy controls (age: 67.23 ± 12.67 years, ABI>1.0 all subjects) walked over a force platform to acquire gait kinetics, while joint kinematics were recorded simultaneously. Data were collected for the affected and non-affected limbs during pain free (PAD-PF) and pain induced (PAD-P) trials. Kinetics and kinematics were combined to quantify torques and powers during the stance period from the hip, knee, and ankle joints.
Results
The affected limb demonstrated significantly (p<0.05) reduced ankle plantar flexion torque compared to control during late stance in both PAD-PF and PAD-P trials. There were significant reductions in ankle plantar flexion power generation during late stance for both the affected (P<.05) and non-affected limbs (P<.05) compared to control during PAD-PF and PAD-P trials. No significant differences were noted in torques comparing the non-affected limb in PAD-PF and PAD-P conditions to control for knee and hip joints throughout the stance phase. Significant reductions were found in knee power absorption in early stance and knee power generation during mid stance for both limbs of the PAD patients as compared to control (P<.05).
Conclusions
PAD patients with unilateral claudication demonstrate significant gait impairments in both limbs that are present even before they experience any claudication symptoms. Overall, our data demonstrate significantly reduced ankle plantar flexion torque and power during late stance with reduced knee power during early and mid stance for the affected limb. Further studies are needed to determine if these findings dependent on the location and the severity of lower extremity ischemia and whether the changes in the non-affected limb are the result of underlying PAD or compensatory changes from the affected limb dysfunction.
Keywords: biomechanics, ischemia, peripheral arterial disease, locomotion, gait
INTRODUCTION
Peripheral arterial disease (PAD) affects over ten million people in the U.S., the majority of which are elderly. Intermittent claudication is the most common presentation of PAD and consists of pain, cramping, aching and tiredness, induced by physical activity (i.e. walking) and relieved with rest1. Intermittent claudication and its related ambulatory dysfunction are associated with poor health outcomes, physical dependence and inactivity2, 3 severely limiting all aspects of patient functioning and quality of life4, 5.
Currently, the ambulatory impairment produced by claudication and the degree to which it may respond to treatment are evaluated using basic time-distance tools such as gait velocity and cadence6. The majority of available studies indicate PAD patients walk slower, have reduced cadence, increased stance time, shorter stride length and a narrower step width as compared with controls6–9. Although these basic temporal and spatial parameters provide a description of the ambulatory dysfunction of the PAD patient, they are unable to provide an understanding of the mechanisms responsible for this gait impairment.
A series of studies by our laboratory and others have utilized advanced biomechanical measures to identify the mechanisms underlying the gait impairment of PAD patients. Scott-Pandorf et al. demonstrated several mechanisms leading to PAD gait dysfunction. PAD patients walk with decreased fluctuations of center of gravity, have significantly decreased peak propulsion force and exhibit a reduced ability to swing their legs forward. Crowther et al. observed abnormal ankle plantar flexion in early stance, knee range of motion in stance phase and hip extension in late stance10 while Chen et al. demonstrated significant torque alterations at the ankle and hip.
To more clearly delineate the joint muscular responses and their contributions in patients with claudication, we have employed advanced biomechanical analysis in the form of joint torques and powers. The joint torque is the net result of all forces acting around a joint. Positive torque values represent an extensor response while negative values indicate a flexor response. Joint powers are the product of net torque across a joint and the angular velocity of the joint. Positive joint power indicates that energy is being generated and is associated with concentric muscular contraction while negative power indicates that energy is being absorbed and is associated with eccentric muscular contraction. The utility of joint powers is their unique ability to point to specific neuromuscular deficits in pathological gait and guide subsequent treatment. Joint powers have identified the alterations in knee osteoarthritis, anterior cruciate ligament reconstruction11, 12, below knee amputees13 and hip arthroplasty 14 patients while providing unique rehabilitation protocols in patients undergoing anterior cruciate ligament reconstruction15. In addition, joint powers have characterized the gait mechanics of the elderly16–19 and identified the risk for falls in healthy elderly populations. Similar insights can be gained from advanced biomechanical analysis of patients with PAD.
Using this approach in our previous work we have identified weakness in the posterior compartment muscles of the calf as a consistent and key factor underlying the PAD gait adaptations20. Our previous studies investigated patients with bilateral claudication. Clinically however, many patients present with unilateral symptoms having both an affected limb (AL) and a non-affected limb (NAL). Therefore, the purpose of our study was to utilize advanced biomechanical analysis to determine the gait impairment of the individual limbs of unilateral PAD patients. Based on our previous work, we hypothesized that the affected limb of PAD patients would demonstrate significant differences compared to the non-affected and the control (CON) limbs while the patients walked before the onset of claudication and that these differences would variably worsen after the onset of claudication symptoms.. We also hypothesized that the non-affected limbs would demonstrate no differences as compared to CON.
METHODS
Subject inclusion and exclusion criteria
Twelve male patients (age: 61.69±10.53 years, ABI: Affected Limb 0.59 ± 0.25; Non-Affected limb 0.93 ± 0.12) diagnosed with moderate arterial occlusive disease and unilateral claudication were recruited from the vascular surgery clinics of the VA Nebraska and Western Iowa and University of Nebraska Medical Centers. In addition, ten age-, gender-, body mass- and height-matched healthy controls (age: 66.27 ± 9.22 years, ABI: 1.1±0.11) were recruited from the community and volunteered to participate. Patients and CON were screened and evaluated by two board certified vascular surgeons. PAD and CON patients with ambulation limiting cardiac, pulmonary, neuromuscular, or musculoskeletal disease or those who experienced pain or discomfort during walking for any reason other than claudication were excluded. Patient evaluation included resting ABI (a measurement below 0.9 was present in the affected limb of all subjects with unilateral claudication that was measured in our VA and University of Nebraska Medical Center vascular laboratories), a detailed history, a physical exam, and a direct assessment/observation of the patient’s walking impairment. All PAD subjects recruited had no previous attempts at revascularization.
Control subjects had an ABI greater than 1.0 and no subjective or objective ambulatory dysfunction. Controls were screened in a similar fashion as PAD patients and were excluded for the same ambulation limiting co-morbidities. Informed consent was obtained from all subjects prior to data collection according to the guidelines of the Institutional Review Boards of the medical centers. The gait of all recruited participants was tested in our Biomechanics Laboratory.
Experimental Procedure and Data Collection
Kinematic and kinetic parameters from the ankle, knee, and hip joints were evaluated in PAD patients from both the affected and non-affected limbs before (pain free = PAD-PF) and after onset of claudication symptoms (pain = PAD-P). The limbs were evaluated during early stance (weight acceptance phase), mid stance (weight transfer phase) and late stance (weight propulsion phase). To assess the ambulatory deficits of the affected and non-affected limbs, PAD patients were compared to height-, gender-, mass-, and age-matched healthy controls. Prior to data collection, reflective markers were placed at specific anatomical locations of each subject’s lower limb utilizing the modified Helen Hayes marker set21, 22. Each subject walked with their self-selected pace on a ten meters pathway while the three-dimensional marker trajectories and ground reaction force data were collected simultaneously. The three dimensional marker trajectories were collected with an eight high-speed real-time camera system (EvaRT 5.0, Motion Analysis Corp., Santa Rosa, CA) surrounding the walkway sampling at 60Hz. The ground reaction force data were acquired with a Kistler force platform (Kistler Instrument, Switzerland) located in the middle of the walkway sampling at 600 Hz.
Each PAD patient was tested first in the PAD-PF condition (before the onset of claudication symptoms), followed by the PAD-P (after the onset of claudication symptoms). For the PAD-PF-condition, a mandatory rest period of at least one minute occurred between walking trials to ensure that any pain symptoms had subsided. Once patients completed all PAD-PF trials, claudication was induced. To accomplish this, a clinical protocol was used consisted of walking on a treadmill set at 10% grade and at a speed of 0.67m/s23, 24 until the onset of pain. At this time patients were immediately removed from the treadmill and returned to the collection walkway to acquire the data for the pain-condition without the mandatory resting periods between trials. The CON subjects completed five walking trials with mandatory rest of 1 minute between the trials. A total of five successful trials were collected from each limb of the subjects for each condition. A successful walking trial was determined by the subject’s foot being completely within the force platform.
Data Analysis
Data from the three-dimensional marker trajectories and ground reaction forces were combined to calculate the joint torques and powers for the sagittal plane during the stance phase of walking (from heel touchdown to toe off). The limbs were evaluated during early stance (weight acceptance phase), mid stance (weight transfer phase) and late stance (weight propulsion phase) (Figure 1). A low-pass fourth order Butterworth filter with a 7 Hz cutoff frequency was used to smooth the marker trajectories during post data processing. An inverse dynamic technique was performed to calculate joint torques and joint muscle powers from the kinematic (displacement velocities and accelerations derived from the three-dimensional marker trajectories) and the kinetic (derived from the ground reaction forces) data25. Joint torque was calculated as the summation of all torques acting around a specific joint. These torques are the product of all muscular, ligament, frictional, gravitational, inertial and ground reaction forces acting on the joint. Positive torque values represent extensor torques while negative values indicate flexor torques. Joint muscle power was calculated as the product of the net torque at a joint (Tj) and joint angular velocity (ωj) or Pj=Tj x ωj. Power measurements can be expressed positively or negatively. Positive power indicates energy is being generated (concentric muscular contractions) and negative power indicates energy is being absorbed (eccentric muscular contractions) by the joint muscle group under study. Joint torques and joint muscle powers were normalized by body weight and expressed as a percentage (100%) during stance phase from heel strike (zero percent stance) to toe-off (100 percent stance). Peak torques were measured for the following muscle groups: ankle dorsiflexors, ankle plantar flexors, knee extensors, knee flexors, hip extensors and hip flexors. The peak variables indentified for joint powers were: ankle power absorption in mid-stance (A1), ankle power generation in late stance (A2), knee power absorption in early stance (K1), knee power generation in early stance (K2), knee power absorption in late stance (K3), hip power generation in early stance (H1), hip power absorption in mid-stance (H2) and hip power generation in late stance (H3). All normalization occurred after the peak points were determined to ensure that the normalization did not distort these values. Joint torques and joint powers were calculated and normalized using custom software in Matlab (Matlab 2007, Mathworks, Inc., Concord, MA).
Figure 1.
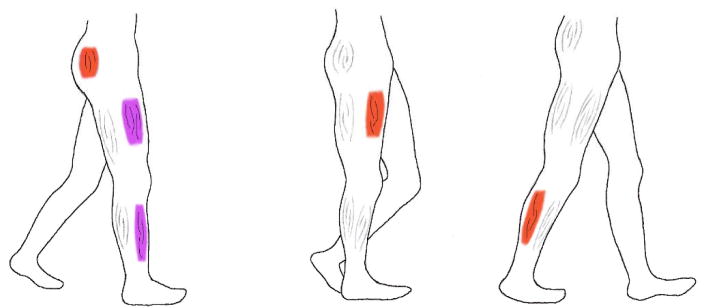
An illustration of the stance phase of walking with the dominant flexor and extensor muscle groups that are involved in the three phases is produced. The dominant muscle groups are identified in red if they contract concentrically and in purple if they contract eccentrically.
A) Early stance phase lasts from ipsilateral heel strike to contralateral toe off thus covering the first double support phase (initial 20% of stance). The right leg is accepting majority of body weight as it descends from previously being in single support on the left leg. In this phase the right hip extensors concentrically contract to extend the hip, the knee extensors eccentrically contract to allow the knee to bend and the ankle dorsiflexors eccentrically contract to maintain ankle dorsiflexion.
B) Mid-stance phase lasts from contralateral (here left) toe off until contralateral heel strike. During single support the body is at its highest point over the extended ipsilateral leg. The body has maximum potential energy preparing to fall forward for the next double support. Limited muscular contractions are needed during this phase except when the knee extensors contract concentrically to extend the knee and straighten the leg.
C) Late stance lasts from contralateral heel strike to ipsilateral toe off. It is the final 20% of stance and is the second double support phase. In this phase the body is propelled forward onto the extended left leg mainly by the action of the ankle plantar flexors. Functionally, these muscles contract concentrically and accelerate the leg and the trunk forward and upward over the left leg thus providing forward progression and weight support.
Statistical Analysis
Group means for all dependent variables were calculated for each testing condition (PAD-PF and P) for all limbs. Thus, twelve affected limbs and twelve non-affected limbs were evaluated for the PAD patients in each condition compared to 20 limbs for the control group. A two by two fully repeated measures analysis of variance was used to compare the two limbs for both PAD-PF and P conditions. Independent t-tests were used to compare both conditions and both limbs of the PAD group with the CON group. Independent t-tests were also used to compare the differences between PAD and CON group demographics. The level of significance was set to 0.05. Values are presented in the tables and figures as means ± standard deviations. The SPSS Base 12.0 statistical software (SPSS Inc., Chicago, IL) was used to perform the statistical analysis.
RESULTS
Subjects
Twelve PAD patients with clinically diagnosed aortoiliac (N=4), femoropopliteal (N=4) and multilevel (N=4) occlusive disease and calf claudication were evaluated. All patients had Rutherford category 2 moderate claudication symptoms. Ten control subjects with absence of claudication were also included (Table 1).
Table 1.
Baseline characteristics of Peripheral Arterial Disease (PAD) patients and healthy controls.
| Clinical characteristics | Control (N=20 limbs) | PAD (N=24 limbs) | p-value |
|---|---|---|---|
| Age (years) | 66.27±9.22 | 61.69±10.53 | ns |
| Body mass (kg) | 77.89±10.65 | 84.65±20.24 | ns |
| Body height (m) | 1.74±0.08 | 1.72 ±0.08 | ns |
| Disease duration (years) | 0 | 6.25 ± 3.84 | N/A |
| ABI | |||
| Non-Affected Limb Right for Controls | 1.1±0.12 | 0.93±0.12 | ns |
| Affected limb Left for Controls | 1.1±0.08 | 0.59±0.25 | <0.05 |
| Smokers, n (%) | 8 (80) | 7 (58.3) | ns |
| Hypertension, n (%) | 0 (0) | 5 (41.7) | <0.05 |
| Diabetes mellitus, n (%) | 0 (0) | 1 (8.3) | ns |
| Dyslipidemia, n (%) | 0 (0) | 9 (75) | <0.05 |
| BMI | 25.60±2.94 | 27.42±4.44 | ns |
Note: ABI: ankle brachial index; BMI: body mass index; ns: statistically non-significant; N/A:non applicable; Values are presented as means ± standard deviations.
Joint Torques and Powers
Early Stance
Significant reduction in ankle dorsiflexion torque was noted for the affected limb during early stance in the PAD-P condition as compared to CON. The knee extensor torque was reduced during early stance for the affected limb in both PAD-PF and PAD-P conditions as compared to CON (Table 2; Figure 2). Knee power absorption during early stance was significantly reduced for the affected limb in both PAD-PF and PAD-P conditions as compared to CON (Table 3; Figure 3) whereas reduction for the non-affected limb was noted in the PAD-PF condition (Table 3; Figure 4). The knee power generation during early stance was significantly reduced for both limbs in the PAD-PF and PAD-P conditions as compared to CON. In addition, the knee power generation during early stance was significantly reduced in the PAD-PF condition as compared to PAD-P primarily in the non-affected limb (Table 3).
Table 2.
Group means and standard deviations for joint torques of the ankle, knee and hip joint for Peripheral Arterial Disease (PAD) and control groups. The units for all values are N*m/kg.
| Control (N=20 limbs) | Peripheral Arterial Disease (N=24 limbs) | ||||
|---|---|---|---|---|---|
|
| |||||
| Pain Free (PAD-PF) | Pain (PAD-P) | ||||
|
| |||||
| Non-Affected Limb | Affected Limb | Non-Affected Limb | Affected Limb | ||
| ADT | −0.36±0.09 | −0.38±0.20 | −0.29±0.13 | −0.42±0.30 | −0.23±0.15d |
| APT | 1.31±0.28 | 1.32±0.16e | 1.18±0.25b,e | 1.27±0.18 | 1.11±0.27d |
| KET | 0.82±0.18 | 0.61±0.30 | 0.58±0.27b | 0.69±0.41 | 0.59±0.37d |
| KFT | −0.14±0.12 | −0.23±0.21 | −0.14±0.22 | −0.20±0.28 | −0.13±0.26 |
| HET | 0.98±0.49 | 0.83±0.33 | 0.72±0.15 | 0.80±0.23 | 0.78±0.24 |
| HFT | −0.95±0.21 | −0.72±0.39 | −0.96±0.51 | −0.76±0.43 | −0.90±0.65 |
Note:
p < .05, significant differences between groups (PAD-PF, Non-Affected limb vs. Control).
p < .05, significant differences between groups (PAD-PF, Affected limb vs. Control).
p < .05, significant differences between groups (PAD-P, Non-Affected limb vs. Control).
p < .05, significant differences between groups (PAD-P, Affected limb vs. Control).
p < .05, significant differences between testing conditions (PAD-PF vs. PAD-P).
Figure 2.

The ensemble-average joint torque curves of the affected limb for the PAD patients (PAD-PF and PAD-P; N=24 limbs) and the healthy controls (Control; N=20 limbs) during the stance phase for the (a) ankle and (b) knee joints. Note: ADT ankle dorsiflexion torque, APT ankle plantar flexion torque, KET extensor torque, KFT flexor torque. Torques are normalized to body mass in kg. Error bars represent the standard deviation of the mean values.
Note: b p < .05, significant differences between groups (PAD-PF Affected limb vs. Control).
dp < .05, significant differences between groups (PAD-P Affected limb vs. Control).
ep < .05, significant differences between testing conditions (PAD-PF vs. PAD-P).
Table 3.
Group means and standard deviations for joint powers of the ankle, knee and hip joint for Peripheral Arterial Disease (PAD) and control groups. The units for all values are Watts/kg.
| Control (N=20 limbs) | Peripheral Arterial Disease (N=24 limbs) | ||||
|---|---|---|---|---|---|
|
| |||||
| Pain Free (PAD-PF) | Pain (PAD-P) | ||||
|
| |||||
| Non-Affected Limb | Affected Limb | Non-Affected Limb | Affected Limb | ||
| A1 | −0.52±0.21 | −0.37±0.35 | −0.43±0.18 | −0.53±0.16 | −0.43±0.15 |
| A2 | 4.00±0.88 | 2.65±0.92a,e | 2.49±0.46 b,e | 2.39±0.67c | 2.05±0.59d |
| K1 | −0.73±0.22 | −0.52±0.40a | −0.36±0.21b | −0.75±0.74 | −0.36±0.32d |
| K2 | 0.62±0.25 | 0.31±0.23a,e | 0.25±0.25 b,e | 0.41±0.28c | 0.26±0.31d |
| K3 | −0.73±0.23 | −0.67±0.57 | −1.09±1.05 | −0.66±0.53 | −1.00±1.20 |
| H1 | 0.42±0.20 | 0.39±0.21 | 0.38±0.20 | 0.41±0.20 | 0.31±0.29 |
| H2 | −0.78±0.23 | −0.65±0.36a | −0.68±0.35 | −0.58±0.54c | −0.68±0.45 |
| H3 | 0.76±0.29 | 0.77±0.37 | 0.78±0.51 | 0.57±0.42 | 0.62±0.55 |
Note:
p < .05, significant differences between groups (PAD-PF, Non-Affected limb vs. Control).
p < .05, significant differences between groups (PAD-PF, Affected limb vs. Control).
p < .05, significant differences between groups (PAD-P, Non-Affected limb vs. Control).
p < .05, significant differences between groups (PAD-P, Affected limb vs. Control).
p < .05, significant differences between testing conditions (PAD-PF vs. PAD-P).
Figure 3.

The ensemble-average joint power curves of the affected limb for the PAD patients (PAD-P and PAD-PF; N=24 limbs) and the healthy controls (Control; N=20 limbs) during the stance phase for the (a) ankle and (b) knee joints. Note: A1 ankle power absorption in late midstance, A2 ankle power generation in late stance, K1 knee power absorption in early stance, K2 knee power generation in early stance, K3 knee power absorption in late stance. Error bars represent the standard deviation of the mean values.
Note: b p < .05, significant differences between groups (PAD-PF Affected limb vs. Control).
dp < .05, significant differences between groups (PAD-P Affected limb vs. Control).
ep < .05, significant differences between testing conditions (PAD-PF vs. PAD-P).
Figure 4.

The ensemble-average joint power curves of the non-affected limb for the PAD patients (PAD-PF and PAD-P; N=24 limbs) and the healthy controls (Control; N=20 limbs) during the stance phase for the (a) ankle and (b) knee, joints. Note: A1 ankle power absorption in late midstance, A2 ankle power generation in late stance, K1 knee power absorption in early stance, K2 knee power generation in early mid-stance, K3 knee power absorption in late stance. Error bars represent the standard deviation of the mean values.
Note: b p < .05, significant differences between groups (PAD-PF Affected limb vs. Control).
dp < .05, significant differences between groups (PAD-P Affected limb vs. Control).
ep < .05, significant differences between testing conditions (PAD-PF vs. PAD-P).
Mid Stance
Hip power absorption in midstance was significantly reduced in the non-affected limb in both PAD-PF and PAD-P conditions as compared to CON (Table 3).
Late Stance
Significant reduction in ankle plantar flexion torque was noted for the affected limb in both PAD-PF and PAD-P conditions during late stance as compared to CON (Table 3; Figure 2). Ankle power generation during late stance was significantly reduced for the limbs a compared to CON for both the PAD-PF and PAD-P conditions (Table 3; Figures 3 & 4). In addition, significant reductions in ankle power generation were noted during the PAD-P condition compared to PAD-PF condition for both limbs of the PAD patients (Table 3).
DISCUSSION
The present study is the first to provide detailed quantitative analysis of the joint torque and joint power changes in PAD patients with unilateral intermittent claudication. While prior works have examined the biomechanics of symptomatic PAD limbs7, 26, the current study is unique in simultaneously evaluating symptomatic and asymptomatic limbs of PAD patients with classic symptom unilateral claudication. Joint torques and joint powers were evaluated while PAD patients walked both before and after the onset of claudication (PAD-PF and PAD-P conditions respectively) and were compared to those of gender-, height-, mass-, and age-matched healthy controls. Our data demonstrate that the gait of claudicating patients is significantly altered for both limbs in both the PAD-PF and PAD-P conditions.
Our results continue to identify a weakness in the posterior compartment muscles of the calf as the primary dysfunction operating in the PAD patient producing significantly altered ankle propulsion during late stance20. Compared to CON, patients with PAD have decreased power generation in both their limbs as they try to propel towards swing in late stance in both PAD-PF and PAD-P conditions (Table 3; Figures 2 & 3). The decreased power generation during plantar flexion points to a significant weakness of the posterior calf muscles (primarily the gastrocnemius and soleus), which constitute the dominant muscle group responsible for ankle plantar flexion (push-off initiating the swing phase). Weakness of the posterior calf muscles is consistent with this muscle group being the “functional end organ” in lower extremity ischemia. This hypothesis is further supported by findings demonstrating that PAD patients have significantly decreased ankle plantar flexor strength3, 27–29 and decreased ankle plantar flexor torque. Importantly, advanced biomechanical analysis demonstrated the specific dysfunction with a limited number of patients (N=22) compared to other methodologies (N= 500–1500). Functionally, in late stance, the gastrocnemius and the soleus both concentrically contract to propel the body forward and initiate leg swing while decelerating the downward motion of the trunk i.e., providing forward progression and support 30. Our advanced biomechanical analyses clearly identifies the most definable and obvious deficit in patients with PAD, regardless of degree of limb ischemia, as a failure of the ankle plantar flexors to optimally contract producing decreased power output in late stance.
There were notable findings at the knee and hip for the current study when examining torque and power data. Knee extensor torque (Figure 2) in early stance was decreased in both PAD-PF and PAD-P conditions for the affected limb as compared to CON. The knee power absorption in early stance and knee power generation in mid-stance (both serving to decelerate trunk descent on the supporting limb) for both limbs of the PAD patients was significantly reduced as compared to CON. In addition, hip power absorption (stabilizing the trunk on the moving lower limb in preparation for push off) was significantly reduced during mid-stance for the non-affected limb during PAD-PF and PAD-P trials as compared to CON. Our current data in patients with unilateral claudication along with our recently published work in patients with bilateral claudication20, 31 suggest that alterations at the knee and hip result in abnormal trunk support during walking in PAD patients. Combined with the abnormal power generation at the ankle level in late stance, the claudicating patient may be unable to accept and support the weight of the trunk especially after the onset of claudication pain. Future studies will need to explore the gait handicap of PAD patients with aortoiliac occlusive disease (i.e. buttock and thigh claudication) compared to patients with femoral-popliteal occlusive disease (i.e. calf claudication) to determine if these patterns persist.
The current study examines unilateral claudication patients with a clear focus on the “asymptomatic” limb. Most vascular specialists in a clinical setting would focus solely on the symptomatic limb, especially with an asymptomatic contra-lateral limb and normal ankle brachial index. Additionally, most clinicians would assume the normal limb would compensate for the dysfunction of the affected limb. Several important findings should be noted for this asymptomatic limb. First, despite absence of symptoms, the non-affected limb demonstrates significant reductions in joint powers when compared to the CON limbs. These differences are demonstrated clearly for the ankle power generation at late stance, knee power absorption and generation in early stance and hip power absorption at mid-stance. Secondly, when comparing the non-affected to the affected limb directly, no statistically significant differences were found indicating similar joint muscular responses in both legs. Therefore, our data demonstrate abnormal gait biomechanics for the non-affected limb in the unilateral claudicant.
The main pathophysiologic mechanism operating in claudication is exercise-induced ischemia of the muscles in the symptomatic limbs which is followed by reperfusion at rest 32–37. These repeated cycles of ischemia-reperfusion have been shown to be responsible for the myopathy of claudicating muscles which is principally characterized by mitochondrial dysfunction and oxidative damage. Interestingly, in two studies38, 39 evaluating levels of mitochondrial DNA damage in muscle from affected and non-affected limbs of patients with unilateral PAD, Bhat et al. demonstrated that mitochondrial damage was present in both limbs despite a normal ABI and absence of symptoms in the non-affected limb. Our findings coupled with those of Bhat et al. suggest that that ischemia/reperfusion of the affected limb may have an effect (possibly by systemic oxidative stress or another neuro/humoral pathway) on the non-affected limb. An alternative explanation for our findings is subclinical occlusive disease in the non-affected and asymptomatic limbs not detected at rest but present with exertion. Although our patients had normal resting ABI’s and no symptoms in their non-affected limb, we did not evaluate them using exercise treadmill testing which could have revealed occlusive disease in the non-affected limb that is not discernible by ABI measurements at rest. Finally, it is possible that the non-affected limb may be suffering overuse injury because of an attempt by the PAD patient to protect the symptomatic limb or in contrast, the non-affected limb may be deconditioned because of the limitations to ambulation posed by the affected limb. Regardless of the mechanism, it is clear that the non-affected limb in unilateral PAD is not simply an innocent bystander.
In summary, biomechanical analysis using joint torques and powers indicates significant abnormalities in the gait of non-affected and affected limbs in both PAD-PF and PAD-P conditions for patients with unilateral claudication. Our research work points to significant calf muscle dysfunction leading to an inability to propel the body as the primary gait deficit in PAD patients. Additional impairments at the knee and hip affecting weight transfer are also present. These findings demonstrate that advanced biomechanical analysis correlates with basic laboratory data and can be used to fully define the underlying gait handicap of PAD patients. Advanced biomechanical gait analysis therefore holds the potential to assess in a limited number of patients the effect of exercise walking programs, medication regimens and revascularization to determine the degree to which the gait dysfunction of claudicating patients is ultimately recoverable.
Acknowledgments
Support for this work was provided by funds from the Alexander S. Onassis Public Benefit Foundation to PK, the American Geriatrics Society’s Hartford Foundation Dennis W. Jahnigen Award to JMJ, the Nebraska Research Initiative to NS, the Lifeline Programs of the American Vascular Association to IIP and the NIH to NS (K25HD047194) and IIP (K08HL079967).
References
- 1.Hooi JD, Kester AD, Stoffers HE, Overdijk MM, van Ree JW, Knottnerus JA. Incidence of and risk factors for asymptomatic peripheral arterial occlusive disease: a longitudinal study. Am J Epidemiol. 2001;153(7):666–672. doi: 10.1093/aje/153.7.666. [DOI] [PubMed] [Google Scholar]
- 2.Atkins LM, Gardner AW. The relationship between lower extremity functional strength and severity of peripheral arterial disease. Angiology. 2004;55(4):347–355. doi: 10.1177/000331970405500401. [DOI] [PubMed] [Google Scholar]
- 3.Gardner AW, Clancy RJ. The relationship between ankle-brachial index and leisure-time physical activity in patients with intermittent claudication. Angiology. 2006;57(5):539–545. doi: 10.1177/0003319706293114. [DOI] [PubMed] [Google Scholar]
- 4.Liles DR, Kallen MA, Petersen LA, Bush RL. Quality of life and peripheral arterial disease. J Surg Res. 2006;136(2):294–301. doi: 10.1016/j.jss.2006.06.008. [DOI] [PubMed] [Google Scholar]
- 5.Regensteiner JG, Stewart KJ. Established and evolving medical therapies for claudication in patients with peripheral arterial disease. Nat Clin Pract Cardiovasc Med. 2006;3(11):604–610. doi: 10.1038/ncpcardio0660. [DOI] [PubMed] [Google Scholar]
- 6.McDermott MM, Ohlmiller SM, Liu K, Guralnik JM, Martin GJ, Pearce WH, Greenland P. Gait alterations associated with walking impairment in people with peripheral arterial disease with and without intermittent claudication. Journal of the American Geriatrics Society. 2001;49(6):747–754. doi: 10.1046/j.1532-5415.2001.49151.x. [DOI] [PubMed] [Google Scholar]
- 7.Crowther RG, Spinks WL, Leicht AS, Quigley F, Golledge J. Relationship between temporal-spatial gait parameters, gait kinematics, walking performance, exercise capacity, and physical activity level in peripheral arterial disease. J Vasc Surg. 2007;45(6):1172–1178. doi: 10.1016/j.jvs.2007.01.060. [DOI] [PubMed] [Google Scholar]
- 8.McDermott MM, Mehta S, Liu K, Guralnik JM, Martin GJ, Criqui MH, Greenland P. Leg symptoms, the ankle-brachial index, and walking ability in patients with peripheral arterial disease. J Gen Intern Med. 1999;14(3):173–181. doi: 10.1046/j.1525-1497.1999.00309.x. [DOI] [PMC free article] [PubMed] [Google Scholar]
- 9.Scherer SA, Bainbridge JS, Hiatt WR, Regensteiner JG. Gait characteristics of patients with claudication. Arch Phys Med Rehabil. 1998;79(5):529–531. doi: 10.1016/s0003-9993(98)90067-3. [DOI] [PubMed] [Google Scholar]
- 10.Crowther RG, Spinks WL, Leicht AS, Quigley F, Golledge J. Lower limb movement variability in patients with peripheral arterial disease. Clin Biomech (Bristol, Avon) 2008;23(8):1080–1085. doi: 10.1016/j.clinbiomech.2008.04.008. [DOI] [PubMed] [Google Scholar]
- 11.Kaufman KR, Hughes C, Morrey BF, Morrey M, An KN. Gait characteristics of patients with knee osteoarthritis. Journal of Biomechanics. 2001;34(7):907–915. doi: 10.1016/s0021-9290(01)00036-7. [DOI] [PubMed] [Google Scholar]
- 12.McGibbon CA, Krebs DE. Compensatory gait mechanics in patients with unilateral knee arthritis. The Journal of rheumatology. 2002;29(11):2410–2419. [PubMed] [Google Scholar]
- 13.Centomo H, Amarantini D, Martin L, Prince F. Kinematic and kinetic analysis of a stepping-in-place task in below-knee amputee children compared to able-bodied children. IEEE transactions on neural systems and rehabilitation engineering: a publication of the IEEE Engineering in Medicine and Biology Society. 2007;15(2):258–265. doi: 10.1109/TNSRE.2007.897005. [DOI] [PubMed] [Google Scholar]
- 14.Loizeau J, Allard P, Duhaime M, Landjerit B. Bilateral gait patterns in subjects fitted with a total hip prosthesis. Archives of Physical Medicine and Rehabilitation. 1995;76(6):552–557. doi: 10.1016/s0003-9993(95)80510-9. [DOI] [PubMed] [Google Scholar]
- 15.DeVita P, Hortobagyi T, Barrier J. Gait biomechanics are not normal after anterior cruciate ligament reconstruction and accelerated rehabilitation. Med Sci Sports Exerc. 1998;30(10):1481–1488. doi: 10.1097/00005768-199810000-00003. [DOI] [PubMed] [Google Scholar]
- 16.DeVita P, Hortobagyi T. Age causes a redistribution of joint torques and powers during gait. Journal of applied physiology (Bethesda, Md: 1985) 2000;88(5):1804–1811. doi: 10.1152/jappl.2000.88.5.1804. [DOI] [PubMed] [Google Scholar]
- 17.Kerrigan DC, Todd MK, Della Croce U, Lipsitz LA, Collins JJ. Biomechanical gait alterations independent of speed in the healthy elderly: evidence for specific limiting impairments. Archives of Physical Medicine and Rehabilitation. 1998;79(3):317–322. doi: 10.1016/s0003-9993(98)90013-2. [DOI] [PubMed] [Google Scholar]
- 18.McGibbon CA, Krebs DE. Age-related changes in lower trunk coordination and energy transfer during gait. Journal of neurophysiology. 2001;85(5):1923–1931. doi: 10.1152/jn.2001.85.5.1923. [DOI] [PubMed] [Google Scholar]
- 19.Riley PO, DellaCroce U, Kerrigan DC. Effect of age on lower extremity joint moment contributions to gait speed. Gait & posture. 2001;14(3):264–270. doi: 10.1016/s0966-6362(01)00133-3. [DOI] [PubMed] [Google Scholar]
- 20.Chen SJ, Pipinos I, Johanning J, Radovic M, Huisinga JM, Myers SA, Stergiou N. Bilateral claudication results in alterations in the gait biomechanics at the hip and ankle joints. J Biomech. 2008;41(11):2506–2514. doi: 10.1016/j.jbiomech.2008.05.011. [DOI] [PubMed] [Google Scholar]
- 21.Kadaba MP, Ramakrishnan HK, Wootten ME. Measurement of lower extremity kinematics during level walking. Journal Of Orthopaedic Research: Official Publication Of The Orthopaedic Research Society. 1990;8(3):383–392. doi: 10.1002/jor.1100080310. [DOI] [PubMed] [Google Scholar]
- 22.Houck J, Yack HJ, Cuddeford T. Validity and comparisons of tibiofemoral orientations and displacement using a femoral tracking device during early to mid stance of walking. Gait & Posture. 2004;19(1):76–84. doi: 10.1016/s0966-6362(03)00033-x. [DOI] [PubMed] [Google Scholar]
- 23.Kirby RL, Marlow RW. Reliability of walking endurance with an incremental treadmill test. Angiology. 1987;38(7):524–529. doi: 10.1177/000331978703800705. [DOI] [PubMed] [Google Scholar]
- 24.DiBianco R, Morganroth J, Freitag JA, Ronan JA, Jr, Lindgren KM, Donohue DJ, Larca LJ, Chadda KD, Olukotun AY. Effects of nadolol on the spontaneous and exercise-provoked heart rate of patients with chronic atrial fibrillation receiving stable dosages of digoxin. American Heart Journal. 1984;108(4 Pt 2):1121–1127. doi: 10.1016/0002-8703(84)90592-1. [DOI] [PubMed] [Google Scholar]
- 25.Winter DA, Patla AE, Frank JS, Walt SE. Biomechanical walking pattern changes in the fit and healthy elderly. Phys Ther. 1990;70(6):340–347. doi: 10.1093/ptj/70.6.340. [DOI] [PubMed] [Google Scholar]
- 26.Scott-Pandorf MM, Stergiou N, Johanning JM, Robinson L, Lynch TG, Pipinos II. Peripheral arterial disease affects ground reaction forces during walking. Journal of vascular surgery: official publication, the Society for Vascular Surgery [and] International Society for Cardiovascular Surgery, North American Chapter. 2007;46(3):491–499. doi: 10.1016/j.jvs.2007.05.029. [DOI] [PubMed] [Google Scholar]
- 27.Kuo HK, Yu YH. The relation of peripheral arterial disease to leg force, gait speed, and functional dependence among older adults. J Gerontol A Biol Sci Med Sci. 2008;63(4):384–390. doi: 10.1093/gerona/63.4.384. [DOI] [PubMed] [Google Scholar]
- 28.McDermott MM, Tian L, Ferrucci L, Liu K, Guralnik JM, Liao Y, Pearce WH, Criqui MH. Associations between lower extremity ischemia, upper and lower extremity strength, and functional impairment with peripheral arterial disease. J Am Geriatr Soc. 2008;56(4):724–729. doi: 10.1111/j.1532-5415.2008.01633.x. [DOI] [PMC free article] [PubMed] [Google Scholar]
- 29.Scott-Okafor HR, Silver KK, Parker J, Almy-Albert T, Gardner AW. Lower extremity strength deficits in peripheral arterial occlusive disease patients with intermittent claudication. Angiology. 2001;52(1):7–14. doi: 10.1177/000331970105200102. [DOI] [PubMed] [Google Scholar]
- 30.Neptune RR, Kautz SA, Zajac FE. Contributions of the individual ankle plantar flexors to support, forward progression and swing initiation during walking. Journal of Biomechanics. 2001;34(11):1387–1398. doi: 10.1016/s0021-9290(01)00105-1. [DOI] [PubMed] [Google Scholar]
- 31.Celis R, Pipinos II, Scott-Pandorf MM, Myers SA, Stergiou N, Johanning JM. Peripheral arterial disease affects kinematics during walking. J Vasc Surg. 2009;49(1):127–132. doi: 10.1016/j.jvs.2008.08.013. [DOI] [PubMed] [Google Scholar]
- 32.Pipinos II, Judge AR, Selsby JT, Zhu Z, Swanson SA, Nella AA, Dodd SL. The myopathy of peripheral arterial occlusive disease: part 1. Functional and histomorphological changes and evidence for mitochondrial dysfunction. Vascular and endovascular surgery. 2007;41(6):481–489. doi: 10.1177/1538574407311106. [DOI] [PubMed] [Google Scholar]
- 33.Pipinos II, Judge AR, Selsby JT, Zhu Z, Swanson SA, Nella AA, Dodd SL. The myopathy of peripheral arterial occlusive disease: Part 2. Oxidative stress, neuropathy, and shift in muscle fiber type. Vascular and endovascular surgery. 2008;42(2):101–112. doi: 10.1177/1538574408315995. [DOI] [PMC free article] [PubMed] [Google Scholar]
- 34.Pipinos II, Judge AR, Zhu Z, Selsby JT, Swanson SA, Johanning JM, Baxter BT, Lynch TG, Dodd SL. Mitochondrial defects and oxidative damage in patients with peripheral arterial disease. Free radical biology & medicine. 2006;41(2):262–269. doi: 10.1016/j.freeradbiomed.2006.04.003. [DOI] [PubMed] [Google Scholar]
- 35.Pipinos II, Sharov VG, Shepard AD, Anagnostopoulos PV, Katsamouris A, Todor A, Filis KA, Sabbah HN. Abnormal mitochondrial respiration in skeletal muscle in patients with peripheral arterial disease. Journal of vascular surgery: official publication, the Society for Vascular Surgery [and] International Society for Cardiovascular Surgery, North American Chapter. 2003;38(4):827–832. doi: 10.1016/s0741-5214(03)00602-5. [DOI] [PubMed] [Google Scholar]
- 36.Pipinos II, Shepard AD, Anagnostopoulos PV, Katsamouris A, Boska MD. Phosphorus 31 nuclear magnetic resonance spectroscopy suggests a mitochondrial defect in claudicating skeletal muscle. Journal of vascular surgery: official publication, the Society for Vascular Surgery [and] International Society for Cardiovascular Surgery, North American Chapter. 2000;31(5):944–952. doi: 10.1067/mva.2000.106421. [DOI] [PubMed] [Google Scholar]
- 37.Weber F, Ziegler A. Axonal neuropathy in chronic peripheral arterial occlusive disease. Muscle & nerve. 2002;26(4):471–476. doi: 10.1002/mus.10235. [DOI] [PubMed] [Google Scholar]
- 38.Bhat HK, Hiatt WR, Hoppel CL, Brass EP. Skeletal muscle mitochondrial DNA injury in patients with unilateral peripheral arterial disease. Circulation. 1999;99(6):807–812. doi: 10.1161/01.cir.99.6.807. [DOI] [PubMed] [Google Scholar]
- 39.Brass EP, Wang H, Hiatt WR. Multiple skeletal muscle mitochondrial DNA deletions in patients with unilateral peripheral arterial disease. Vasc Med. 2000;5(4):225–230. [PubMed] [Google Scholar]