

Summary
Nomograms are commonly used tools to estimate prognosis in oncology and medicine. With the ability to generate an individual numerical probability of a clinical event by integrating diverse prognostic and determinant variables, nomograms fulfill our desire for biologically and clinically integrated models and our drive towards personalized medicine. Rapid computation through user friendly digital interfaces, together with increased accuracy, and more easily understood prognoses compared to conventional staging, allow for seamless incorporation of nomogram derived prognosis to aid in clinical decision making. This has lead to the ubiquitous appearance of nomograms on the internet and in medical journals, and increasing nomogram use by patients and physicians alike. However, the statistical foundations of nomogram construction, their precise interpretation, and evidence supporting their use is commonly misunderstood, leading to an under appreciation of the inherent uncertainties regarding nomogram use. We provide a systematic, practical approach to evaluating and comprehending nomogram derived prognoses, with particular emphasis on clarifying common misconceptions and highlighting limitations.
Keywords: prognosis, outcome, staging, oncology
Introduction
Disease prognostication is an integral component of oncology and medicine. With the promise of an estimated numerical prognosis for every patient, nomograms have been proposed as a means to improve disease prognostication. Despite their meteoric rise in development and use,(1) their method of construction, interpretation, and impact on patients remains incompletely understood by the medical community. Herein we evaluate nomograms by considering the rationale for their use, clarify critical components of their construction, interpretation, and application, and highlight common misconceptions.
What is a nomogram?
Nomograms are a pictorial representation of a complex mathematical formula.(1) Medical nomograms use biologic and clinical variables, such as tumor grade and patient age, to graphically depict a statistical prognostic model that generates a probability of a clinical event, such as cancer recurrence or death, for a given individual. There are 2 primary ways nomograms are used. One is pictorially where each variable is listed separately, with a corresponding number of points assigned to a given magnitude of the variable. Then, the cumulative point score for all the variables is matched to a scale of outcome (Figure 1A). Alternatively, the formula is contained in a computer or smart phone based calculator, where specific variables are entered and the likelihood of an event is computed
Figure 1. Using and interpreting a nomogram.
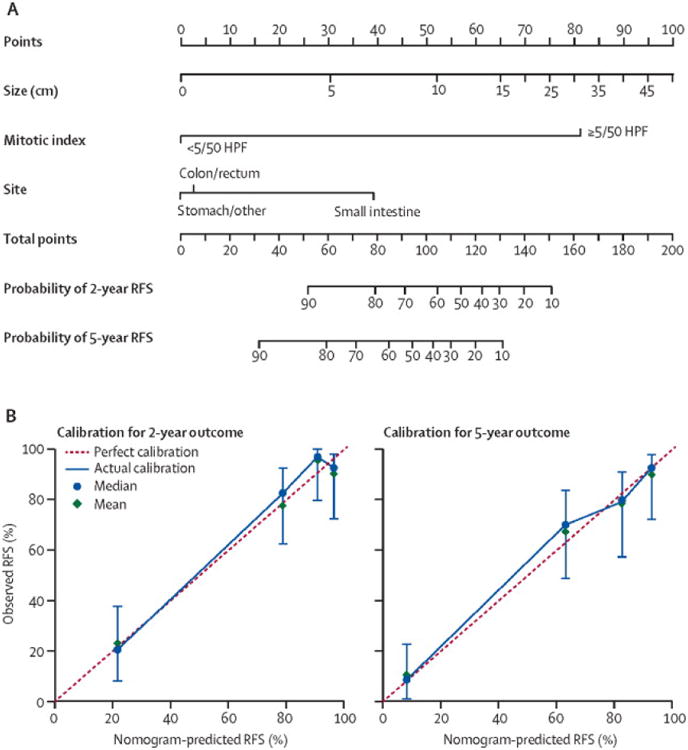
A. A nomogram example – estimating recurrence-free survival (RFS) in resected primary gastrointestinal stromal tumor (GIST).
Draw an upward vertical line to the “Points” bar to calculate points. Based on the sum, draw a downward vertical line from the “Total Points” line to calculate RFS.(14)
B. Calibration curves of a nomogram estimating RFS in resected primary GIST.
Red line: nomogram RFS = observed RFS. Blue line - actual calibration. Circles - median. X - mean. 95% confidence intervals are depicted for each point along the calibration curve.(14)
Rationale for use
The gold standard for prognostication in oncology remains the TNM (Tumor-Node-Metastasis) staging system. Initially proposed in 1953 by the French surgeon Pierre Denoix as a common language for solid tumor prognosis,(2) it is rooted in the Halstedian principle of temporal determinism that solid tumors spread sequentially from the primary site to lymphatics, then to distant organs, categorizing patients by anatomic spread of disease and survival. However, the TNM system has several drawbacks. First, it is constrained by requiring a correlation between anatomic disease progression and upward stage progression. Hence, patients with equivalent anatomic spread yet variable outcomes (recurrence or survival) are forced into the same stage, introducing heterogeneity. Second, TNM staging is unable to incorporate tumor, nodes, or metastases as continuous variables. This creates a system with a finite number of stages, complicating the determination of an individual patient's prognosis. Third, the TNM system links prognosis to descriptive, not determinant, variables – it purely states that if you are anatomically further along in the course of your disease, your prognosis will be worse, without incorporating other variables that govern prognosis, such as genetic differences, tumor mitotic rate, or histology.
Given the limitations of TNM staging, nomograms have emerged as a simpler, more sophisticated tool with numerous advantages. One of the primary advantages is their ability to estimate individualized risk based on patient and disease characteristics. Proponents cite that nomograms can also incorporate continuous variables and relevant determinants of disease into prognosis,(3-6) are user-friendly, and superior to clinician judgment in estimating disease course.(7-9) In oncology, nomograms have potential to impact all aspects of cancer care. Preoperative nomograms estimating the risk of positive surgical margins,(10) and lymph node metastases(11-13) may assist clinicians in identifying patients who may derive greater benefit from more extensive surgery. Postoperative nomograms estimating recurrence,(14-16) cancer specific survival,(17-19) overall survival,(20-22) benefit of adjuvant therapies,(23-25) and the impact of treatment on quality of life,(26, 27) may assist patients and physicians alike in all aspects of decision making. Although nomograms represent a major advance in the development of prognostication tools, their proper clinical application requires a thorough understanding of the nomogram specific question, study population, method of construction, and outcome, to clearly assess its applicability to a particular patient's clinical scenario. Additionally, the ability to interpret nomogram performance and assess specific limitations is essential to appropriately counsel patients on the meaning, accuracy, and assumptions embedded in nomogram risk estimations.
Nomogram Construction
The question, the study population, and the outcome
The most important step in construction is to identify a “good question” (Table 1). Nomograms are best derived to answer a focused, clinically relevant question that requires a mathematical model to answer. Not all clinical questions require a nomogram – for instance, given the lack of benefit demonstrated with routine nasogastric (NG) tube decompression(28) and their decreasing routine use in clinical practice, a nomogram to estimate NG tube insertion distance may have minimal utility.(29) Next, the patient cohort that will be used to derive the nomogram is selected. It should be representative of the general population with the disease, and its definition transparent so readers may evaluate its applicability to their patients. Single institution cohorts may have more complete datasets, yet may be biased by institutional practice patterns, which can be overcome by using multi-institutional or national databases. Next, choose the outcome defining the question - typically various types of recurrence (local, distant, or both) or survival. Attention should be paid to disease specific survival (DSS) that reflects the natural history of a patient's disease versus overall survival (OS), which reflects the cumulative effect of competing diseases and age on a patient's survival. The primary outcome should have a clear, well-accepted definition, and be easily and reproducibly measured.
Table 1. Nomogram Checklist.
Construction
|
Performance
|
Application
|
AUC – area under the curve, CI – concordance index.
Method of construction
The next step involves selecting variables (covariates) that may determine the outcome based on a priori clinical hypotheses. This approach avoids excluding covariates based on incomplete data and selection purely based on statistical significance. Covariates may be tumor specific, such as tumor size, depth of penetration, and lymphovascular invasion, as well as patient specific, such as age and sex. Treatment per se should be avoided as a covariate unless there are validated data from a randomized clinical trial.
Following variable selection, one must choose a statistical model. The most common model for fitting Kaplan Meier survival curves is the Cox proportional hazards model. The Cox model generates a hazard function h(t) (failure rate at time t for patients surviving to time t) as a function of the covariates. It estimates the number of new events in unit time among the population at risk, in contrast to a logistic regression model that evaluates the proportion of new events per unit time in the entire population. A logistic regression can be used when a single time point (such as five-year survival) is of interest and all the patients who are alive have follow-up beyond that time point. After a statistical model is selected, multivariate analyses are performed to determine the association between the covariates and the outcome, adjusting for all the other variables in the model. Covariate inclusion in a multivariate analysis should follow Harrell's guideline (the number of events should exceed the number of covariates by at least 10 fold).(30) Inclusion of more covariates does not necessarily lead to higher accuracy, but rather to overfitting and should be avoided. The model is then derived using the formula:
where β are the regression coefficients and x are the observed values of the covariates. S0(t) is called the baseline survival function and is also estimated from the data. Regression coefficients are used to construct the variable axes in the nomogram and S0 is used in the translation from total points to predicted probability (Figure 1).(31)
Nomogram Performance
Validation
Validation is the process of testing the model on different populations to obtain unbiased estimates of model performance and judging its applicability to these populations. External validation, preferably in multiple, disparate datasets, is the gold standard and should be obtained whenever possible. Unfortunately, most nomograms (including those at our own institution, Table 2) commonly report results with only internal validation. Cross-validation and bootstrapping are examples of internal validation whereby the model is iteratively applied to randomly selected sample sets of the original cohort. These methods prevent data over interpretation but do not remove all the bias due to possible overfitting inherent to variable and threshold selection, or assess accuracy in different patient populations.
Table 2. Discrimination and validation of Memorial Sloan Kettering nomograms available on the internet.
| Cancer | Primary Endpoint | Journal, Year of Publication | Validation | AUC * |
|---|---|---|---|---|
| Bladder43 | RFS after cystectomy | JCO 2006 | Internal | 0.75 |
| Breast37 | Additional nodal metastases with + SLN | Ann Surg Onc 2003 | Internal | 0.76 |
| Breast44 | SLN positivity | JCO 2007 | Internal | 0.75 |
| Breast45 | LRFS following DCIS excision | JCO 2010 | Internal | 0.70 |
| Many46 | Drug related toxicity in Phase I trials | JCO 2014 | External | 0.60 |
| Colon13 | RFS after resection | JCO 2008 | Internal | 0.77 |
| Colon6 | OS after resection | JCO 2011 | Internal | 0.68 |
| Endometrium47 | OS after primary therapy | Gynecol Oncol 2010 | Internal | 0.75 |
| Stomach18 | DSS after resection | JCO 2003 | Internal | 0.80 |
| GIST14 | RFS after resection | Lancet Oncol 2009 | External | 0.78 |
| Melanoma5 | SLN positivity | Ann Surg Onc 2005 | External | 0.69 |
| Ovary48 | DSS after surgery | Gynecol Oncol 2012 | Internal | 0.71 |
| Prostate49 | RFS after brachytherapy | Urology 2001 | External | 0.61- 0.64+ |
| Prostate50 | OS with metastatic disease | JCO 2002 | External | 0.71 |
| Prostate51 | Probability of indolent cancer | J Urol 2003 | Internal | 0.69- 0.74 |
| Prostate52 | Lymph node negativity after prostatectomy | J Urol 2003 | Internal | 0.76 |
| Prostate53 | Seminal vesicle invasion | J Urol 2003 | Internal | 0.88 |
| Prostate54 | Presence, side of extracapsular extension | J Urol 2004 | Internal | 0.80 |
| Prostate55, 56 | RFS after prostatectomy | JCO 2005, J Natl Cancer Inst 2006 | External | 0.86, 0.76 |
| Prostate57 | PFS after salvage radiation | JCO 2007 | Internal | 0.69 |
| Prostate58 | DSS after prostatectomy | JCO 2009 | External | 0.82+ |
| Renal cell59 | RFS after surgery | J Urol 2001 | Internal | 0.74 |
| Sarcoma60 | DSS after surgery for liposarcoma | Ann Surg 2006 | Internal | 0.82 |
| Sarcoma61 | DSS after surgery for synovial sarcoma | Clin Can Res 2008 | Internal | 0.77 |
| Sarcoma62 | LRFS after surgery for extremity sarcoma | Ann Surg 2012 | Internal | 0.73 |
| Thyroid63 | Hypocalcemia after surgery | Arch Otolaryngol Head Neck Surg. 2011 | Internal | 0.74 |
| Uterine sarcoma20 | OS after therapy | Cancer 2012 | Internal | 0.65 |
in the derivation cohort.
in the validation cohort.
RFS – Recurrence-free survival; SLN – Sentinel lymph node; LRFS – Local recurrence-free survival
DCIS – Ductal Carcinoma In Situ
OS – Overall survival; DSS – Disease-specific survival; NR – not reported
It is expected that the performance of a nomogram on the validation set will be slightly worse than on the original data set. If substantially worse, validation on a population more similar to the derivation cohort, identifying sources of overfitting by decreasing the number of variables, and avoiding thresholds are possible courses of action. A substantially degraded nomogram performance in external data does not necessarily render the nomogram invalid. If performance metrics are still in the clinically acceptable range it would be appropriate to recommend the nomogram for routine use. What constitutes acceptable depends on clinicians and patients weighing the performance of competing prediction tools available for a particular disease, with the performance (discrimination, calibration, and clinical utility) of the nomogram in question. However, all nomograms prior to clinical application should be validated in a cohort with similar characteristics as the cohort to which the nomogram will be applied. Knowledge of the discrimination and calibration of the nomogram in this patient cohort will then allow clinicians and patients to comprehensively assess how reliably and accurately the nomogram performs. This point notwithstanding, any major difference in performance is an opportunity to improve the model by scrutinizing the model selection process and the differences between the development and validation data sets.
Discrimination
Discrimination is the ability to distinguish between patients who experience an event from those who do not. Measured by the concordance index (CI), it is the area under the curve (AUC) of a receiver operating curve (ROC) that plots sensitivity against 1-specificity of the nomogram. Hence the CI or AUC (often used interchangeably) is measured on a scale of 0.5 (no better than chance) to 1 (perfect discrimination). If the CI of a nomogram is 0.65, it can discern a patient with an event from a patient without an event 65% of the time. Consider a 50-year old male with a 10 cm gastric GIST with 10 mitoses/50 high power fields (HPF). This patient's nomogram calculated 2-year risk of recurrence (AUC of 0.78) is 70% (Figure 1A; nomogram calculations are as follows: size = 10 cm, which corresponds to 54 points; mitotic index = 10/50 HPF, which corresponds to 81 points; site = stomach, which corresponds to 0 points; this equals 135 total points, corresponding to 2-year recurrence free survival (RFS) of 30% (recurrence of 70%), and 5-year RFS of 10% (recurrence of 90%)).(14) Hence at 2 years, the patient has a 70% risk of recurrence, calculated by a nomogram that can identify a recurrence 78% of the time. It is instructive to point out that the AUC does not estimate the accuracy of the prediction – it does not mean “70% recurrence rate with 78% accuracy”. In fact, note how for a given nomogram in a given patient population, the AUC remains constant irrespective of nomogram estimations for individual patients. Note that when the nomogram is applied to a different cohort, the AUC may differ.
Calibration
Calibration estimates how close the nomogram estimated risk is to the observed risk, depicted by a calibration plot (Figure 2). Note it is the calibration and not discrimination that indicates how close the nomogram prediction is to the actual risk – i.e., calibration indicates how accurate it is to tell a patient that the 2-year risk of recurrence is 70%. There are several important features of a calibration plot. First, calibration varies with nomogram calculated probabilities. For instance, the GIST nomogram is more accurate at predicting a recurrence of 20% than 80% (Figure 1B; note how at a recurrence of 20%, the blue circle overlaps the red dotted line indicating near perfect calibration however at a recurrence of 80%, the blue circle and red dotted line do not overlap).(14) Second, prediction probabilities are characterized by confidence intervals, adding an additional degree of uncertainty to a nomogram estimation. Lastly, calibration, like discrimination, depends on the patient cohort to which the nomogram is applied. It is not an intrinsic property of a nomogram, but rather an evaluation of how it performs in a particular cohort.
Figure 2. Assessing clinical utility using a decision analysis curve.
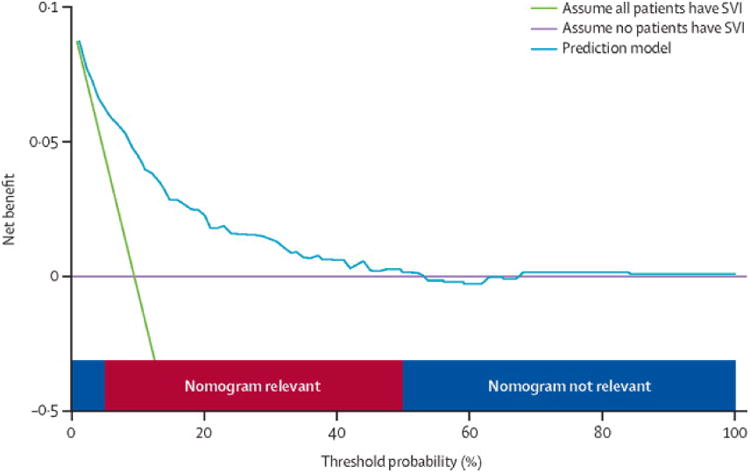
Decision analysis curve of a nomogram predicting seminal vesicle invasion (SVI) in prostate cancer. At a threshold probability of < 5%, > 50%, the nomogram is irrelevant.(32)
Clinical Utility
The last component of evaluating nomogram performance is clinical utility, assessing if nomogram assisted decisions improve patient outcomes. The definitive answer to whether nomogram assisted decisions improve patient outcomes lies in prospective evaluation – randomizing patients to nomogram or non-nomogram based decisions and comparing outcomes. However prospective validation of every nomogram prior to use is tedious and largely impractical. Other tools exist to evaluate the effects of prediction models on clinical decisions. Vickers and Elkin have introduced decision analysis curves that estimate clinical utility of prediction models based on the threshold probability (probability that triggers a medical intervention by a physician or patient, equating to the probability at which the harm of a false-positive intervention exceeds the harm of a false-negative non-intervention).(32) The threshold probability is used to derive the net benefit (defined as the fraction of true-positives subtracted by the fraction of false-positives weighted by the relative harm of a false-positive and false-negative result, Figure 2). Graphical analysis of the net benefit against the threshold probability yields a decision analysis curve, which can then be used to assess the net benefit of nomogram-assisted decisions at different threshold probabilities, compared to the net benefit of decisions made with the assumption that either all or no patient has the outcome of interest (Figure 2). For instance, if a physician's threshold probability to dissect the seminal vesicle while performing a radical prostatectomy is either < 5% or >50% risk of seminal vesicle invasion (SVI), nomogram assisted decisions at these threshold probabilities are irrelevant as the net benefit is equal to assuming all or no patients have SVI (Figure 2).
Nomogram Limitations
Nomograms assume data are static in time
Nomograms assume that outcomes remain constant over time. Consider the nomogram estimating OS after complete resection of primary colon cancer, derived from a SEER database cohort of nearly 129,000 surgical patients between 1994 and 2005.(6) The nomogram is built on the assumption that all future disease outcomes will be identical to those between 1994 and 2005. However, the overall mortality rate for colon cancer patients in SEER has been steadily falling at a rate of 2.9%/year.(33) Consequently, a nomogram can become less accurate with time for a variety of reasons, such as improvements in therapy, earlier detection, and changes in natural history. Another limitation is that despite a purported advantage being the ability to provide a real time prognosis, most nomograms cannot fulfill this expectation, as they do not incorporate conditional survival. For example, for a 60-year male with a preoperative serum CEA of 10, T2 colon adenocarcinoma, and 10/50 positive lymph nodes who will undergo adjuvant chemotherapy, 5-year recurrence after resection is estimated at 9%.(15) However, if the CEA level rises from 10 to 60 after a 1-year disease free interval, the nomogram is unable to generate an updated risk of recurrence. Hence, nomograms provide prognosis at diagnosis not at evaluation, limiting their utility. It is possible to generate nomograms that will work after diagnoses but this will be a different nomogram, not a modification of the original one.
Nomogram performance lacks accepted standards of reporting and can be highly variable
Although both discrimination and calibration are equally essential components in assessing nomogram performance, only discrimination is commonly reported in abstracts and calibration is not, as this requires a graphical representation of the data. Calibration plots may be altogether omitted, or often are incompletely displayed without confidence intervals, rendering it impossible to assess nomogram accuracy at different estimated probabilities. Nomogram performance can also be mediocre. In an analysis of 19 nomograms in 8 reports in The Lancet Oncology and The Journal of Clinical Oncology in 2012-2013, the median AUC was 0.74. Although this is typically better discrimination than staging, one can argue that this is closer to chance (AUC 0.5) than to certainty (AUC 1). Only 12 of 28 (43%) of our institutional nomograms available on the internet for patient use have an AUC greater than 0.75 (Table 2).
Nomograms can also be highly dependent on the methods of covariate measurement. Stephan and colleagues found significant variability in 3 nomograms estimating the risk of prostate cancer based on prostate-specific antigen (PSA) measurements using 5 different commercial PSA assays.(34) As another example, determination of grade(35) and histologic subtype(36) for sarcomas can demonstrate significant variability based on the expertise of the pathologist. Note that more covariates do not imply greater accuracy. It merely introduces a potential range of errors into a nomogram, stemming from variability in covariate measurement to effects on primary outcome and other covariates, increasing nomogram inaccuracy.
Discrimination can also vary if applied to different cohorts, despite excellent discrimination in the derivation cohort. For instance, the Memorial Sloan Kettering nomogram estimating non-sentinel lymph node (SLN) positivity based on SLN characteristics reported an AUC of 0.77.(37) The same nomogram applied to different cohorts yielded AUCs ranging from 0.58 to 0.82, demonstrating that in some cohorts the nomogram was almost equivalent to chance.(38) The true measure of applicability for a given patient is successful nomogram validation in a cohort with similar characteristics, demographics, and disease outcomes. Discrimination also varies with length of follow-up and degree of censoring. If nomogram A and nomogram B have AUCs of 0.66 and 0.76 respectively, it does not follow that nomogram B is superior to nomogram A. Heavily censored data will overestimate nomogram AUC using the most commonly used methods of AUC estimation10 whereas longer follow-up with capture of more events will tend to decrease the AUC. There are methods that avoid this but are not in common use.(39) Therefore, although the AUC of nomogram B exceeds that of nomogram A, this may just reflect features of the data from which they were derived.
The effects of nomogram-assisted decisions on patient satisfaction and outcomes are unclear
While discrimination and calibration are equally important in nomogram evaluation, conveying these concepts to a patient is challenging. Consider how to explain a 2-year recurrence rate of 25% estimated using a nomogram with an AUC of 0.78. “At 2 years, you have a 25% recurrence rate, using a tool that can tell recurrence versus no recurrence 78% of time. Should we also convey accuracy - the observed probability and confidence intervals at a prediction probability of 25%? How about what a confidence interval is? Will this be confused with a concordance index? Although nomogram usage has been exponentially increasing, there are limited data on patient comprehension, satisfaction, or quality of life with nomogram assisted medical decisions. Furthermore, despite the widespread clinical use of nomograms, they are rarely evaluated prospectively to identify whether their use actually improves patient outcomes over other clinical decision making tools. Ross and colleagues retrospectively evaluated the performance of nomograms compared to clinician management. Based on a Medline search yielding 22 studies comparing nomogram use to physician management and 2 experiments where clinical vignettes were shown to physicians followed by comparison of nomogram and clinician estimations, nomograms were found to be superior to clinician judgment.(7) However, only 13/22 (59%) studies in their search actually demonstrated that nomograms were superior to clinician judgment. The conclusion that nomograms performed better than clinicians was also purely based on AUC, which does not equate to improved clinical utility. Other authors have drawn similar conclusions based solely on nomogram AUC and not clinical utility.(8)
Good performance does not imply good clinical utility
In a multi-institutional prospective study of 2,130 patients, Nam and colleagues studied 2 nomograms that estimate the risk of prostate cancer and need for biopsy based on abnormal PSA and/or digital rectal examination.(40) Both nomograms had comparable discrimination (0.72, and 0.67) and calibration. However, the investigators discovered that under a threshold probability of 30%, using either nomogram did not yield a net benefit compared to the scenario where all patients were biopsied. In fact, one of the nomograms demonstrated a decreased net benefit compared to biopsy of all patients, suggesting that nomogram use may in fact be harmful. Hence, nomograms can lack clinical utility despite having good performance, and assessing whether a nomogram improves patient and physician satisfaction, quality of life, and oncologic outcomes is often ignored. It also follows that if the AUC of nomogram A is greater than the AUC of nomogram B, it does not mean nomogram A is more clinically useful.
Patient selection for therapy should ideally be based on clinical trials not nomograms
One argument for using nomograms is risk stratification to determine the need for additional therapy. We would argue that if the decision to administer therapy is founded in a clinical trial, then patient selection should follow the inclusion and exclusion criteria of the trial. Following results of the ACOSOG Z11 trial that demonstrated no benefit to completion axillary lymphadenectomy in patients with limited SLN metastatic breast cancer,(41) clinical decisions at our institution have been guided by these results rather than the Memorial nomogram assessing non-SLN positivity.17 Although nomograms are being used to define eligibility for clinical trials,(42) treatment decisions in these scenarios should be guided by both nomogram determined entry criteria and subsequent therapy associated benefit, and not merely nomogram estimated risk.
What effect does a high probability of recurrence/death have on a patient?
A poor nomogram estimated probability can be a source of significant distress to patients and families, which can be compounded by confusion surrounding nomogram interpretation. Public availability of nomograms make these scenarios increasingly likely (Table 2). The downstream consequences of these effects on patients' subjective impressions of their illness, their relationship with physicians, families, and the desire for more testing are difficult to determine, yet likely significant and remain currently unknown.
Conclusion
Nomograms are an important component of modern medical decision making. A carefully constructed nomogram designed to answer a focused question, when appropriately interpreted and applied, can be very valuable to clinicians and patients. However, they must undergo rigorous scrutiny and their performance and limitations need to be appreciated prior to using them in clinical decision making. Only in this way may nomograms enable better prognostication for patients.
Methods
Search strategy and selection criteria
We undertook a computerized literature search in PubMed from Jan 1, 1994, to Dec 31, 2013, of papers published in English with the following search terms used alone or in combination: “nomogram”, “medical nomogram”, “cancer staging”, “nomogram construction”, “nomogram interpretation”, “understanding nomograms”, “nomogram limitations”, “patient understanding of nomograms”, “nomograms and clinicians”, “nomogram prospective trial”, and “decision analysis curve”. Due to limited citation space, publications were selected for citation if they highlighted the rationale for nomogram development, or illustrated components of nomogram construction, interpretation, limitations, or misconceptions as it pertained to understanding cancer nomograms.
Acknowledgments
Grant support: NIH P30 CA008748 and NIH R01 CA102613
Footnotes
Conflict of interest: None
Author contributions: VPB, MG, JJS, and RPD conceived the idea for the review, reviewed the scientific literature, and prepared the manuscript.
Ethics Committee Approval: Not applicable
Publisher's Disclaimer: This is a PDF file of an unedited manuscript that has been accepted for publication. As a service to our customers we are providing this early version of the manuscript. The manuscript will undergo copyediting, typesetting, and review of the resulting proof before it is published in its final citable form. Please note that during the production process errors may be discovered which could affect the content, and all legal disclaimers that apply to the journal pertain.
References
- 1.Grimes DA. The nomogram epidemic: resurgence of a medical relic. Ann Intern Med. 2008 Aug 19;149(4):273–5. doi: 10.7326/0003-4819-149-4-200808190-00010. [DOI] [PubMed] [Google Scholar]
- 2.Gospodarowicz M, Benedet L, Hutter RV, Fleming I, Henson DE, Sobin LH. History and international developments in cancer staging. Cancer Prev Control. 1998 Dec;2(6):262–8. [PubMed] [Google Scholar]
- 3.Cho CS, Gonen M, Shia J, Kattan MW, Klimstra DS, Jarnagin WR, et al. A novel prognostic nomogram is more accurate than conventional staging systems for predicting survival after resection of hepatocellular carcinoma. J Am Coll Surg. 2008 Feb;206(2):281–91. doi: 10.1016/j.jamcollsurg.2007.07.031. [DOI] [PubMed] [Google Scholar]
- 4.Kattan MW. Nomograms are superior to staging and risk grouping systems for identifying high-risk patients: preoperative application in prostate cancer. Curr Opin Urol. 2003 Mar;13(2):111–6. doi: 10.1097/00042307-200303000-00005. [DOI] [PubMed] [Google Scholar]
- 5.Wong SL, Kattan MW, McMasters KM, Coit DG. A nomogram that predicts the presence of sentinel node metastasis in melanoma with better discrimination than the American Joint Committee on Cancer staging system. Ann Surg Oncol. 2005 Apr;12(4):282–8. doi: 10.1245/ASO.2005.05.016. [DOI] [PubMed] [Google Scholar]
- 6.Weiser MR, Gonen M, Chou JF, Kattan MW, Schrag D. Predicting survival after curative colectomy for cancer: individualizing colon cancer staging. J Clin Oncol. 2011 Dec 20;29(36):4796–802. doi: 10.1200/JCO.2011.36.5080. [DOI] [PMC free article] [PubMed] [Google Scholar]
- 7.Ross PL, Gerigk C, Gonen M, Yossepowitch O, Cagiannos I, Sogani PC, et al. Comparisons of nomograms and urologists' predictions in prostate cancer. Semin Urol Oncol. 2002 May;20(2):82–8. doi: 10.1053/suro.2002.32490. [DOI] [PubMed] [Google Scholar]
- 8.Specht MC, Kattan MW, Gonen M, Fey J, Van Zee KJ. Predicting nonsentinel node status after positive sentinel lymph biopsy for breast cancer: clinicians versus nomogram. Ann Surg Oncol. 2005 Aug;12(8):654–9. doi: 10.1245/ASO.2005.06.037. [DOI] [PubMed] [Google Scholar]
- 9.Kattan MW, Yu C, Stephenson AJ, Sartor O, Tombal B. Clinicians versus nomogram: predicting future technetium-99m bone scan positivity in patients with rising prostate-specific antigen after radical prostatectomy for prostate cancer. Urology. 2013 May;81(5):956–61. doi: 10.1016/j.urology.2012.12.010. [DOI] [PubMed] [Google Scholar]
- 10.Pleijhuis RG, Kwast AB, Jansen L, de Vries J, Lanting R, Bart J, et al. A validated web-based nomogram for predicting positive surgical margins following breast-conserving surgery as a preoperative tool for clinical decision-making. Breast. 2013 Oct;22(5):773–9. doi: 10.1016/j.breast.2013.01.010. [DOI] [PubMed] [Google Scholar]
- 11.Hayashi Y, Xiao L, Suzuki A, Blum MA, Sabloff B, Taketa T, et al. A nomogram associated with high probability of malignant nodes in the surgical specimen after trimodality therapy of patients with oesophageal cancer. Eur J Cancer. 2012 Dec;48(18):3396–404. doi: 10.1016/j.ejca.2012.06.020. [DOI] [PMC free article] [PubMed] [Google Scholar]
- 12.Kim DY, Shim SH, Kim SO, Lee SW, Park JY, Suh DS, et al. Preoperative nomogram for the identification of lymph node metastasis in early cervical cancer. Br J Cancer. 2014 Jan 7;110(1):34–41. doi: 10.1038/bjc.2013.718. [DOI] [PMC free article] [PubMed] [Google Scholar]
- 13.Thompson AM, Turner RM, Hayen A, Aniss A, Jalaty S, Learoyd DL, et al. A preoperative nomogram for the prediction of ipsilateral central compartment lymph node metastases in papillary thyroid cancer. Thyroid. 2014 Apr;24(4):675–82. doi: 10.1089/thy.2013.0224. [DOI] [PMC free article] [PubMed] [Google Scholar]
- 14.Gold JS, Gonen M, Gutiérrez A, Broto JM, García-del-Muro X, Smyrk TC, et al. Development and validation of a prognostic nomogram for recurrence-free survival after complete surgical resection of localised primary gastrointestinal stromal tumour: a retrospective analysis. The lancet oncology. 2009 Nov;10(11):1045–52. doi: 10.1016/S1470-2045(09)70242-6. [DOI] [PMC free article] [PubMed] [Google Scholar]
- 15.Weiser MR, Landmann RG, Kattan MW, Gönen M, Shia J, Chou J, et al. Individualized Prediction of Colon Cancer Recurrence Using a Nomogram. Journal of Clinical Oncology. 2008 Feb 20;26(3):380–5. doi: 10.1200/JCO.2007.14.1291. [DOI] [PubMed] [Google Scholar]
- 16.Zhang JX, Song W, Chen ZH, Wei JH, Liao YJ, Lei J, et al. Prognostic and predictive value of a microRNA signature in stage II colon cancer: a microRNA expression analysis. The lancet oncology. 2013 Dec;14(13):1295–306. doi: 10.1016/S1470-2045(13)70491-1. [DOI] [PubMed] [Google Scholar]
- 17.Kattan MW, Leung DHY, Brennan MF. Postoperative nomogram for 12-year sarcoma-specific death. Journal of clinical oncology : official journal of the American Society of Clinical Oncology. 2002 Mar 01;20(3):791–6. doi: 10.1200/JCO.2002.20.3.791. [DOI] [PubMed] [Google Scholar]
- 18.Kattan MW, Karpeh MS, Mazumdar M, Brennan MF. Postoperative nomogram for disease-specific survival after an R0 resection for gastric carcinoma. J Clin Oncol. 2003 Oct 1;21(19):3647–50. doi: 10.1200/JCO.2003.01.240. [DOI] [PubMed] [Google Scholar]
- 19.Kattan MW, Gonen M, Jarnagin WR, DeMatteo R, D'Angelica M, Weiser M, et al. A Nomogram for Predicting Disease-specific Survival After Hepatic Resection for Metastatic Colorectal Cancer. Annals of Surgery. 2008 Mar;247(2):282–7. doi: 10.1097/SLA.0b013e31815ed67b. [DOI] [PubMed] [Google Scholar]
- 20.Zivanovic O, Jacks LM, Iasonos A, Leitao MM, Jr, Soslow RA, Veras E, et al. A nomogram to predict postresection 5-year overall survival for patients with uterine leiomyosarcoma. Cancer. 2012 Feb 1;118(3):660–9. doi: 10.1002/cncr.26333. [DOI] [PMC free article] [PubMed] [Google Scholar]
- 21.Yang L, Takimoto T, Fujimoto J. Prognostic model for predicting overall survival in children and adolescents with rhabdomyosarcoma. BMC Cancer. 2014;14:654. doi: 10.1186/1471-2407-14-654. [DOI] [PMC free article] [PubMed] [Google Scholar]
- 22.Gorlia T, van den Bent MJ, Hegi ME, Mirimanoff RO, Weller M, Cairncross JG, et al. Nomograms for predicting survival of patients with newly diagnosed glioblastoma: prognostic factor analysis of EORTC and NCIC trial 26981-22981/CE.3. Lancet Oncol. 2008 Jan;9(1):29–38. doi: 10.1016/S1470-2045(07)70384-4. [DOI] [PubMed] [Google Scholar]
- 23.Wang SJ, Fuller CD, Kim JS, Sittig DF, Thomas CR, Jr, Ravdin PM. Prediction model for estimating the survival benefit of adjuvant radiotherapy for gallbladder cancer. J Clin Oncol. 2008 May 1;26(13):2112–7. doi: 10.1200/JCO.2007.14.7934. [DOI] [PubMed] [Google Scholar]
- 24.Wang SJ, Lemieux A, Kalpathy-Cramer J, Ord CB, Walker GV, Fuller CD, et al. Nomogram for predicting the benefit of adjuvant chemoradiotherapy for resected gallbladder cancer. J Clin Oncol. 2011 Dec 10;29(35):4627–32. doi: 10.1200/JCO.2010.33.8020. [DOI] [PMC free article] [PubMed] [Google Scholar]
- 25.Wang SJ, Patel SG, Shah JP, Goldstein DP, Irish JC, Carvalho AL, et al. An oral cavity carcinoma nomogram to predict benefit of adjuvant radiotherapy. JAMA Otolaryngol Head Neck Surg. 2013 Jun;139(6):554–9. doi: 10.1001/jamaoto.2013.3001. [DOI] [PubMed] [Google Scholar]
- 26.Abdollah F, Sun M, Suardi N, Gallina A, Bianchi M, Tutolo M, et al. Prediction of functional outcomes after nerve-sparing radical prostatectomy: results of conditional survival analyses. Eur Urol. 2012 Jul;62(1):42–52. doi: 10.1016/j.eururo.2012.02.057. [DOI] [PubMed] [Google Scholar]
- 27.Chipman JJ, Sanda MG, Dunn RL, Wei JT, Litwin MS, Crociani CM, et al. Measuring and predicting prostate cancer related quality of life changes using EPIC for clinical practice. J Urol. 2014 Mar;191(3):638–45. doi: 10.1016/j.juro.2013.09.040. [DOI] [PMC free article] [PubMed] [Google Scholar]
- 28.Nelson R, Edwards S, Tse B. Prophylactic nasogastric decompression after abdominal surgery. Cochrane Database Syst Rev. 2007;(3):CD004929. doi: 10.1002/14651858.CD004929.pub3. [DOI] [PMC free article] [PubMed] [Google Scholar]
- 29.Ellett ML, Beckstrand J, Flueckiger J, Perkins SM, Johnson CS. Predicting the insertion distance for placing gastric tubes. Clin Nurs Res. 2005 Feb;14(1):11–27. doi: 10.1177/1054773804270919. discussion 8-31. [DOI] [PubMed] [Google Scholar]
- 30.Harrell FJ. Regression Modeling Strategies With Applications to Linear Models, Logistic Regression, and Survival Analysis. New York, NY: Springer Verlag; 2001. [Google Scholar]
- 31.Iasonos A, Schrag D, Raj GV, Panageas KS. How to build and interpret a nomogram for cancer prognosis. J Clin Oncol. 2008 Mar 10;26(8):1364–70. doi: 10.1200/JCO.2007.12.9791. [DOI] [PubMed] [Google Scholar]
- 32.Vickers AJ, Elkin EB. Decision curve analysis: a novel method for evaluating prediction models. Med Decis Making. 2006 Nov-Dec;26(6):565–74. doi: 10.1177/0272989X06295361. [DOI] [PMC free article] [PubMed] [Google Scholar]
- 33.2013 Apr; Available from: http://seer.cancer.gov/statfacts/html/colorect.html.
- 34.Stephan C, Siemssen K, Cammann H, Friedersdorff F, Deger S, Schrader M, et al. Between-method differences in prostate-specific antigen assays affect prostate cancer risk prediction by nomograms. Clin Chem. 2011 Jul;57(7):995–1004. doi: 10.1373/clinchem.2010.151472. [DOI] [PubMed] [Google Scholar]
- 35.Neuville A, Chibon F, Coindre JM. Grading of soft tissue sarcomas: from histological to molecular assessment. Pathology. 2014 Feb;46(2):113–20. doi: 10.1097/PAT.0000000000000048. [DOI] [PubMed] [Google Scholar]
- 36.Ray-Coquard I, Montesco MC, Coindre JM, Dei Tos AP, Lurkin A, Ranchere-Vince D, et al. Sarcoma: concordance between initial diagnosis and centralized expert review in a population-based study within three European regions. Ann Oncol. 2012 Sep;23(9):2442–9. doi: 10.1093/annonc/mdr610. [DOI] [PMC free article] [PubMed] [Google Scholar]
- 37.Van Zee KJ, Manasseh DM, Bevilacqua JL, Boolbol SK, Fey JV, Tan LK, et al. A nomogram for predicting the likelihood of additional nodal metastases in breast cancer patients with a positive sentinel node biopsy. Ann Surg Oncol. 2003 Dec;10(10):1140–51. doi: 10.1245/aso.2003.03.015. [DOI] [PubMed] [Google Scholar]
- 38.Gur AS, Unal B, Johnson R, Ahrendt G, Bonaventura M, Gordon P, et al. Predictive probability of four different breast cancer nomograms for nonsentinel axillary lymph node metastasis in positive sentinel node biopsy. J Am Coll Surg. 2009 Feb;208(2):229–35. doi: 10.1016/j.jamcollsurg.2008.10.029. [DOI] [PubMed] [Google Scholar]
- 39.Gonen Ma, H G. Concordance probability and discriminatory power in proportional hazards regression. Biometrika. 2005;92(4):965–70. [Google Scholar]
- 40.Nam RK, Kattan MW, Chin JL, Trachtenberg J, Singal R, Rendon R, et al. Prospective multi-institutional study evaluating the performance of prostate cancer risk calculators. J Clin Oncol. 2011 Aug 1;29(22):2959–64. doi: 10.1200/JCO.2010.32.6371. [DOI] [PubMed] [Google Scholar]
- 41.Giuliano AE, Hunt KK, Ballman KV, Beitsch PD, Whitworth PW, Blumencranz PW, et al. Axillary dissection vs no axillary dissection in women with invasive breast cancer and sentinel node metastasis: a randomized clinical trial. JAMA. 2011 Feb 9;305(6):569–75. doi: 10.1001/jama.2011.90. [DOI] [PMC free article] [PubMed] [Google Scholar]
- 42.Frankel TL, Fischer M, Grant F, Krone J, D'Angelica MI, DeMatteo RP, et al. Selecting patients for acute normovolemic hemodilution during hepatic resection: a prospective randomized evaluation of nomogram-based allocation. J Am Coll Surg. 2013 Aug;217(2):210–20. doi: 10.1016/j.jamcollsurg.2013.03.019. [DOI] [PubMed] [Google Scholar]
- 43.International Bladder Cancer Nomogram Consortium. Bochner BH, Kattan MW, Vora KC. Postoperative nomogram predicting risk of recurrence after radical cystectomy for bladder cancer. J Clin Oncol. 2006 Aug;24(24):3967–3972. doi: 10.1200/JCO.2005.05.3884. [DOI] [PubMed] [Google Scholar]
- 44.Bevilacqua JL, Kattan MW, Fey JV, Cody HS, 3rd, Borgen PI, Van Zee KJ. Doctor, what are my chances of having a positive sentinel node? A validated nomogram for risk estimation. J Clin Oncol. 2007 Aug;25(24):3670–3679. doi: 10.1200/JCO.2006.08.8013. [DOI] [PubMed] [Google Scholar]
- 45.Rudloff U, Jacks LM, Goldberg JI, Wynveen CA, Brogi E, Patil S, Van Zee KJ. Nomogram for predicting the risk of local recurrence after breast-conserving surgery for ductal carcinoma in situ. J Clin Oncol. 2010 Aug;28(23):3762–3769. doi: 10.1200/JCO.2009.26.8847. [DOI] [PubMed] [Google Scholar]
- 46.Hyman DM, Eaton AA, Gounder MM, Smith GL, Pamer EG, Hensley ML, et al. Nomogram to predict cycle-one serious drug-related toxicity in phase I oncology trials. J Clin Oncol. 2014 Feb;32(6):519–526. doi: 10.1200/JCO.2013.49.8808. [DOI] [PMC free article] [PubMed] [Google Scholar]
- 47.Abu-Rustum NR, Zhou Q, Gomez JD, Alektiar KM, Hensley ML, Soslow RA, et al. A nomogram for predicting overall survival of women with endometrial cancer following primary therapy: toward improving individualized cancer care. Gynecol Oncol. 2010 Mar;116(3):399–403. doi: 10.1016/j.ygyno.2009.11.027. [DOI] [PMC free article] [PubMed] [Google Scholar]
- 48.Barlin JN, Yu C, Hill EK, Zivanovic O, Koley V, Levine DA, et al. Nomogram for predicting 5-year disease-specific mortality after primary surgery for epithelial ovarian cancer. Gynecol Oncol. 2012 Apr;125(1):25–30. doi: 10.1016/j.ygyno.2011.12.423. [DOI] [PubMed] [Google Scholar]
- 49.Kattan MW, Potters L, Blasko JC, Beyer DC, Fearn P, Cavanagh W, et al. Pretreatment nomogram for predicting freedom from recurrence after permanent prostate brachytherapy in prostate cancer. Urology. 2001 Sep;58(3):393–399. doi: 10.1016/s0090-4295(01)01233-x. [DOI] [PubMed] [Google Scholar]
- 50.Smaletz O, Scher HI, Small EJ, Verbel DA, McMillan A, Regan K, et al. Nomogram for overall survival of patients with progressive metastatic prostate cancer after castration. J Clin Oncol. 2002 Oct;20(19):3972–3982. doi: 10.1200/JCO.2002.11.021. [DOI] [PubMed] [Google Scholar]
- 51.Kattan MW, Eastham JA, Wheeler TM, Maru N, Scardino PT, Erbersdobler A, et al. Counseling men with prostate cancer: a nomogram for predicting the presence of small, moderately differentiated, confined tumors. J Urol. 2003 Nov;170(5):1792–1797. doi: 10.1097/01.ju.0000091806.70171.41. [DOI] [PubMed] [Google Scholar]
- 52.Cagiannos I, Karakiewicz P, Eastham JA, Ohori M, Rabbani F, Gerigk C, et al. A preoperative nomogram identifying decreased risk of positive pelvic lymph nodes in patients with prostate cancer. J Urol. 2003 Nov;170(5):1798–1803. doi: 10.1097/01.ju.0000091805.98960.13. [DOI] [PubMed] [Google Scholar]
- 53.Koh H, Kattan MW, Scardino PT, Suyama K, Maru N, Slawin K, et al. A nomogram to predict seminal vesicle invasion by the extent and location of cancer in systematic biopsy results. J Urol. 2003 Oct;170(4 Pt 1):1203–1208. doi: 10.1097/01.ju.0000085074.62960.7b. [DOI] [PubMed] [Google Scholar]
- 54.Ohori M, Kattan MW, Koh H, Maru N, Slawin KM, Shariat S, et al. Predicting the presence and side of extracapsular extension: a nomogram for staging prostate cancer. J Urol. 2004 May;171(5):1844–1849. doi: 10.1097/01.ju.0000121693.05077.3d. discussion 1849. [DOI] [PubMed] [Google Scholar]
- 55.Stephenson AJ, Scardino PT, Eastham JA, Bianco FJ, Jr, Dotan ZA, DiBlasio CJ, et al. Postoperative nomogram predicting the 10-year probability of prostate cancer recurrence after radical prostatectomy. J Clin Oncol. 2005 Oct;23(28):7005–7012. doi: 10.1200/JCO.2005.01.867. [DOI] [PMC free article] [PubMed] [Google Scholar]
- 56.Stephenson AJ, Scardino PT, Eastham JA, Bianco FJ, Jr, Dotan ZA, Fearn PA, et al. Preoperative nomogram predicting the 10-year probability of prostate cancer recurrence after radical prostatectomy. J Natl Cancer Inst. 2006 May;98(10):715–717. doi: 10.1093/jnci/djj190. [DOI] [PMC free article] [PubMed] [Google Scholar]
- 57.Stephenson AJ, Scardino PT, Kattan MW, Pisansky TM, Slawin KM, Klein EA, et al. Predicting the outcome of salvage radiation therapy for recurrent prostate cancer after radical prostatectomy. J Clin Oncol. 2007 May;25(15):2035–2041. doi: 10.1200/JCO.2006.08.9607. [DOI] [PMC free article] [PubMed] [Google Scholar]
- 58.Stephenson AJ, Kattan MW, Eastham JA, Bianco FJ, Jr, Yossepowitch O, Vickers AJ, et al. Prostate cancer-specific mortality after radical prostatectomy for patients treated in the prostate-specific antigen era. J Clin Oncol. 2009 Sep;27(26):4300–4305. doi: 10.1200/JCO.2008.18.2501. [DOI] [PMC free article] [PubMed] [Google Scholar]
- 59.Kattan MW, Reuter V, Motzer RJ, Katz J, Russo P. A postoperative prognostic nomogram for renal cell carcinoma. J Urol. 2001 Jul;166(1):63–67. [PubMed] [Google Scholar]
- 60.Dalal KM, Kattan MW, Antonescu CR, Brennan MF, Singer S. Subtype specific prognostic nomogram for patients with primary liposarcoma of the retroperitoneum, extremity, or trunk. Ann Surg. 2006 Sep;244(3):381–391. doi: 10.1097/01.sla.0000234795.98607.00. [DOI] [PMC free article] [PubMed] [Google Scholar]
- 61.Canter RJ, Qin LX, Maki RG, Brennan MF, Ladanyi M, Singer S. A synovial sarcoma-specific preoperative nomogram supports a survival benefit to ifosfamide-based chemotherapy and improves risk stratification for patients. Clin Cancer Res. 2008 Dec;14(24):8191–8197. doi: 10.1158/1078-0432.CCR-08-0843. [DOI] [PMC free article] [PubMed] [Google Scholar]
- 62.Cahlon O, Brennan MF, Jia X, Qin LX, Singer S, Alektiar KM. A postoperative nomogram for local recurrence risk in extremity soft tissue sarcomas after limb-sparing surgery without adjuvant radiation. Ann Surg. 2012 Feb;255(2):343–347. doi: 10.1097/SLA.0b013e3182367aa7. [DOI] [PMC free article] [PubMed] [Google Scholar]
- 63.Ali S, Yu C, Palmer FL, et al. Nomogram to aid selection of patients for short-stay thyroidectomy based on risk of postoperative hypocalcemia. Arch Otolaryngol Head Neck Surg. 2011 Nov;137(11):1154–1160. doi: 10.1001/archoto.2011.189. [DOI] [PubMed] [Google Scholar]