Abstract
Cytotoxic chemotherapy is effective in debulking tumour masses initially; however, in some patients tumours become progressively unresponsive after multiple treatment cycles. Previous studies have demonstrated that cancer stem cells (CSCs) are selectively enriched after chemotherapy through enhanced survival1–3. Here we reveal a new mechanism by which bladder CSCs actively contribute to therapeutic resistance via an unexpected proliferative response to re-populate residual tumours between chemotherapy cycles, using human bladder cancer xenografts. Further analyses demonstrate the recruitment of a quiescent label-retaining pool of CSCs into cell division in response to chemotherapy-induced damages, similar to mobilization of normal stem cells during wound repair4–7. While chemotherapy effectively induces apoptosis, associated prostaglandin E2 (PGE2) release paradoxically promotes neighbouring CSC repopulation. This repopulation can be abrogated by a PGE2-neutralizing antibody and celecoxib drug-mediated blockade of PGE2 signalling. In vivo administration of the cyclooxygenase-2 (COX2) inhibitor celecoxib effectively abolishes a PGE2- and COX2-mediated wound response gene signature, and attenuates progressive manifestation of chemoresistance in xenograft tumours, including primary xenografts derived from a patient who was resistant to chemotherapy. Collectively, these findings uncover a new underlying mechanism that models the progressive development of clinical chemoresistance, and implicate an adjunctive therapy to enhance chemotherapeutic response of bladder urothelial carcinomas by abrogating early tumour repopulation.
Cytotoxic chemotherapy remains the standard of care for many advanced carcinomas. Although chemotherapy is effective in debulking tumour mass, certain patients show initial response but progressively become unresponsive after multiple treatments. Chemotherapy is administered in cycles to induce fractionated killing of unsynchronized proliferating cancer cells, and treatments are spaced out to allow recovery of normal tissues between cycles8. However, repopulation of residual surviving cancer cells also occurs, which is an undesirable phenomenon that limits chemotherapeutic response in subsequent cycles8. Recent studies demonstrated that CSCs have a survival advantage in response to chemotherapy1–3. Here we investigate the unexplored concept that CSCs may actively proliferate in response to chemotherapy-induced damages, similar to how tissue resident stem cells mobilize to wound sites during tissue repair4–7,9.
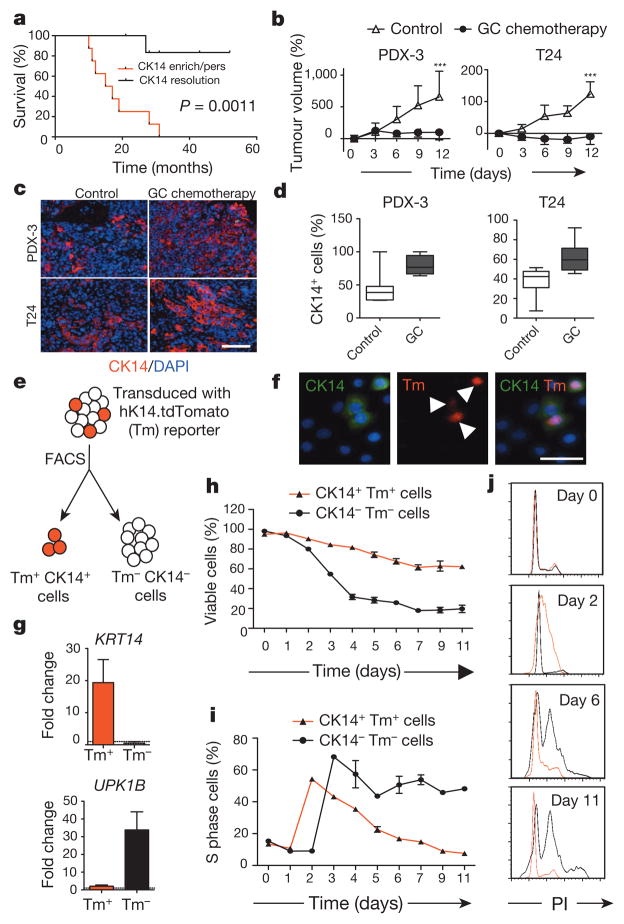
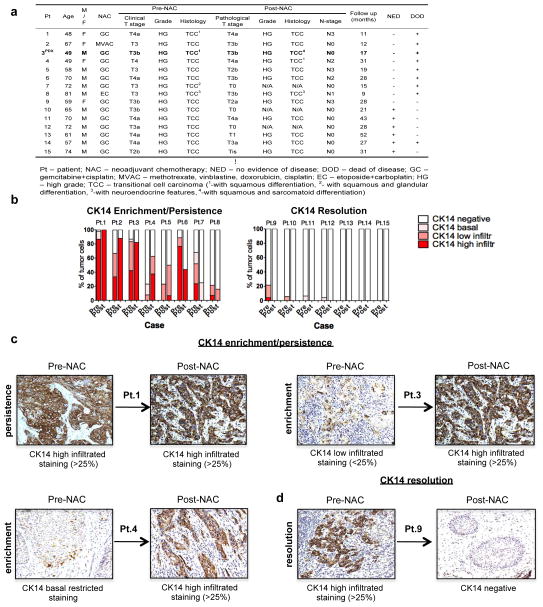
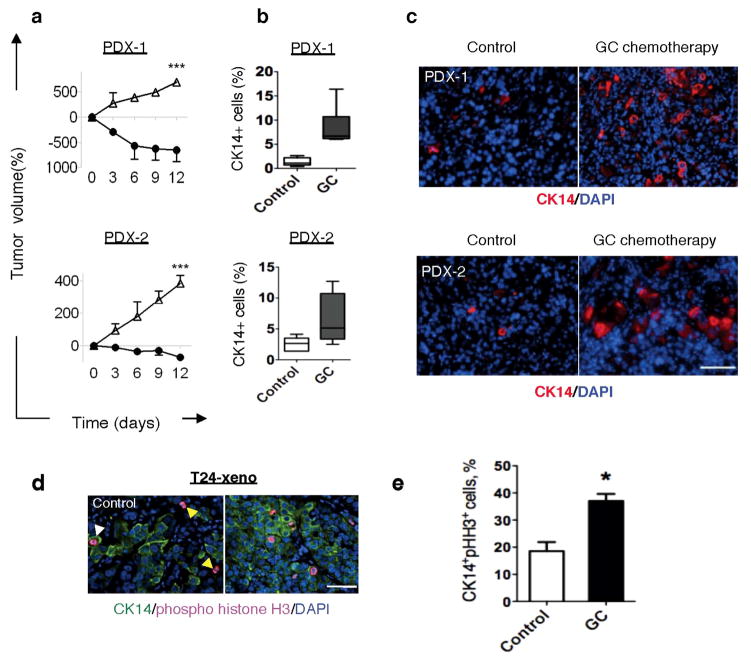
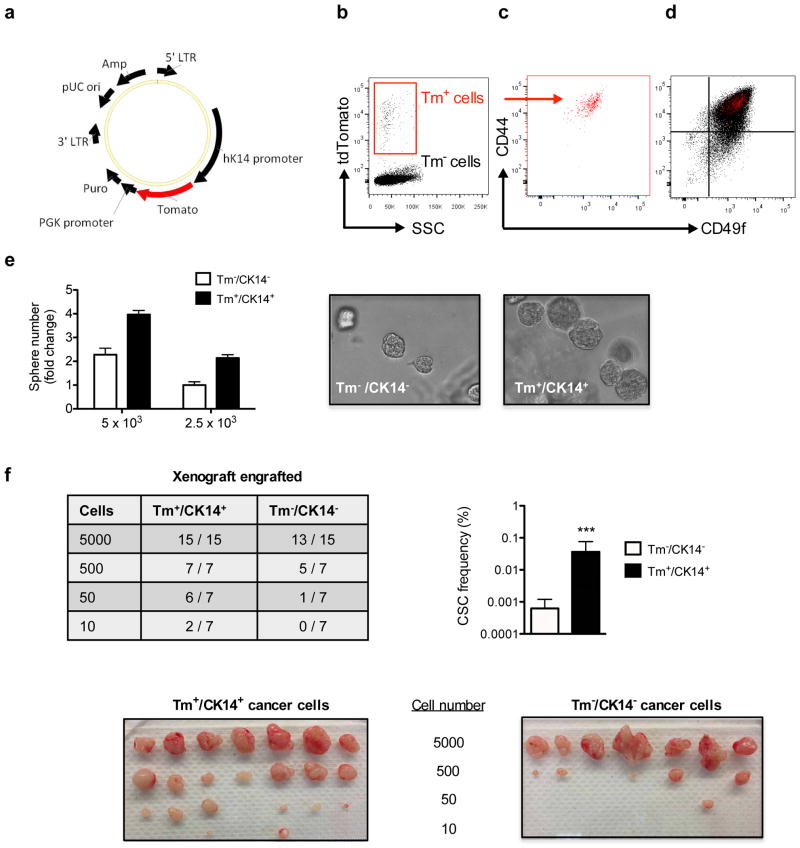
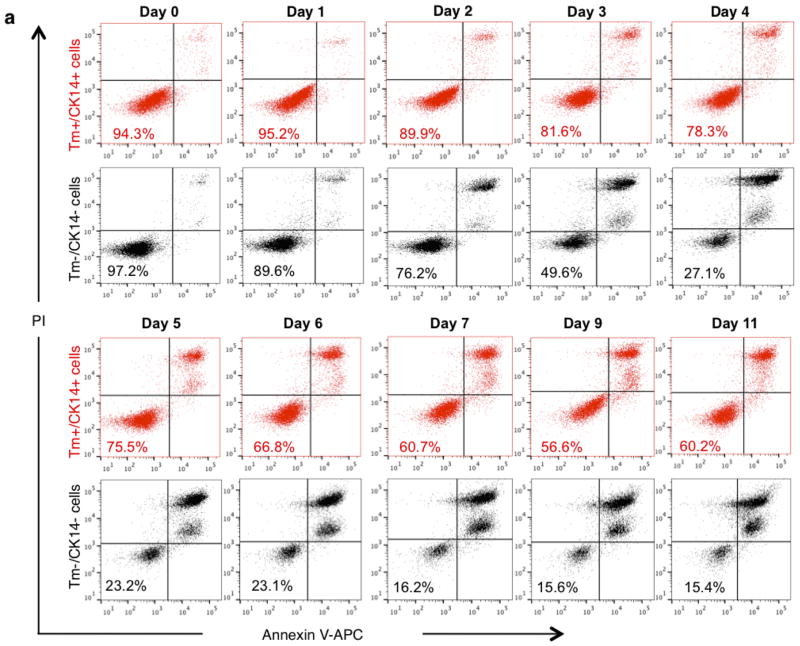
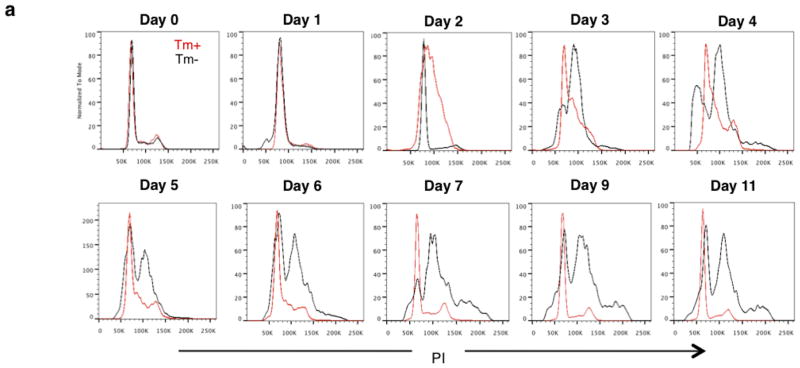
Bladder urothelial carcinomas contain cells that span various cellular differentiation stages10–15, cytokeratin 14 (CK14) marks the most primitive (or least differentiated) cells11,13 and patients with abundant CK14 staining correlate with poor survival11,13. Here, comparative analysis of matching pre- and post-chemotherapy patient tissues revealed one group with CK14 staining enrichment/persistence (Fig. 1a and Extended Data Fig. 1a–c) and another group with no CK14 staining after chemotherapy (Fig. 1a and Extended Data Fig. 1a, b, d). Kaplan–Meier analysis revealed patients with CK14+ cancer cell enrichment/persistence showed worse survival (Fig. 1a), justifying further need to investigate their chemotherapeutic response. Using the standard chemotherapy regimen for advanced bladder urothelial carcinomas (that is, gemcitabine and cisplatin (GC)), one chemotherapy cycle effectively reduced the growth rate of all xenograft tumours in comparison to controls (Fig. 1b and Extended Data Fig. 2a), while leading to a generalized enrichment of CK14+ cancer cells (1.7–4.3-fold) (Fig. 1c, d and Extended Data Fig. 2b, c). This enrichment is unexpectedly contributed by proliferation marked by mitosis phaseprotein phosphohistone H3 (Extended Data Fig. 2d, e; white arrows). In addition to the conventional thinking that chemotherapy selects for chemoresistant cancer cells, this active proliferative response may represent a new mechanism contributing to repopulation of residual tumours. To investigate this phenomenon further, we constructed a lentiviral reporter to enable prospective isolation of CK14+ cells by fluorescence activated cell sorting (FACS), as CK14 is an intracellular protein that would not allow for cell surface antibody labelling. We sub-cloned a previously validated gene promoter region of human KRT14 (ref. 16) into a promoterless lentiviral vector carrying a tdTomato (hK14. tdTomato) red fluorescent protein (Extended Data Fig. 3a). With this reporter stably transduced into urothelial carcinoma cells (Fig. 1e and Extended Data Fig. 3b–d), we could readily detect a tdTomato+ (Tm+) subpopulation that exclusively expressed CK14 at the protein (Fig. 1f; white arrows) and messenger RNA (Fig. 1g; KRT14) levels, while minimally expressing the differentiation marker uroplakin1B (Fig. 1g; UPK1B). These Tm+ CK14+ urothelial carcinoma cells represented a subpopulation of our previously reported CD44+CD49f+ CSCs11,13 (Extended Data Fig. 3b–d). Additional functional evaluation validated their unique biological properties being enriched for sphere-forming stem cells in vitro (Extended Data Fig. 3e) and tumorigenic cells when engrafted in vivo (Extended Data Fig. 3f), thus demonstrating accepted functional criteria for CSCs. To evaluate their chemotherapeutic response, we purified Tm+ CK14+ and Tm− CK14− cancer cells and evaluated their relative cell viability after GC chemotherapy (Fig. 1h and Extended Data Fig. 4). Tm+ CK14+cancer cells survived chemotherapy-induced apoptosis significantly better than Tm− CK14− cells starting at day 3 (Fig. 1h and Extended Data Fig. 4). Concurrent cell cycle analyses revealed an unexpected proliferative response of both subpopulations by entering into S phase at days 2 and 3, respectively (Fig. 1i, j and Extended Data Fig. 5). Interestingly, Tm− CK14− cancer cells remained proliferative throughout the 11-day time course, whereas Tm+ CK14+ cancer cells gradually returned to a less proliferative state (Fig. 1i, j and Extended Data Fig. 5). Because gemcitabine (a cytidine analogue) and cisplatin preferentially incorporate into proliferating cells to initiate apoptosis via inducing DNA crosslinks, strand breaks and adduct formation17, we propose that the slower cycling properties of CK14+ cells may provide one mechanism by which they evade GC chemotherapy.
Figure 1. Cytotoxic chemotherapy induces CK14+cancer cell proliferation despite reducing tumour size.
a, Kaplan–Meier analysis of bladder-cancer patients with various CK14 staining patterns (enrich/pers denotes an enrichment (increase) or persistence of CK14 staining; resolution denotes an absence) after neoadjuvant chemotherapy (n = 15). b, Relative change in xenograft tumour size after chemotherapy (n = 6 xenograft tumours per group). PDX-3, patient-derived xenograft from patient 3; T24, human bladder cancer cell line-derived xenograft. c, d, Representative immunofluorescence staining (c) and box plots quantifying the percentage of CK14+ bladder cancer cells after chemotherapy (d). DAPI, 4′,6-diamidino-2-phenylindole. e, Schematic demonstrating the transduction of hK14.tdTomato lentiviral reporter into urothelial carcinoma cells. f, Immunofluorescence staining verifying the specific expression of tdTomato (Tm)-positive signal in CK14+ cancer cells. g, Quantitative PCR (qPCR) analysis of KRT14 and UPK1B in cancer cell subpopulations in biological duplicates. h, i, Graphs summarizing viability (h) and corresponding percentage of S phase cells (i) in two cancer subpopulations after chemotherapy in biological duplicates. j, Cell cycle profiles for Tm+ CK14+ (red line) and Tm− CK14− (black line) cancer cells at indicated days after chemotherapy. PI, propidium iodide. Data in b represent mean ± s.e.m.; box plots in c show twenty-fifth to seventy-fifth percentiles, with line indicating the median, and whiskers indicating the smallest and largest values; data in g–i show mean and range. ***P <0.001 (log-rank test (a) and two-tailed Student’s t-test (b)). Scale bars, 100 μm.
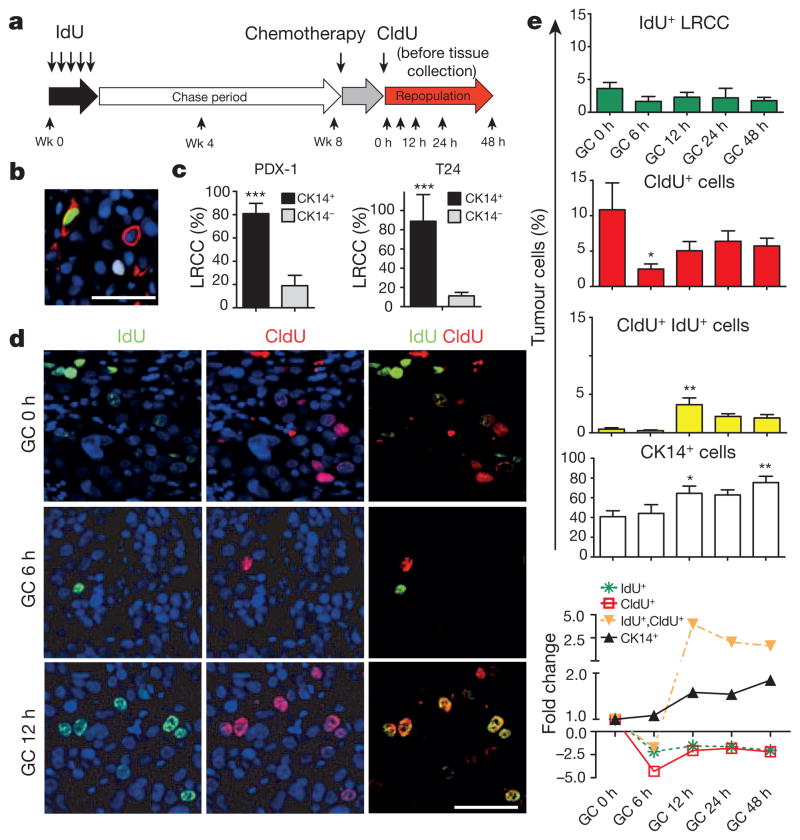
Figure 2. Chemotherapy recruits CK14+ LRCCs to proliferate and divide.
a, Experimental approach to label and localize LRCCs in bladder xenografts. Wk, week. b, Immunofluorescence staining to locate CK14+ cancer cells (red) that co-localize with LRCCs (green IdU+ cells) or proliferating cells (white CldU+ cells) at 8 weeks after IdU chase. c, Quantification of LRCCs within cancer subpopulations (n = 4 xenografted tumours). d, Immunofluorescence staining to evaluate the percentage and localization of LRCCs (green, IdU+), proliferating cells (red, CldU+) and dividing LRCCs (yellow, IdU+ CldU+) at various time after chemotherapy. e, Time kinetics revealing the percentage of LRCCs (green, IdU+), proliferating cells (red, CldU+), dividing LRCCs (yellow, IdU+ CldU+), and CK14+ cancer cells (white) at various time after chemotherapy (n = 4 xenografted tumours). All data represent mean ± s.e.m. *P <0.05, **P <0.01 (one-way analysis of variance (ANOVA) followed by Dunnett’s test for multiple comparisons). Scale bars, 50 μm.
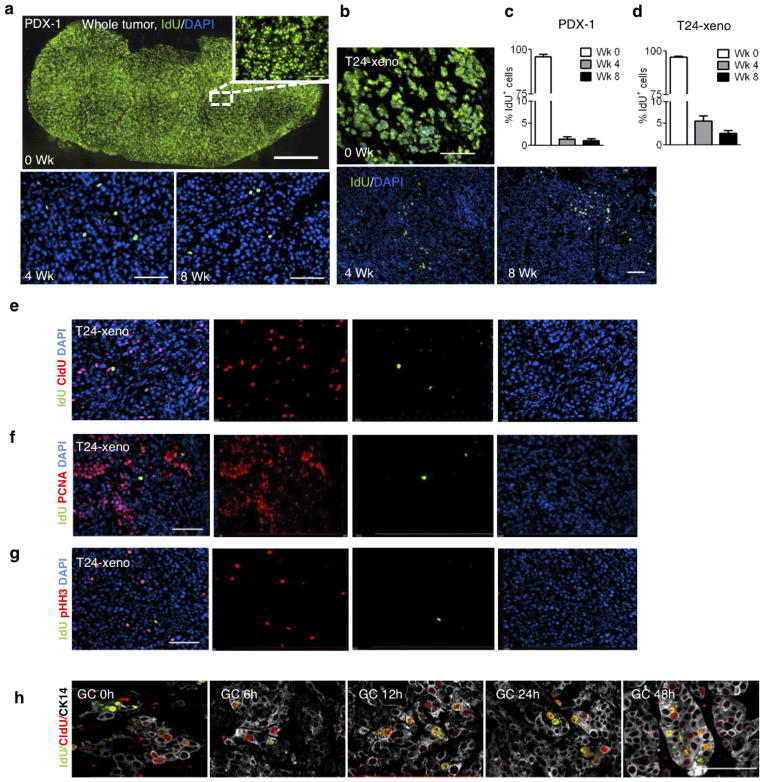
To explore this hypothesis in vivo, we used the classical pulse-chase labelling approach to mark quiescent cells18,19, followed by chemotherapy treatment to analyse their proliferative response (Fig. 2a). We repetitively pulsed xenograft tumours with the thymidine analogue 5-iodo-2′-deoxyuridine (IdU), followed by a 4–8-week chase period, during which dividing cells diluted out IdU whereas quiescent cells retained IdU18 (Fig. 2a). Effective IdU pulsing was validated (Extended Data Fig. 6a) and a quiescent cancer subpopulation (1.08–5.48%) was consistently found (Extended Data Fig. 6a–d), which we term label-retaining cancer cells (LRCCs) (green cells in Fig. 2b, Extended Data Fig. 6a, b). These IdU+ LRCCs predominately localized within CK14+ cells (Fig. 2b, c; red) and were mutually exclusive to proliferating cells labelled by 5-chloro-2′-deoxyuridine (CldU) (Fig. 2b; white) or other proliferation markers (Extended Data Fig. 6e–g). Notably, chemotherapy significantly reduced the fraction of CldU+ proliferating cells while not altering IdU+ LRCCs initially (Fig. 2d, e; 6 h). These results confirmed our in vitro findings that gemcitabine and cisplatin preferentially induce apoptosis of dividing cells17 (Fig. 1h, i). This is paradoxically followed by a significant increase in IdU+ LRCCs that were simultaneously incorporated with CldU (Fig. 2d, e; 12 h). These IdU+ CldU+ cells constantly appeared as a two-cell state immediate adjacent to each other (Fig. 2d; yellow cells), suggestive of LRCC recruitment to divide after chemotherapy-induced apoptotic damage. This trend coincided with an increase in CldU+ proliferating and CK14+ cancer cells (Fig. 2e and Extended Data Fig. 6h;12 h), which gradually decreased from 24 h and onwards, corresponding with a plateau of single CldU+ proliferating cancer cells (Fig. 2e). Collectively, these results illustrate that quiescent LRCCs are unexpectedly recruited into cell division after chemotherapy treatment, contributing to repopulation of residual tumours.
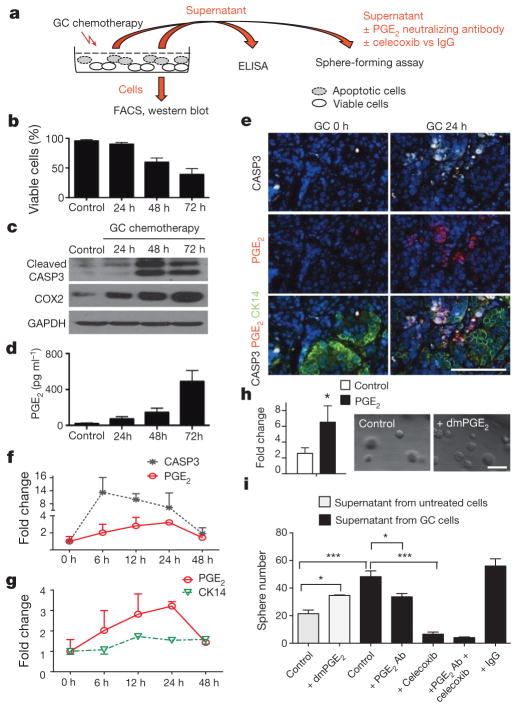
Next, we explored the molecular mechanisms underlying tumour repopulation. After chemotherapy, it is known that soluble factors are released from apoptotic cells to attract immune cells for clearance20. Paradoxically, some of these factors are also known to stimulate epithelial cell proliferation during wound repair. One example is PGE2, which was demonstrated to promote stem-cell expansion21 and mobilization22. Here, we investigate PGE2 and CSCs in the context of chemotherapy, which was not studied previously. Urothelial carcinoma cells were exposed to chemotherapy in vitro (Fig. 3a) and their viability was quantified by flow cytometry analyses of mitochondrial and plasma membrane permeability (Fig. 3b) and by cleaved caspase-3 (CASP3) (Fig. 3c). The time kinetics of chemotherapy-induced apoptosis (Fig. 3b, c) is closely associated with an increase in the expression of COX2 (the enzyme mediating PGE2 production) and PGE2 release (Fig. 3d). We further validated these findings in vivo, by analysing the co-localization of PGE2, CASP3 and CK14+ cancer cells, and their associated changes after chemotherapy (Fig. 3e, f). Similar to in vitro, chemotherapy induced apoptosis as measured by a CASP3-positive stain, which peaked at 6 h and gradually reduced thereafter (Fig. 3e, f), which was closely followed by PGE2 release from 6 to 24 h after chemotherapy (Fig. 3f). Furthermore, PGE2 localization (Fig. 3e; red) was often found adjacent to CK14+ cancer cells (Fig. 3e; green). Altogether, these findings demonstrated that chemotherapy-induced apoptosis is closely followed by the release of PGE2, which preceded that of tumour repopulation (Fig. 3g).
Figure 3. PGE2 release from neighbouring apoptotic cells induces CSC repopulation.
a, Experimental approach to evaluate the role of PGE2 release in modulating sphere-forming CSCs. b, FACS quantification of the percentage of viable cells at various time after chemotherapy (n = 3 experiments). c, Western blot analysing the correlative protein level of cleaved caspase-3 (CASP3) and COX2 at various time after chemotherapy (representative blot from n = 3). GAPDH was a loading control. d, Temporal release of PGE2 by chemotherapy-treated cancer cells, measured by ELISA (n = 3 experiments). e, Immunofluorescence staining demonstrating relative localization of CASP3-positive apoptotic cells (white), PGE2-positive signals (red) and CK14-positive cancer cells (green) in chemotherapy- or vehicle-treated xenograft tumours in vivo (n = 4 xenografted tumours). f, g, Relative fold changes in CASP3-positive (black), PGE2-positive (red) and CK14-positive (green) cancer cells with time. h, Exogenous effects of dmPGE2 on sphere-forming CSCs (n = 3 experiments). i, Inhibitory effects of a PGE2-neutralizing antibody (Ab) and celecoxib in modulating sphere-forming CSCs (n = 4 biological replicates). All data represent mean ± s.e.m. *P <0.05, ***P <0.001 (Student’s t-test (h) and one-way ANOVA followed by Dunnett’s test for multiple comparisons (i)). Scale bars, 100 μm.
To establish a biological role for PGE2 in promoting tumour repopulation, we investigated how exogenous dmPGE2 (a stabilized PGE2 analogue) could modulate sphere-forming stem cells in vitro23. Exogenous dmPGE2 treatment significantly increased the frequency of sphere-forming cells (Fig. 3h). To evaluate PGE2 in the context of chemotherapy, we applied PGE2-containing supernatant obtained from chemotherapy-treated cells to urothelial carcinoma cells (Fig. 3a), and compared their sphere-forming ability to those receiving exogenous dmPGE2 (Fig. 3i). Although both conditions significantly induced sphere-forming cells, supernatant from chemotherapy-treated cells induced a higher frequency (Fig. 3i). Notably, functional blockade of PGE2 by a neutralizing antibody significantly reduced the ability of factor-containing supernatant to generate sphere-forming cells (Fig. 3i). Furthermore, the addition of the pharmacological COX2 inhibitor celecoxib, alone or in combination with a PGE2 neutralizing antibody, further reduced their frequencies (Fig. 3i).
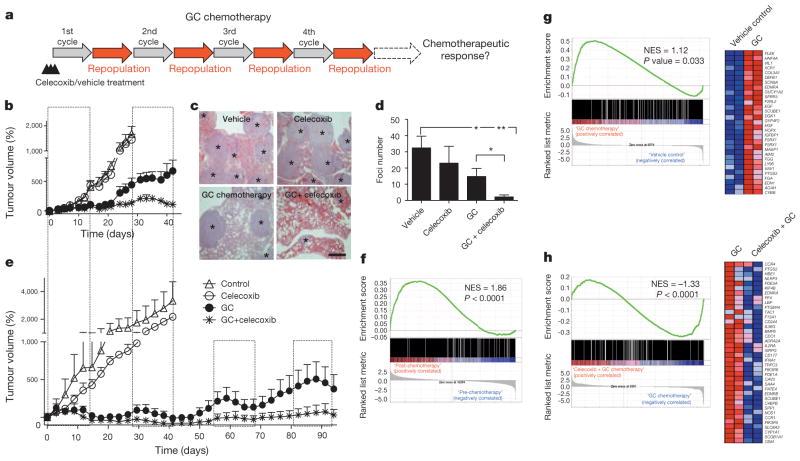
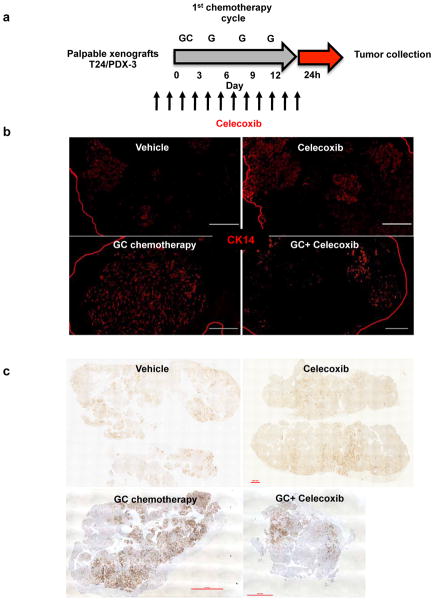
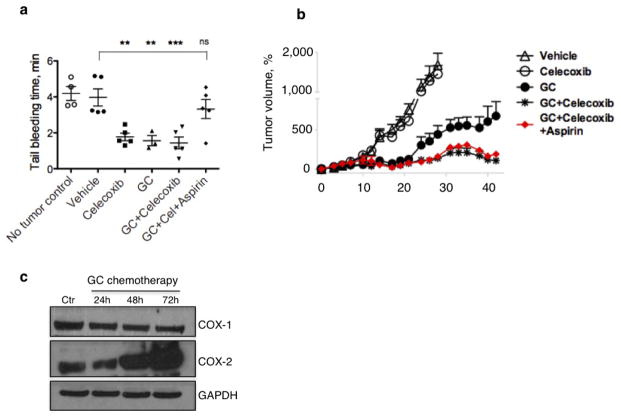
Because more than 70% of patients with advanced bladder cancer do not benefit from neoadjuvant chemotherapy24–26, and celecoxib is a US Food and Drug Administration (FDA)-approved drug, we evaluated whether the attenuation of PGE2 signalling in vivo could enhance chemotherapeutic response (Fig. 4a). Although chemotherapy is clinically administered in multiple cycles, few preclinical studies administered chemotherapy beyond one cycle or a single dose. To bridge this gap, we recapitulated the clinical regimen (Fig. 4a–e) in advanced bladder cancer xenografts, including one derived from a patient who was resistant to chemotherapy (Fig. 4e and Extended Data Fig. 1a). During the first chemotherapy cycle, both PDX-3 and T24 xenograft lines were responsive to chemotherapy (GC) and combination therapy (celecoxib plus GC) by reducing tumour size (Fig. 4b, e; days 3–12). Nevertheless, celecoxib combination treatment did abrogate notable expansion of CK14+ cancer cells induced by chemotherapy (Extended Data Fig. 7a–c). Remarkably, manifestation of chemoresistance occurred progressively after successive chemotherapy cycles (Fig. 4b, e; black circle), and celecoxib combination treatment (celecoxib plus GC) enhanced chemotherapeutic response more evidently in later treatment cycles (Fig. 4b, e; asterisk). T24 bladder cancer xenografts were limited to two chemotherapy cycles owing to distal lung metastases, and celecoxib combination treatment significantly diminished metastatic lung foci (Fig. 4c, d). Because celecoxib is known to suppress prostacyclin and predisposes patients to thrombosis27, patients with cancer prescribed celecoxib as adjuvant therapy will probably be co-administered with low-dose aspirin for cardioprotection. We confirmed the antithrombotic efficacy of low-dose aspirin without affecting the overall efficacy of celecoxib (Extended Data Fig. 8).
Figure 4. Celecoxib drug-mediated inhibition of PGE2 pathway abrogates progressive development of chemoresistance.
a, In vivo preclinical chemotherapy recapitulates clinical regimen with multiple treatment cycles and gap periods. b, Percentage change in tumour size after chemotherapy, in the presence or absence of celecoxib (n = 12 xenografted tumours (T24) per group). c, Representative haematoxylin and eosin images showing lung metastatic foci (asterisks) from various treatments. Scale bar, 500 μm. d, Quantification of lung metastatic foci across various treatments (n = 5 mice per group). e, Percentage change in tumour size of patient xenografts (PDX-3) after chemotherapy, in the presence or absence of celecoxib (n = 6 xenografted tumours per group). The four dashed boxes indicate the time frame of each GC chemotherapy cycle. f, Gene set enrichment analysis (GSEA) validated enrichment of ‘wound-response gene signature’ after chemotherapy in patients with bladder cancer classified as non-responders. NES, normalized enrichment score. g, GSEA revealing enrichment of wound-response gene signature in chemotherapy-treated bladder cancer xenografts. Heat map demonstrating genes within leading edge, including PTGS2 (encoding COX2), a core pathway component for PGE2. h, GSEA and heat map highlighting abrogation of wound-response gene signature after celecoxib combination treatment. All data represent mean ± s.e.m. Tumour volume measurements are relative to mean tumour volume at day 0. *P <0.05, **P <0.01 (one-way ANOVA followed by Dunnett’s test for multiple comparisons).
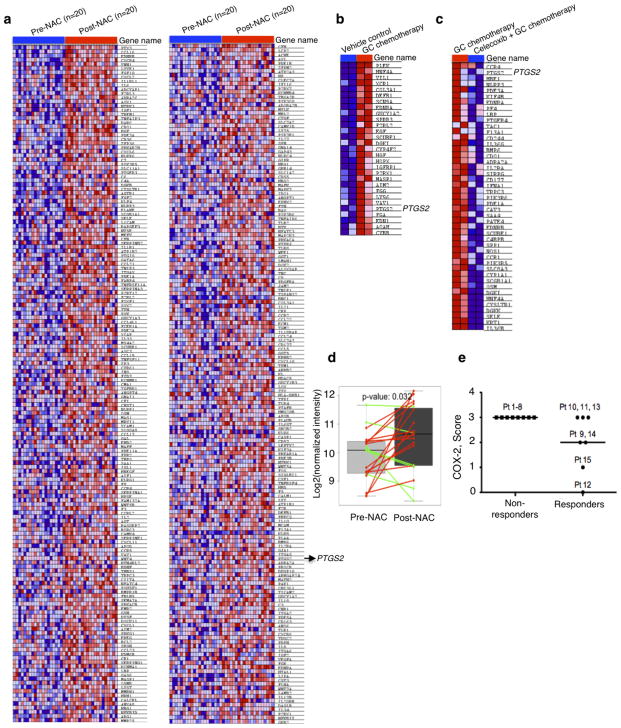
Here, our findings highlight a new mechanism by which CK14+ CSCs contribute to the progressive development of chemoresistance, via their proliferative response to fuel repopulation of residual tumours during the gap periods between chemotherapy cycles (Extended Data Fig. 10). Global gene expression profiling further revealed a parallel to tissue wound response, that chemoresistant tumours elicited enrichment of a ‘wound-response gene signature’ (Fig. 4f, g and Extended Data Fig. 9a, b), which could be abrogated by combination celecoxib treatment (Fig. 4h and Extended Data Fig. 9c). The PTGS2 gene, which encodes COX2 and is a core pathway component for PGE2 signalling, is among these wound-response genes (Fig. 4g, h). Similar findings were found in human bladder carcinomas that are resistant to chemotherapy (Fig. 4f and Extended Data Fig. 9a, d, e), thus confirming the importance and generalization of PGE2/COX2 signalling during development of chemoresistance, while other metabolites of the arachidonic acid pathway may also be involved. By validating the efficacy of celecoxib in abrogating chemoresistance in xenografts derived from a patient who was resistant to chemotherapy, this preclinical finding provides considerable implications for immediate clinical translation, as the standard of care for advanced bladder cancers is limited to cytotoxic chemotherapy and surgery with no other therapeutics28–30. This approach to abrogate chemoresistance may extend to other epithelial tumour types on further functional validation.
METHODS
Acquisition of human bladder urothelial carcinoma tissues
With approval from Institutional Review Board (H-26809) and informed consents, we obtained matching samples of formalin-fixed paraffin-embedded human bladder tumours before (collected at the time of transurethral resection of bladder tumour) and after (collected at the time of radical cystectomy) chemotherapy. Our pathologist selected representative specimens on review of haematoxylin and eosin slides.
Generation of patient-derived xenografts from human urothelial carcinomas
All mice (immunocompromised Rag2−/ − II2rg−/ − double-knockout mice; Taconic) were housed in the Animal Facility at Baylor College of Medicine. Freshly isolated patient cancer tissues (clinical information is summarized in Extended Data Fig. 1a) were obtained with patient consent under Institutional Review Board (H-25099) approval at Baylor College of Medicine. Tumour tissues were subdivided into 2–5 mm3 pieces, coated with growth-factor-reduced matrigel (BD) and media in a 1:1 ratio, and embedded within the subcutaneous space underneath the skin of mice (male or female, 6–8 weeks old). Successfully xenografted tumours were then enzymatically dissociated into single cell suspensions and directly passaged in vivo without prior culturing in vitro, as previously reported10,11. Animal work was performed in accordance to ethical regulations approved by Baylor College of Medicine Institutional Animal Care and Use Committee (IACUC; AN-5803).
In vitro treatment
Immortalized bladder cancer cell line T24 (high-grade) was purchased from ATCC and maintained in DMEM (HyClone), supplemented with 10% FBS (Gibco) and penicillin-streptomycin (Cellgro). Cells used were authenticated and tested for mycoplasma at the Tissue and Cell Culture Core Laboratory at Baylor College of Medicine. Cells were incubated with gemcitabine (7.5 ng ml−1; Sigma) 2 h before addition of cisplatin (100 μg ml−1; Sigma). Determination of cell viability after treatment was based on the analysis of mitochondrial transmembrane potential by 3,3′-dihexyloxacarbocyanine iodide (DiOC6; Molecular Probes, Invitrogen) and cell membrane permeability to propidium iodide (Sigma) by FACS (BD Fortessa) at the indicated time points (24, 48 and 72 h). CASP3 cleavage was measured at the indicated time points using standard immunoblotting with rabbit-polyclonal CASP3 antibody (Cell Signaling, 9662; 1:1,000), COX2 expression was measured with rabbit-polyclonal COX2 antibody (Cell Signaling, 4842; 1:1,000), GAPDH expression was measured with mouse-monoclonal GAPDH antibody (Santa Cruz Biotechnology, sc-137179; 1:400). Appropriate secondary antibodies (anti-rabbit/mouse IgG, horseradish peroxidase (HRP)-linked antibody, Cell Signaling; 1:2,000) were used for detection.
In vivo treatment
When xenograft tumours reached a palpable size, mice (male and female) were assigned into different experimental groups: vehicle control (12.5% dimethylsulphoxide (DMSO) in saline) group; GC chemotherapy treatment group; celecoxib treatment group; and celecoxib plus GC combinatory treatment group. According to the Institutional Animal Care and Use Committees (IUCUC) protocol (AN-5803), the maximal allowable size of the tumours could not exceed 10% of mouse body weight. For systemic administration of a single GC treatment, mice were treated with either vehicle or sequential intraperitoneal injection of gemcitabine (60 mg kg−1) and cisplatin (6 mg kg−1) given 4 h apart. For one GC cycle, cisplatin (6 mg kg−1) was only applied after the first gemcitabine (40 mg kg−1) treatment on day 2, followed by three consecutive treatments of gemcitabine on days 5, 8 and 11 (GC→G→G→G). The tumours were collected 24 h after the last treatment. In celecoxib combination treatment experiments, mice were pretreated with celecoxib (5 mg kg−1 daily; Sigma PZ0008) via intraperitoneal injection 2 days before the initiation of chemotherapy, followed by daily intraperitoneal administration of celecoxib during chemotherapy or vehicle treatment cycle.
Immunohistochemical analysis of CK14 in patient samples
Immunohistochemical staining was performed using keratin 14 polyclonal antibody (Covance, PRB-155P; 1:1,000). Every sample was scored for its CK14 staining by determining the percentage of visual fields that were CK14 negative (0%), CK14 low-infiltrating (<25%), CK14 high-infiltrating (25–100%), and CK14 basal-restricted (staining restricted to the basal layer of urothelium). The final result for each case was the average score of all visual fields. COX2 staining was performed on serial sections using COX2 monoclonal antibody (Cayman Chemical, 160112; 1:100).
Immunofluorescence analyses
Tumour sections were analysed following standard haematoxylin and eosin procedures or immunostaining protocols as previously reported10. Nikon microscopy and NIS element software were used for imaging and quantification. Primary antibodies used are listed as follows:5-bromo-2′-deoxyuridine (BrdU) (for IdU, BD 347580; 1:100), BrdU (BD 347583, 1:100), BrdU (for CldU, Abcam, ab6326, 1:100), CK14(Covance, PRB-155P, 1:1,000), CK14(Abcam, ab77684, 1:100), cleaved CASP3 (Cell Signaling, 9661; 1:400), PGE2 (Abcam, ab2318; 1:100), and phosphohistone H3 (Cell Signaling, 3377; 1:1,000).
Generation of hK14.tdTomato lentiviral reporter construct
We developed a lentiviral construct that reports on the activity of human KRT14 promoter by sub-cloning a previously characterized and validated promoter region of human KRT14 (ref. 16) (obtained from ATCC, MBA-124) using EcoRI and BamHI restriction enzymatic digestion, and inserting this promoter fragment into a promoterless lentiviral vector (Clontech, 631754) tagged with a DD-tdTomato (Tm) red fluorescent protein (Clontech Lenti-X DD-tdTomato vector). DD-Tm protein is rapidly targeted to proteasome degradation unless incubated with Shield1 (Clontech) in vitro.
Limiting dilution analysis of tumour subpopulations
For in vivo limiting dilution assay, Tm+ CK14+ and Tm− CK14− tumour cells were purified by FACS (BD FACS Aria Sorter) and serially diluted to the appropriate cell dose. Cells were injected and the number of tumours formed from each cell dose injected was scored. The frequency of cancer stem cells had been calculated using the ELDA software (http://bioinf.wehi.edu.au/software/elda/index.html) provided by the Walter and Eliza Hall Institute.
qRT–PCR
RNA isolation (RNAspin Mini, Illustra, GE Healthcare) and reverse transcription (Superscript III First-Strand Synthesis, Invitrogen) were performed according to the manufacturer’s instructions. We used Taqman Gene Expression assay mix (Applied Biosystems) and FAM-labelled Taqman probes to detect expression of the following genes: KRT14 (Applied Biosystems, Hs00265033_m1) and UPK1B (Applied Biosystems, Hs00199583_m1). Relative qPCR (ΔΔCt method) was performed in triplicate using ABIPrism7000 Sequence Detection System (Applied Biosystems). Gene expression levels were normalized to GAPDH transcript levels (Applied Biosystems, Hs99999905_m1).
Cell cycle analysis
Tm+ and Tm− cells subjected to in vitro GC chemotherapy were collected using trypsin (Gibco), washed twice with PBS and fixed with 70% ethanol for 30 min at room temperature. Cells were stained with propidium iodide (25 μg ml−1 solution in 4 mM citrate buffer supplemented with RNase, 10% Triton X-100 and PEG 6000; all from Sigma) and analysed by FACS (gating strategy excluded cell doublets from analysis).
Dual labelling of slow-cycling and active-proliferating cancer cells
Mice were labelled by intraperitoneal injection of IdU (Sigma-Aldrich; 50 mg kg−1 bodyweight), BrdU (Sigma-Aldrich; 50 mg kg−1 bodyweight) or CldU (Sigma-Aldrich). For labelling of slow-cycling cells, repetitive pulsing of IdU (50 mg kg−1 bodyweight) was given for 5 consecutive days, followed by various long chase periods (4–8 weeks) to localize LRCCs. For labelling of proliferating cells, CldU was given 1 h before tumour tissue collection to localize active cycling cancer cells.
PGE2 ELISA assay
To measure PGE2 release, bladder cancer cells T24 were cultured in DMEM supplemented with 2% FBS and treated with gemcitabine (7.5 ng ml−1; Sigma) and cisplatin (100 μg ml−1; Sigma). Supernatants were collected 24, 48 and 72 h after treatment initiation. PGE2 levels in the supernatants were measured by ELISA kit (R&D Systems).
dmPGE2 exogenous treatment
T24 cancer cells were plated in a semi-solid sphere-forming assay in the presence of 0.38 ng ml−1 dmPGE2, 100 nM of neutralizing PGE2 antibody (Cayman Chemical, 10009814), 5 μM celecoxib (Sigma) or vehicle for 12 days23. Clonal derivation of spheres from single cells was ensured and monitored as described23.
Thromboprophylaxis with aspirin
Immunocompromised mice bearing T24 xenografted tumours were treated with celecoxib and GC chemotherapy in the presence or absence of aspirin (Sigma) (37.9 μg g−1 twice a week, equivalent of 162.5 mg daily dose in human) for two cycles, and antithrombotic activity of aspirin was tested by analysing tail bleeding time. In brief, tails of anaesthetized mice (1–3% isoflurane in 100% oxygen at a flow rate of 1–2 L min−1) were transected 1 mm from the tip with a scalpel, the remaining tail was immersed in 37 °C saline, and the time until bleeding stopped for more than 1 min was observed and recorded.
RNA-sequencing
Tumour tissues were collected from the animals and snap-frozen in liquid nitrogen. RNA isolation was performed using Illustra RNAspin mini kit (GE Healthcare) upon manufacturer instructions. The Genomic and RNA Profiling Core at Baylor College of Medicine conducted sample quality checks using the NanoDrop spectrophotometer and Agilent Bioanalyzer 2100. A double-stranded DNA library was created using 1 μg of total RNA, preparing the fragments for hybridization onto a flowcell. First, cDNA was created using the fragmented 3′ poly(A) selected portion of total RNA and random primers. Libraries were created from the cDNA by first blunt ending the fragments, attaching an adenosine to the 3′ end and finally ligating unique adapters to the ends. The ligated products were then amplified using 15 cycles of PCR. The resulting libraries were quantitated using the NanoDrop spectrophotometer and fragment size assessed with the Agilent Bioanalyzer. A qPCR quantitation was performed on the libraries to determine the concentration of adaptor ligated fragments using a Bio-Rad iCycler iQ Real-Time PCR Detection System and a KAPA Library Quant Kit. Using the concentration from the Bio-Rad qPCR machine, 18 pM of library was loaded onto a flowcell and amplified by bridge amplification using the Illumina cBot machine. A paired-end 100 cycle run was used to sequence the flowcell on the HiSeq 2500 Sequencing System.
Bioinformatics analysis
The Philadelphia neoadjuvant chemotherapy (NAC) data (GSE48277) were obtained from Gene Expression Omnibus (http://www.ncbi.nlm.nih.gov/geo), which consisted of microarray gene expression data of urothelial tumours before and after NAC treatment. The microarray data were quantile normalized and then log2 transformed. If there were multiple probes for a gene, we used the probe with median expression value for GSEA. For the RNA-seq data analysis, the reads were trimmed from the both ends to 90 nucleotides, and then mapped to the human genome (UCSC hg19) using Tophat with NCBI RefSeq genes as the reference and up to two possible mismatches. To reduce possible biases caused by RT–PCR, read duplicates were removed using samtools. HTseq (http://www-huber.embl.de/users/anders/HTSeq) was used to determine the number of reads falling in the known genes. The counts that indicate gene expression values were normalized to have the same total counts for each sample. The normalized counts were log2 transformed and 1 was added to read counts to avoid log2 transformation of zeros. Genes with small expression value (count <6) for all samples were not used for GSEA. The wound response gene signature (GO:0009611–response to wounding) was obtained from Amigo (http://amigo.geneontology.org) consisting of 1,163 genes.
Statistical analysis
All statistical analyses were performed using GraphPad Prism (GraphPad Software) and included two-tailed Student’s t-test or one-way ANOVA followed by Dunnett’s test for comparing the means of two or multiple groups, respectively. P <0.05 was considered statistically significant. No formal randomization was used in any experiment; for in vivo experiments animals were unbiasedly assigned into different treatment groups. Group allocation and outcome assessment was not performed in a blinded manner. No animals or samples were excluded from data analysis. On the basis of our preliminary results, we estimated that the tumour sizes in the GC treatment group are about 200 mm3 and we expected celecoxib plus GC combination treatment would reduce the tumour size to 80–100 mm3. With an estimated standard deviation of 50 mm3 within group, we expected to have at least 80% power to detect differences of tumour volume (α = 0.05, two-tailed t-test) using a sample size of 6 mice in each group. For in vivo experiments performed with patient-derived tumour cells, the sample size was dependent on the number of viable cells isolated upon tumour dissociation. Generally, at least six tumours were analysed for each group tested. In each set of data analysis, estimate variation is indicated in each figure as s.e.m. No statistical method was used to predetermine sample size.
Extended Data
Extended Data Figure 1. Human bladder urothelial carcinomas and their CK14 status pre- and post-neoadjuvant chemotherapy.
a, Table summarizing the clinical information of 15 patients with bladder urothelial carcinomas, with paired pre- and post-chemotherapy tissues (n = 15). PDX-3 was derived from cancer tissues from patient 3 (bold). b, Patient subgroups showing an enrichment (increase) or persistence (maintain high expression) (left) or a resolution (absence) (right) of CK14 staining after chemotherapy treatment. c, d, Representative images of CK14 immunohistochemistry staining (original magnification, ×20), sub-classified as enrichment/ persistence (c) and resolution (d) of CK14 staining in matching bladder urothelial carcinoma tissues obtained pre- and post-neoadjuvant chemotherapy. Representative staining patterns of CK14 high-infiltrative staining (>25%), CK14 low-infiltrative staining (<25%), CK14 basal-restricted staining, and CK14 resolution are individually indicated.
Extended Data Figure 2. Cytotoxic chemotherapy induces CK14+ CSC proliferation despite reducing tumour size.
a, Relative change in xenograft tumour volume from multiple xenograft tumour lines in response to GC chemotherapy or vehicle treatment (n = 6 per group). Xenograft tumours were derived from primary urothelial carcinoma patients (PDX-1 and PDX-2). b, Quantification of the percentage of CK14+ cancer cells in chemotherapy-treated and vehicle-treated xenograft tumours. c, Representative images demonstrating immunofluorescence staining of CK14+ cancer cells in chemotherapy-treated and vehicle-treated xenograft tumours. d, Representative images demonstrating immunofluorescence staining of pHH3 (red) and CK14 (green) in chemotherapy-treated and vehicle-treated xenograft tumours. Yellow arrows indicate CK14− pHH3+ cells, white arrows indicate CK14+pHH3+ cancer cells. e, Graph quantifying the change in phospho-histone H3 positive (pHH3+) proliferating cells within CK14+ cancer cells (n = 6 per group). All data represent mean ± s.e.m. Box plots in b show twenty-fifth to seventy-fifth percentiles, with line indicating the median and whiskers indicating the smallest and the largest values. *P <0.05; **P <0.01; ***P <0.001 (two-tailed Student’s t-test). Scale bar, 100 μm.
Extended Data Figure 3. Methodology to purify CK14+cells for functional evaluation of sphere-forming and tumorigenic properties.
a, Generation of a reporter construct to isolate viable CK14+ bladder cancer cells by FACS. A previously reported and validated human KRT14 gene promoter fragment was subcloned into a promoterless lentiviral construct that encodes a red fluorescent protein, DD-tdTomato. b–d, T24 high-grade urothelial carcinoma cells were stably transduced with the KRT14 reporter construct. FACS analysis validated that Tm+ CK14+ cells (red) represent a subpopulation of previously reported CD44+CD49f+ tumorigenic cells. e, Purified Tm+ CK14+ cancer cells demonstrated greater sphere-forming ability than Tm− CK14−cancer cells in vitro (biological duplicates). f, Tm+ CK14+ bladder cancer cells are approximately 60-fold enriched for tumorigenic cells when engrafted in immunocompromised mice in vivo. Summary of tumour engraftment efficiency and image demonstrating tumour size after transplantation of 10, 50, 500 and 5,000 Tm+ CK14+ or Tm− CK14− cancer cells as purified by FACS. Data represent mean and range (e) and mean ± s.e.m (f). ***P <0.001 (two-tailed Student’s t-test).
Extended Data Figure 4. Cell viability of purified Tm+CK14+ and Tm−CK14− cancer cells after GC chemotherapy treatment in vitro (raw FACS data for Fig. 1h).
Dot plots depict FACS analyses showing cell viability of Tm+ CK14+ (red) and Tm− CK14− (black) cancer cells following 11 consecutive days of chemotherapy treatment in vitro. The percentage of viable cells defined as annexin V− PI− is shown in the bottom left quadrant of each plot. Experiments were performed in biological duplicates.
Extended Data Figure 5. Cell cycle profiles of purified Tm+CK14+ and Tm−CK14− cancer cells after GC chemotherapy in vitro (raw FACS data for Fig. 1i).
Histogram plots depict original FACS analyses of cell cycle profiles from Tm+ CK14+ (red) and Tm− CK14− (black) cancer cells after 11 consecutive days of chemotherapy treatment in vitro. Experiment was performed in biological duplicates. PI, propidium iodide.
Extended Data Figure 6. LRCCs are mutually exclusive to active proliferative cancer cells.
a, b, Immunofluorescence staining to locate LRCCs (green, IdU+) at 0, 4 and 8 weeks of chase periods in patient-derived urothelial carcinoma xenograft (PDX-1) (a) and xenograft established from T24 high-grade urothelial carcinoma cells (b). c, d, Bar graph quantifying the percentage of LRCCs in patient-derived xenograft (PDX-1) (c) and immortalized cancer xenograft (T24) (d) at various chase periods (n = 4). e–g, Immunofluorescence staining to evaluate the localization of LRCCs (green, IdU+) and proliferating cells (red) using CldU (e), proliferating cell nuclear antigen (PCNA; f) or phospho-histone H3 (pHH3; g) in high-grade urothelial carcinoma (T24) at steady state. h, Immunofluorescence co-staining to locate IdU+ LRCCs, CldU+ proliferating and CK14+ cancer cells at various time points after GC chemotherapy. Data shown in c and d represent mean ± s.e.m. Scale bars, 100 μm.
Extended Data Figure 7. Celecoxib abrogates CK14+ cancer cell enrichment after GC chemotherapy in T24 and PDX-3 xenografts.
a, In vivo treatment protocol recapitulating clinical regimen of one chemotherapy cycle in the presence or absence of celecoxib treatment. b, Immunofluorescence staining examining the percentage of CK14+ cancer cells in representative T24 xenograft tumours from various treatment groups. Scale bars, 1,000 μm. c, Immunohistochemical staining examining the percentage of CK14+ cancer cells in representative PDX-3 xenograft tumours from various treatment groups. Scale bars, 1,000 μm. Images in b and c are representative of n = 6 tumours analysed for each treatment group.
Extended Data Figure 8. Co-administration of aspirin diminishes thrombosis without impairing adjuvant effect of celecoxib.
a, Antithrombotic effect of aspirin measurable by tail bleeding time. b, Temporal percentage change in tumour size after two cycles of celecoxib plus GC combination chemotherapy in the presence or absence of aspirin (n = 12 per group). c, Dynamics of COX1 and COX2 expression after GC chemotherapy, data shown for T24 cancer cells (displayed are representative blots from n = 3 experiments). All data represent mean ± s.e.m., tumour volume measurements shown in b are relative to mean tumour volume at day 0. *P <0.05; **P <0.01; ***P <0.001 (one-way ANOVA followed by Dunnett’s test for multiple comparisons); ns, not significant.
Extended Data Figure 9. Enrichment of the ‘wound-response gene signature’ in chemoresistant bladder urothelial carcinomas.
a, GSEA validated an enrichment of the ‘wound-response gene signature’ (GO:0009611) in a panel of non-responding (or chemoresistant) human urothelial bladder carcinomas (n = 20; GSE48277), by comparing post-chemotherapy to pre-chemotherapy cancer tissues. Heat map demonstrates part of the genes within leading edge, including the COX2 gene PTGS2. b, Enlarged heat map for Fig. 4g. c, Enlarged heat map for Fig. 4h. d, Bioinformatics analysis of chemoresistant cancers in a panel of non-responding (or chemoresistant) human urothelial bladder carcinomas (n = 20; GSE48277) validated a significant increase of PTGS2 in post-chemotherapy tissues in comparison to matching pre-chemotherapy tissues. e, Dot plots representing the scoring of COX2 staining in bladder urothelial carcinoma tissues obtained pre-neoadjuvant chemotherapy in two subgroups of patients with different response to neoadjuvant chemotherapy (subgroups described in Extended Data Fig. 1a–c).
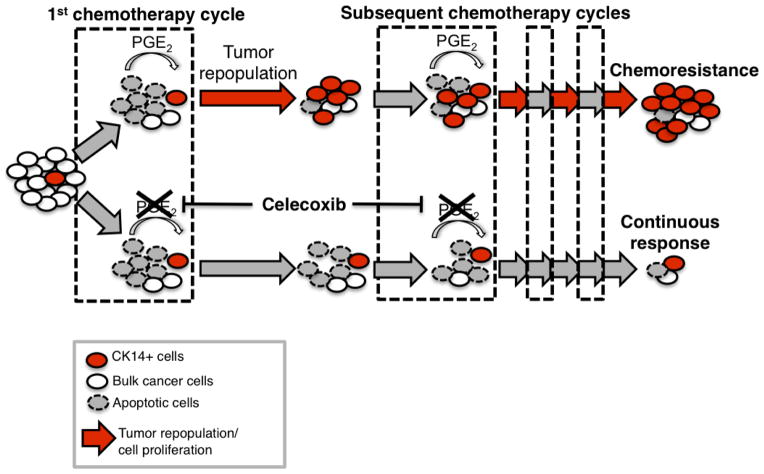
Extended Data Figure 10. Schematic model: recurrent CSC repopulation and its manifestation of chemoresistance.
Cytotoxic chemotherapy effectively induces apoptosis but paradoxically elicits a wound response of bladder cancer stem cells to proliferate and repopulate residual tumours. Release of PGE2 from neighbouring apoptotic cancer cells is sufficient to promote this CSC repopulation. In vivo administration of celecoxib effectively abolishes this PGE2/COX2-mediated wound response gene signature, and attenuates progressive manifestation of chemoresistance in preclinical models of human urothelial carcinomas.
Supplementary Material
Acknowledgments
We would like to thank S. Tsai, J. Rosen, L. Donehower, M. Brenner and B. Deneen for their editorial suggestions, and grant funding from the National Cancer Institute CA129640, CA175397, V Scholar Award, Dan L Duncan Career Award, and Bladder Cancer Partnership (K.S.C.), CPRIT pre-doctoral fellowship RP101499 (A.V.K.), AUA Research Scholar Award (P.L.H.) and CPRIT training grant RP140102 for SMART program (T.T.R.). This work is supported by the Genomic & RNA Profiling Core (L. White), Cytometry & Cell Sorting Core (NIAID AI036211, NCI CA125123 and RR024574; J. Sederstorm), and Human Tissue Acquisition & Pathology Core (NCI CA125123; M. Ittmann) at Baylor College of Medicine, the Texas Advanced Computing Center at UT Austin and Rice University for providing High Performance Computing resources. We dedicate this work to the memory of J. Pride (a patient with bladder cancer and friend of I. Weissman), who funded the original work of K.S.C., which served as an important foundation leading to the current study.
Footnotes
Online Content Methods, along with any additional Extended Data display items and Source Data, are available in the online version of the paper; references unique to these sections appear only in the online paper.
Author Contributions K.S.C. and A.V.K. conceived, designed and performed data analysis. A.V.K., J.X. and S.P. performed the functional xenograft tumour experiments. A.V.K., J.X., E.L. and P.L.H. performed molecular analyses experiments. A.V.K. and J.X. performed, and Q.M. and F.C. analysed, the RNA-seq studies. S.P.L. provided human samples. R.K. coordinated human sample acquisition, R.K., P.L.H. and T.T.R. performed immunohistochemical and pathological analysis. K.S.C. and A.V.K. wrote the manuscript.
RNA-seq raw data have been deposited in the NCBI BioProject database under accession number PRJNA263046.
The authors declare no competing financial interests.
Readers are welcome to comment on the online version of the paper.
References
- 1.Visvader JE, Lindeman GJ. Cancer stem cells in solid tumours: accumulating evidence and unresolved questions. Nature Rev Cancer. 2008;8:755–768. doi: 10.1038/nrc2499. [DOI] [PubMed] [Google Scholar]
- 2.Clevers H. The cancer stem cell: premises, promises and challenges. Nature Med. 2011;17:313–319. doi: 10.1038/nm.2304. [DOI] [PubMed] [Google Scholar]
- 3.Kreso A, Dick JE. Evolution of the cancer stem cell model. Cell Stem Cell. 2014;14:275–291. doi: 10.1016/j.stem.2014.02.006. [DOI] [PubMed] [Google Scholar]
- 4.Beachy PA, Karhadkar SS, Berman DM. Tissue repair and stem cell renewal in carcinogenesis. Nature. 2004;432:324–331. doi: 10.1038/nature03100. [DOI] [PubMed] [Google Scholar]
- 5.Arwert EN, Hoste E, Watt FM. Epithelial stem cells, wound healing and cancer. Nature Rev Cancer. 2012;12:170–180. doi: 10.1038/nrc3217. [DOI] [PubMed] [Google Scholar]
- 6.Ito M, et al. Stem cells in the hair follicle bulge contribute to wound repair but not to homeostasis of the epidermis. Nature Med. 2005;11:1351–1354. doi: 10.1038/nm1328. [DOI] [PubMed] [Google Scholar]
- 7.Mascré G, et al. Distinct contribution of stem and progenitor cells to epidermal maintenance. Nature. 2012;489:257–262. doi: 10.1038/nature11393. [DOI] [PubMed] [Google Scholar]
- 8.Kim JJ, Tannock IF. Repopulation of cancer cells during therapy: an important cause of treatment failure. Nature Rev Cancer. 2005;5:516–525. doi: 10.1038/nrc1650. [DOI] [PubMed] [Google Scholar]
- 9.Wilson A, et al. Hematopoietic stem cells reversibly switch from dormancy to self-renewal during homeostasis and repair. Cell. 2008;135:1118–1129. doi: 10.1016/j.cell.2008.10.048. [DOI] [PubMed] [Google Scholar]
- 10.Chan KS, et al. Identification, molecular characterization, clinical prognosis, and therapeutic targeting of human bladder tumor-initiating cells. Proc Natl Acad Sci USA. 2009;106:14016–14021. doi: 10.1073/pnas.0906549106. [DOI] [PMC free article] [PubMed] [Google Scholar]
- 11.Volkmer JP, et al. Three differentiation states risk-stratify bladder cancer into distinct subtypes. Proc Natl Acad Sci USA. 2012;109:2078–2083. doi: 10.1073/pnas.1120605109. [DOI] [PMC free article] [PubMed] [Google Scholar]
- 12.Ho PL, Lay EJ, Jian W, Parra D, Chan KS. Stat3 activation in urothelial stem cells leads to direct progression to invasive bladder cancer. Cancer Res. 2012;72:3135–3142. doi: 10.1158/0008-5472.CAN-11-3195. [DOI] [PMC free article] [PubMed] [Google Scholar]
- 13.Ho PL, Kurtova A, Chan KS. Normal and neoplastic urothelial stem cells: getting to the root of the problem. Nature reviews Urology. 2012;9:583–594. doi: 10.1038/nrurol.2012.142. [DOI] [PMC free article] [PubMed] [Google Scholar]
- 14.Shin K, et al. Cellular origin of bladder neoplasia and tissue dynamics of its progression to invasive carcinoma. Nature Cell Biol. 2014;16:469–478. doi: 10.1038/ncb2956. [DOI] [PMC free article] [PubMed] [Google Scholar]
- 15.Van Batavia J, et al. Bladder cancers arise from distinct urothelial sub-populations. Nature Cell Biol. 2014;16:982–991. doi: 10.1038/ncb3038. [DOI] [PubMed] [Google Scholar]
- 16.Wang X, Zinkel S, Polonsky K, Fuchs E. Transgenic studies with a keratin promoter-driven growth hormone transgene: prospects for gene therapy. Proc Natl Acad Sci USA. 1997;94:219–226. doi: 10.1073/pnas.94.1.219. [DOI] [PMC free article] [PubMed] [Google Scholar]
- 17.Kelland L. The resurgence of platinum-based cancer chemotherapy. Nature Rev Cancer. 2007;7:573–584. doi: 10.1038/nrc2167. [DOI] [PubMed] [Google Scholar]
- 18.Cotsarelis G, Sun TT, Lavker RM. Label-retaining cells reside in the bulge area of pilosebaceous unit: implications for follicular stem cells, hair cycle, and skin carcinogenesis. Cell. 1990;61:1329–1337. doi: 10.1016/0092-8674(90)90696-c. [DOI] [PubMed] [Google Scholar]
- 19.Chen J, et al. A restricted cell population propagates glioblastoma growth after chemotherapy. Nature. 2012;488:522–526. doi: 10.1038/nature11287. [DOI] [PMC free article] [PubMed] [Google Scholar]
- 20.Green DR. The end and after: how dying cells impact the living organism. Immunity. 2011;35:441–444. doi: 10.1016/j.immuni.2011.10.003. [DOI] [PubMed] [Google Scholar]
- 21.Goessling W, et al. Genetic interaction of PGE2 and Wnt signaling regulates developmental specification of stem cells and regeneration. Cell. 2009;136:1136–1147. doi: 10.1016/j.cell.2009.01.015. [DOI] [PMC free article] [PubMed] [Google Scholar]
- 22.Hoggatt J, et al. Differential stem- and progenitor-cell trafficking by prostaglandin E2. Nature. 2013;495:365–369. doi: 10.1038/nature11929. [DOI] [PMC free article] [PubMed] [Google Scholar]
- 23.Lukacs RU, Goldstein AS, Lawson DA, Cheng D, Witte ON. Isolation, cultivation and characterization of adult murine prostate stem cells. Nature Protocols. 2010;5:702–713. doi: 10.1038/nprot.2010.11. [DOI] [PMC free article] [PubMed] [Google Scholar]
- 24.Meeks JJ, et al. A systematic review of neoadjuvant and adjuvant chemotherapy for muscle-invasive bladder cancer. Eur Urol. 2012;62:523–533. doi: 10.1016/j.eururo.2012.05.048. [DOI] [PubMed] [Google Scholar]
- 25.Sternberg CN, et al. ICUD-EAU International Consultation on Bladder Cancer 2012: chemotherapy for urothelial carcinoma-neoadjuvant and adjuvant settings. Eur Urol. 2013;63:58–66. doi: 10.1016/j.eururo.2012.08.010. [DOI] [PubMed] [Google Scholar]
- 26.Niegisch G, et al. Neoadjuvant chemotherapy in patients with muscle-invasive bladder cancer: which patients benefit? Eur Urol. 2013;64:355–357. doi: 10.1016/j.eururo.2013.06.002. [DOI] [PubMed] [Google Scholar]
- 27.Coxib and traditional NSAID Trialists’ (CNT) Collaboration. Vascular and upper gastrointestinal effects of non-steroidal anti-inflammatory drugs: meta-analyses of individual participant data from randomised trials. Lancet. 2013;382:769–779. doi: 10.1016/S0140-6736(13)60900-9. [DOI] [PMC free article] [PubMed] [Google Scholar]
- 28.Wu XR. Urothelial tumorigenesis: a tale of divergent pathways. Nature Rev Cancer. 2005;5:713–725. doi: 10.1038/nrc1697. [DOI] [PubMed] [Google Scholar]
- 29.Flaig TW, Theodorescu D. Bladder cancer in 2011: the dawn of personalized medicine. Nature reviews Urology. 2012;9:65–66. doi: 10.1038/nrurol.2011.220. [DOI] [PMC free article] [PubMed] [Google Scholar]
- 30.Knowles MA, Hurst CD. Molecular biology of bladder cancer: new insights into pathogenesis and clinical diversity. Nature Rev Cancer. doi: 10.1038/nrc3817. http://dx.doi.org/10.1038/nrc3817 (in the press) [DOI] [PubMed]
Associated Data
This section collects any data citations, data availability statements, or supplementary materials included in this article.


