

Abstract
Metabolic alterations have been implicated in the etiology of temporal lobe epilepsy (TLE), but whether or not they have a functional impact on cellular energy producing pathways (glycolysis and/or oxidative phosphorylation) is unknown. The goal of this study was to determine if alterations in cellular bioenergetics occur using real-time analysis of mitochondrial oxygen consumption and glycolytic rates in an animal model of TLE. We hypothesized that increased steady-state levels of reactive oxygen species (ROS) initiated by epileptogenic injury result in impaired mitochondrial respiration. We established methodology for assessment of bioenergetic parameters in isolated synaptosomes from the hippocampus of Sprague-Dawley rats at various times in the kainate (KA) model of TLE. Deficits in indices of mitochondrial respiration were observed at time points corresponding with the acute and chronic phases of epileptogenesis. We asked if mitochondrial bioenergetic dysfunction occurred as a result of increased mitochondrial ROS and if it could be attenuated in the KA model by pharmacologically scavenging ROS. Increased steady-state ROS in mice with forebrain-specific conditional deletion of manganese superoxide dismutase (Sod2fl/flNEXCre/Cre) in mice resulted in profound deficits in mitochondrial oxygen consumption. Pharmacological scavenging of ROS with a catalytic antioxidant restored mitochondrial respiration deficits in the KA model of TLE. Together, these results demonstrate that mitochondrial respiration deficits occur in experimental TLE and ROS mechanistically contribute to these deficits. Furthermore, this study provides novel methodology for assessing cellular metabolism during the entire time course of disease development.
Keywords: Oxidative Stress, Mitochondrial Dysfunction, Temporal Lobe Epilepsy, Seizures, Kainic Acid
Introduction
Metabolic impairment underlies the etiology of various neurological disorders such as Alzheimer's disease, Parkinson's disease, traumatic brain injury and stroke (Beal, 2004; Rahman, 2012). Its role in the etiology of epilepsy is receiving increased attention (Kudin et al., 2002; Kovac et al., 2012; Rowley and Patel, 2013). Epilepsy is one of the most common neurological disorders with an incidence of ∼1% in the population (Delgado-Escueta et al., 1999). Temporal lobe epilepsy (TLE), a form of acquired epilepsy is usually triggered by an insult such as brain injury and the development of chronic seizures after a silent period devoid of seizures. The process by which epilepsy develops i.e. epileptogenesis is known to involve multiple molecular and physiological changes that alter brain circuitry to promote excitability. In human TLE, two characteristics changes in metabolism are known to occur, the mechanistic basis of which are unclear. First, glucose utilization or increased metabolism occurs during seizures or ictal events. Secondly, the period between seizures or interictal period is typified by glucose hypometabolism (Chugani et al., 1994; Lee et al., 2012). Attempts to understand the role of glucose overutilization during seizures have led to studies demonstrating the anticonvulsant effects of limiting glycolysis with 2-deoxyglucose, fructose 1,6 bisphosphate or ketogenic diets (Bough et al., 2006; Lian et al., 2007; Stafstrom et al., 2009).
Multiple lines of evidence support a role of mitochondria in the development of epilepsy, which was first recognized by the occurrence of epilepsy in patients with inherited mitochondrial disorders (Wallace et al., 1988; Mecocci et al., 1993). Almost all known functions of mitochondria have a capacity to impact epilepsy, but ATP production and the generation of reactive oxygen species (ROS) are prime candidates due to the energy demands of seizures and sensitivity of mitochondrial processes to oxidative damage. In studies of patients with TLE, the role of mitochondria has been suggested by inhibition of complex I of the electron transport chain (ETC) and reduction in N-acetyl aspartate levels in the hippocampus (Kunz et al., 2000; Vielhaber et al., 2008). Recent work from our group has shown increases in production of mitochondrial ROS, reactive nitrogen species (RNS), oxidative damage to oxidant-sensitive mitochondrial proteins (aconitase and complex I) and glutathione depletion in animal models of TLE (Jarrett et al., 2008; Waldbaum et al., 2010; Ryan et al., 2012, 2013). Increased mitochondrial ROS and oxidative damage to ETC enzymes suggests that mitochondrial respiration may be impaired in TLE. However, no studies to date have demonstrated if mitochondrial respiration is altered in experimental TLE and if so, determined its mechanistic basis. Here, we sought to determine if there are functional mitochondrial deficits through measurement of oxidative phosphorylation (OXPHOS) in experimental TLE. Assessment of mitochondrial respiration is a necessary step in asking if mitochondria are actually “dysfunctional” or have altered activities of individual enzymes (Brand and Nicholls, 2011). Furthermore, it is important to understand if chronic epilepsy renders brain mitochondria deficient in their reserve capacity, a measure of their ability to respond to an additional bioenergetic demand.
Materials and Methods
Reagents
KA purchased from AG Scientific, Inc. product # K-1013. All other reagents purchased from Sigma Aldrich or Fisher Scientific.
Animals
Animal studies were carried out according to the National Institute of Health Guide for the Care and Use of Laboratory Animals. All procedures were approved by the Institute Animal Care and Committee (IACUC) at the University of Colorado Anschutz Medical Campus. Adult male Sprague-Dawley rats (300-350g) were injected with KA (11 mg/Kg, s.c.), or saline. 90 minutes after the initiation of SE animals received 10 mg/Kg s.c. diazepam to stop seizures. Animals were continuously monitored for behavioral seizures using a modified Racine-scale as previously described (Liang et al., 2000). Animals were then euthanized at various time-points after initial treatment. For assessment of bioenergetic parameters at the 6 wk time point, rats exhibiting >2 chronic seizures by video monitoring were used.
Western Blot Analysis
Western blot analysis of subunit IV of cytochrome c oxidase (COX IV) was performed as in (Castello et al., 2008). COX IV membranes were incubated with horse-radish peroxidase-conjugated anti-mouse secondary antibody and developed using ECL Western blotting detection reagent. Bands were normalized to actin as a loading control.
Preparation of synaptosomes
Synaptosomes were isolated from the hippocampus of control and treated animals at various time points after KA injection according to the methods in (Dunkley et al., 2008; Choi et al., 2009)with slight modifications. One half of the hippocampus was rapidly dissected and transferred to a Dounce glass homogenizer filled with 1 mL homogenization buffer (320 mM sucrose, 1 mM EDTA, 0.25 mM dithiothrietol) and homogenized with 4 and 8 strokes of a loose and tight pestle respectively. The homogenate was then centrifuged at 1000 g for 10 minutes at 4°C. The supernatant (∼1 mL) was then slowly transferred to a Percoll gradient consisting of 3 mL layers of 3%, 10%, and 23% Percoll in homogenization buffer. These tubes were then centrifuged at 32500 g for 10 minutes at 4°C in a SS-34 fixed-angle rotor in a RC5C Sorvall centrifuge. Synaptosomes were isolated from the band formed in between the 10% and 23% Percoll layers by removing ∼3 mL of fluid. This was added to 7 mL of an ionic buffer (20 mM HEPES, 10 mM glucose, 1.2 mM Na2HPO4, 1 mM MgCl2, 5 mM NaHCO3, 5 mM KCl, 140 mM NaCl, pH 7.4) and centrifuged at 15000 g for 15 minutes to pellet the synaptosomes. The pellets were then resuspended in ionic buffer to analyze for protein amount by the Bradford protein assay.
Plating synaptosomes and XF24 Analysis
Synaptosomes were diluted to 200 μg/ml of total protein in ionic buffer and 50 μl of this solution was added to PEI-coated Seahorse V7 tissue cultures plates for a total protein amount of 10 μg. The plate was then centrifuged in a Hermle Z300 centrifuge using a Hermle 221.16 VO1 rotor at 2700 g for one hour at 4°C. Ionic buffer is carefully removed and replaced with 630 μl incubation buffer (3.5 mM KCl, 120 mM NaCl, 1.3 mM CaCl2, .4 mM KH2PO4, 1.2 mM Na2SO4, 2 mM MgSO4, 15 mM glucose, 4 mg/ml bovine serum albumin, 10 mM NaPyruvate, pH 7.4). The plate was then immediately incubated at 37°C and loaded into an XF24 extracellular flux analyzer (Seahorse Bioscience). Real-time analysis of oxygen consumption and glycolytic rates were assessed in isolated synaptosomes from the hippocampus of rats at various times (3h, 8h, 16h, 48h, 1wk, 3wk and 6wk) after KA administration. Oxygen consumption rates (OCR) and extracellular acidification rates (ECAR) were obtained by sequential measurement cycles that consist of a 30 second mixing time followed by a 2 minute wait and a 3 minute measurement. Reagents were added at the correct dilutions in incubation buffer.
Video Monitoring
Animals in chronic time points (3 wk and 6 wk) were video monitored for 48 hours prior to euthanasia to ensure that animals were epileptic by assessment of multiple behavioral seizures. All animals used had at a minimum two behavioral seizures of p4 or higher on our modified Racine scale or were otherwise excluded.
Metalloporphyrin administration
Rats were treated with manganese (III) meso-tetrakis (di-N-ethylimidazole) porphyrin (MnIIITDE-2-ImP5+, also denoted as AEOL 10150) or vehicle (saline) by subcutaneous injection 60 minutes after KA and every 4 hours after until 24 hours. MnIIITDE-2-ImP5+ was diluted into phosphate buffered saline to achieve the final concentration of 5 mg/ml and injected for a final concentration at 5 mg/kg. Animals were divided into 4 groups: 1) Vehicle-Vehicle 2) Chemoconvulsant-vehicle 3) Chemoconvulsant- MnIIITDE-2-ImP5+ 4) Vehicle- MnIIITDE-2-ImP5+. It was determined that the vehicle- MnIIITDE-2-ImP5+ groups have no difference in metabolism compared to control animals (data not shown) and therefore are not shown in the figures.
Forebrain-specific Sod2 conditional knockout mice
Sod2 deletion was neuronally directed by crossing Sod2 floxed mice with a mouse line in which Cre expression is driven by the NEX member of the neuroD-subfamily of neuronal basic helix-loop-helix (bHLH) transcription factors. These mice have been shown to drive expression of the Cre recombinase protein in a wide variety of brain structures, including cerebral cortex and hippocampus (Goebbels et al., 2006). Sod2fl/fl mice were generated as described previously (Ikegami et al., 2002) and transferred from Dr. T. Huang's laboratory (Stanford University). The Sod2fl/fl mice were bred with NEXCre/Cre mice generously donated by H Wang upon permission from Dr. K. Nave (Max-Plank-Institute of Experimental Medicine, Goettingen Germany). Once heterozygous offspring were produced, they were crossbred to produce an F2 generation which was genotyped upon weaning on post-natal day 20 using previously a described method below. Homozygous Sod2fl/flNEXCreCre mice of both genders were compared with wild type and heterozygous littermates. Western blot analysis was used to confirm decreased expression of Sod2 (data not shown).
Genotyping
Ear or tail snips were collected and DNA collected and purified with a Qiagen DNeasy spin column kit. Sod2: The wild type gene was identified by the presence of a 500 b.p. PCR product amplified by the sense primer P1 (5′-CGA GGG GCA TCT AGT GGA GAA G- 3′ 0.4 uM) and the antisense primer P2 (5′-TTA GGG CTC AGG TTT GTC CAG AA-3′, 0.1 uM). The floxed gene was identified by the presence of a 358 b.p. product amplified by the P1 sense primer and a Neor P4 antisense primer (5′-AGC TTG GCT GGA CGT AA-3′, 0.35 uM)(Ikegami et al., 2002). Invitrogen Platinum Taq Polymerase in the presence of 4.3 mM MgCl2 was used in the following PCR cycling conditions: 94°C 1 min, followed by 35 cycles of 94°C for 30 sec, 62°C for 30 sec, 72°C for 30 sec, followed by a final extention of 72°C for 5 minutes. NEX-Cre: Wild type alleles were identified by the presence of a 770 b.p. product amplified by primer P4 (5′-GAG TCC TGG AAT CAG TCT TTT TC-3′) and primer P5 (5′-AGA ATG TGG AGT AGG GTG AC-3′) and the NEX-Cre recombinase gene was identified by the presence of a 520 b.p. product amplified by the P4 and P6 primer (5′-CCG CAT AAC CAG TGA AAC AG-3′). Invitrogen Platinum Taq Polymerase in the presence of 3 mM MgCl2 was used in the following PCR cycling conditions: 94°C 1 min, followed by 39 cycles of 54°C for 30 sec, 54°C for 30 sec, 72°C for 1 min., followed by a final extension of 72°C for 5 minutes.
Statistical analyses
For all biochemical analyses, one-way ANOVA or student's t test were used with GraphPad Prism 5 software. P values less than 0.05 were considered significant.
Results
Mitochondrial Respiration Deficits and Altered Glycolysis in KA Model of experimental TLE
Isolated brain synaptosomes allow simultaneous measurement of glycolysis and mitochondrial respiration, two major energy producing processes. Synaptosomal preparations are ideally suited for temporal metabolic assessment of brain tissue from animals as they contain synaptic machinery, including neuronal and astrocytic mitochondria. We adapted extracellular flux analysis to assess mitochondrial function by mitochondrial OCR in synaptosomes from animals subjected to epileptogenic injury. This technique allows measurement of small amounts of tissue and therefore, specific brain areas can be analyzed. To ensure that mitochondrial content was similar in treated and control groups, the mitochondrial protein COX IV was measured from the synaptosomes in each group. Figure 1 shows equal amounts of mitochondrial protein in each group indicating that any deficits occurring between control and treatment groups were due to an actual deficit in respiration and not changes in mitochondrial content. Additionally, previous work from our laboratory has shown that mitochondrial enzyme deficits occurring in animal models of TLE are specific to oxidant injury and not due to overall loss of mitochondrial content. This is best illustrated by the demonstration that SE, an epileptogenic injury, results in inactivation of the oxidant-sensitive enzyme aconitase, but not the oxidant resistant enzyme fumarase (Liang et al., 2000). Figure 1 also depicts an electron micrograph of a synaptosome showing that mitochondria are contained in synaptosomes after isolation.
Figure 1.

Equal amounts of mitochondrial protein in control and KA groups (A) Western blot for the mitochondrial protein COX IV and loading control (B) Electron microscope image of isolated synaptosome containing mitochondria.
To determine whether mitochondrial dysfunction occurs in experimental TLE, hippocampal synaptosomes were isolated from treated and control animals at various time points after SE (3h, 8h, 16h, 48h, 1wk, 3wk, and 6wk) and run on an XF24 analyzer. Experimental TLE was initiated in adult rats with the glutamatergic agonist KA, which induces SE followed by a seizure-free latent period which culminates in chronic spontaneous seizures or epilepsy (Jarrett et al., 2008; Ryan et al., 2012). Animals were euthanized at different time points after SE to isolate hippocampal synaptosomes and monitor indices of mitochondrial respiration in the acute (up to 48 hours after SE), latent (1-3 weeks after SE), and chronic (spontaneous seizures) phases of epileptogenesis. Animals in the chronic time-points were confirmed epileptic by video monitoring. A complete list of rates for different indices of mitochondrial respiration (OCR) is included in Table 1. We observed deficits in indices of mitochondrial functions during the acute and chronic, but not latent phase of KA-induced epilepsy. Figure 2a shows how different mitochondrial indices are calculated, and as illustrated in Figure 2b, there is a 50% decrease in maximal respiration and reserve capacity occurring at the 48 hour time point. Figures 2c and 2d depict the entire time course for maximal and reserve capacity measured in the KA model. Notably, reserve capacity and maximal OCR, which measure the ability of cells, synaptosomes or mitochondria to handle additional ATP demand, were decreased in the acute and chronic time points of KA-induced epilepsy likely as a consequence of seizure activity. Additionally, all other indices with the exception of non-mitochondrial respiration were significantly decreased in the acute and chronic time-points. Baseline respiration decreased by 50% and 21% in the acute and chronic phases, respectively. ATP-linked respiration determined by the addition of the ATP-synthase inhibitor, oligomycin was decreased by 40% and 24% in the acute and chronic phases, respectively. These deficits observed in the acute phase (16h-48h) return to control values in the latent time period (1 wk) and the deficits return in the chronic time point (3-6 weeks). This bi-phasic occurrence of mitochondrial dysfunction is highly reminiscent of a bi-phasic occurrence of oxidative stress in the KA and pilocarpine models of epilepsy (Jarrett et al., 2008; Waldbaum et al., 2010).
Table 1. OCR for KA-lnduced Epileptogenesis.
| OCR | Basal Respiration | ATP-Linked Respiration | Proton Leak | ||||||
|---|---|---|---|---|---|---|---|---|---|
|
| |||||||||
| KA | |||||||||
|
| |||||||||
| Time point | Control | KA | Control | KA | Control | KA | |||
| 3HR | 152.9 ±21.1 | 167.8 ± 10.4 | 78.54 ±2.6 | 72.74 ±1.6 | 74.37 ± 23.7 | 95.05 ±11.2 | |||
| 8HR | 168.3 ±26.9 | 155.9 ± 16.7 | 76.55 ±3.2 | 67.15 ±6.5 | 91.71 ±23.7 | 88.75 ±10.4 | |||
| 16HR | 136.8 ±11.2 | 109.5 ±6 | 75.21 ±2.6 | 66.49 ± 7.4 | 61.61 ±13.8 | 43.03 ± 9.2 | |||
| 48 HR | 172.3 ±3.2 | 85.48 ± 12.6 | * | 89.06 ±8.9 | 53.18 ±3.9 | * | 83.22 ±5.7 | 32.30 ±10.2 | * |
| 1 WK | 158.1 ±15.4 | 135.2 ± 15.3 | 87.36 ±21.2 | 63.58 ± 8.7 | 70.73 ±5.8 | 71.65 ±14.8 | |||
| 3WK | 133.1 ±12.7 | 98.19 ±6.4 | * | 59.58 ±5.7 | 39.43 ± 5.4 | * | 73.48 ± 9.2 | 58.76 ± 4.2 | |
| 6WK | 135.3 ±9.7 | 107.0 ±3.2 | * | 28.64 ±10 | 23.14 ±7.1 | 104.1 ±6 | 78.87 ± 4 | ** | |
|
|
|||||||||
| KA | Maximal Respiration | Reserve Capacity | Non-mitochondrial Respiration | ||||||
|
| |||||||||
| Time point | Control | KA | Control | KA | Control | KA | |||
| 3 HR | 1363 ±87.2 | 1464 ± 28.5 | 1211 ±66.1 | 1296 ±30.7 | 61.11 ±5 | 62.11 ±6 | |||
| 8HR | 1391 ±50.9 | 1252 ±56.3 | 1223 ±23.9 | 1096 ±46.6 | 59.42 ± 1.6 | 51.85 ±4.6 | |||
| 16HR | 1027 ±250 | 716.1 ±52.9 | * | 890.2 ± 238.8 | 606.6 ±48.8 | * | 72.52 ±13.7 | 71.72 ±5.6 | |
| 48 HR | 1287 ±2.3 | 669.9 ±128.2 | * | 1115 ± 0.9 | 584.4 ±115.8 | * | 58.14 ±0.8 | 46.08 ± 6 | |
| 1 WK | 1272 ± 27 | 1204 ±153.4 | 1114 ± 11.7 | 1068 ±138.8 | 47.09 ±4.1 | 42.51 ± 6.3 | |||
| 3WK | 1054 ±92.4 | 750.5 ± 60 | * | 921.1 ±83 | 652.3 ±55.9 | * | 50.90 ±4.2 | 29.19 ±3.1 | ** |
| 6WK | 1116 ± 37.1 | 871.3 ±44.2 | ** | 983.5 ± 35.3 | 769.3 ±43.6 | ** | 35.87 ±3.4 | 35.92 ± 3.7 | |
|
|
|||||||||
Oxygen consumption rates of synaptosomes in controls vs. KA treatment.
p< 0.05;
p< 0.01 by one-way ANOVA. n = 4-8 in each group.
Figure 2.

Mitochondrial dysfunction occurs in the acute and chronic phases of epileptogenesis. (A) Shaded areas indicative of different mitochondrial respiration indices a) Basal Respiration b) ATP-Linked Respiration c) Proton Leak d) Maximal Respiration e) Reserve Capacity f) Non-Mitochondrial Respiration (B) Example Trace of a control and KA treated animal 48 hours after SE (C and D) Time course of maximal respiration and reserve capacity of control and KA-treated animals. *p< 0.05; **p< 0.01 significance by one-way ANOVA, n = 4-8.
To determine if different regions of the hippocampus contribute to the observed metabolic deficits, animals were euthanized and the dentate gyrus, CA1, and CA3 areas of the hippocampus were micro-dissected from control and KA-treated animals. Due to the small amount of tissue obtained, we pooled tissue from 4 control animals and 5 KA-treated animals and isolated synaptosomes from these pooled samples. The different groups were then run in triplicate to obtain the trace in Figure 3a. Interestingly, the CA1 and CA3 areas, but not the dentate gyrus of the hippocampus showed decreased maximal respiration rates compared to their respective controls (Figure 3b). This deficit corresponds to the known vulnerability of the CA1 and CA3 neurons to death and resistance of the granule neurons of the dentate gyrus (Pollard et al., 1994). No changes were seen in the mitochondrial protein COX IV in the isolated synaptosomes from the different regions (data not shown). Therefore, mitochondrial dysfunction observed in whole hippocampal synaptosomes in the KA model is primarily driven by the dysfunction occurring in the CA1 and CA3 regions of the hippocampus and correlates with the vulnerability of hippocampal subfields to damage.
Figure 3.

Region-specific mitochondrial deficits in KA model of TLE. (A) Example trace of bioenergetic profile from pooled tissue from control and KA-treated rats from listed hippocampal regions. (B) Maximal respiration rates from hippocampal regions from control and KA-treated rats. Error bars represent mean respiration values +/- standard deviation of three replicates from 4 pooled control and 5 pooled KA treated rats.
Simultaneous measurement of glycolytic rates by extracellular flux analysis revealed a decrease in glycolytic capacity after an oligomycin challenge in hippocampal synaptosomes from KA animals in the acute (48h), but not latent or chronic phase (Table 2, Figure 4). This acute deficit in glycolytic rates suggests a response to KA-induced SE rather than alterations in isolated spontaneous seizures characteristic in epilepsy.
Table 2. Glycolytic Rates in KA-Induced Epileptogenesis.
| ECAR | Baseline ECAR | Oligomycin | |||
|---|---|---|---|---|---|
|
| |||||
| KA | |||||
|
| |||||
| Time point | Control | KA | Control | KA | |
| 3 HR | 14.48 ± 4 | 16.39 ± 3.1 | 29.49 ± 2.3 | 30.83 ± 6.9 | |
| 8HR | 11.36 ± 2.8 | 11.78 ± 3 | 47.62 ± 4.3 | 38.14 ± 6.5 | |
| 16 HR | 15.16 ± 0.6 | 16.63 ± 2.6 | 28.97 ± 3.3 | 27.83 ± 5.2 | |
| 48 HR | 17.08 ± 0.2 | 13.96 ± 1.6 | 37.12 ± 3.1 | 15.58 ± 1.4 | ** |
| 1 WK | 11.83 ± 1.5 | 15.40 ± 2 | 35.25 ± 3.7 | 27.86 ± 2.5 | |
| 3 WK | 12.14 ± 0.6 | 11.01 ± 0.4 | 14.36 ± 1.6 | 10.55 ± 0.7 | |
| 6 WK | 5.747 ± 1.4 | 6.800 ± 1.5 | 12.64 ± 1.3 | 12.41 ± 1.5 | |
|
|
|||||
Glycolytic rates (ECAR) of synaptosomes in control vs. KA treatment.
p< 0.05;
p< 0.01 by one-way ANOVA. n= 4-8 in each group.
Figure 4.

Glycolytic capcity is lowered in the acute phase. (A) Shaded area indicates how glycolytic capacity is calculated on an example trace of ECAR from a control and KA-treated animal 48 hours after SE (B) Time course of glycolytic capacity of control and KA-treated animals. *p< 0.05; **p< 0.01 significance by one-way ANOVA, n = 4-8.
Previously our laboratory has established the role of ROS in seizures and epileptogenesis using transgenic mice overexpressing and knockout mice lacking manganese superoxide dismutase (MnSOD or Sod2). We have shown that mice overexpressing Sod2 are protected against KA-induced injury and mice partially deficient in Sod2 are more susceptible to spontaneous and handling-induced seizures (Liang and Patel, 2004). Later, using a germ line global Sod2 knockout mouse we showed that mitochondrial disease in these animals resulted in epilepsy around P17-20 and that oxidative stress and seizures could be attenuated by pharmacologically scavenging ROS (Liang et al., 2012). Since global mitochondrial dysfunction in Sod2 -/- mice may have secondarily caused mitochondrial deficits, here we asked if conditional deletion of Sod2 in forebrain neurons was sufficient to result in mitochondrial OCR deficits. Conditional deletion of Sod2 in forebrain neurons using a floxed Sod2 (Sod2fl/fl) crossed with a Cre-line targeting the Nex gene (NexCre/Cre) resulted in severe mitochondrial deficits in reserve and maximal respiratory capacity in forebrain synaptosomes in 1 month old Sod2fl/fl mice compared to wild-type (Sod2+/+NEX+/+) and heterozygous (Sod2+/flNEX+/Cre) animals (Figure 5). This suggests that forebrain specific mitochondrial oxidative stress was sufficient to result in deficits in mitochondrial functions.
Figure 5.
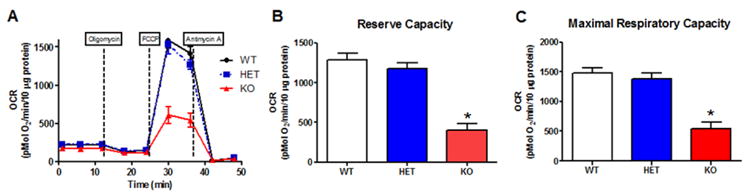
Conditional forebrain knockout of superoxide dismutase replicates mitochondrial dysfunction in TLE models. (A) Trace of average rates from WT (Sod2+/+NEX+/+), HET (Sod2+/flNEX+/Cre), and KO (Sod2fl/flNEXCre/Cre) mice (B) Reserve Capacity and (C) Maximal Respiratory Capacity *p< 0.05, by one-way ANOVA, n = 4 in each group.
Reactive Oxygen Species Drive Mitochondrial Dysfunction in Experimental TLE
We hypothesized that ROS may be causative in mitochondrial dysfunction occurring in both models of chemoconvulsant–induced epilepsy based on the 1) known ability of ROS to impair mitochondrial OCR (Dranka et al., 2010) and 2) the remarkable similarities in the temporal occurrence of ROS in our previous studies and OCR in the present studies. Therefore, we sought to determine if the mechanism of deficits in mitochondrial OCR and other indices occurs via ROS production.
We asked if increased ROS were necessary to result in mitochondrial dysfunction occurring in the KA model. To address this, we asked if pharmacologically scavenging ROS was capable of restoring hippocampal mitochondrial function in KA-treated animals. We utilized a water-soluble metalloporphyrin Mn(III)tetrakis(N,N'diethylimidizolium-2-yl)porphyrin (MnIIITDE-2-ImP5+) which possesses high rate constants for catalytic removal of superoxide, hydrogen peroxide, peroxynitrite and lipid peroxides (Day, 2004). The dosing regimen of this compound (5 mg/kg s.c. every 4h for the duration of the study) was selected based on its ability to cross the rat blood brain barrier (BBB) and achieve sufficient levels to exert its antioxidant effects. The logistics surrounding a drug dosing regimen which necessitated every 4h treatment confined our assessment of mitochondrial function to acute time points of 24h in the TLE model.
To determine the role of ROS production in causing the mitochondrial dysfunction revealed by extracellular flux analysis, we assessed mitochondrial function in KA-treated rats injected with saline or MnIIITDE-2-ImP5+. MnIIITDE-2-ImP5+ treatment attenuated maximal respiration and reserve capacity by ∼55% in the KA model (Figure 6). This effect was not due to MnIIITDE-2-ImP5+ interfering with severity of SE due to similar behavioral seizure racine scores (KA- MnIIITDE-2-ImP5+ = 4.306 +/- .09611, KAsaline = 4.368 +/- .1158) between the treated groups. The data indicates deficits in mitochondrial OCR and other indices of dysfunction in TLE models are driven at least in part by ROS production resulting in impaired mitochondrial consumption of oxygen to form ATP.
Figure 6.

MnIIITDE-2-ImP5+ attenuates mitochondrial respiration deficits in KA model. (A) Trace of average rates from control, KA, and KA-MnIIITDE-2-ImP5+ animals. (B) Reserve Capacity and (C) Maximal Respiratory Capacity *p< 0.05, #< 0.05 compared to KA alone by one-way ANOVA, n = 4-7 in each group.
Discussion
Two primary lines of evidence support ROS-dependent deficits in mitochondrial oxygen consumption in experimental models of TLE. First, deficits in mitochondrial respiration occurred in acute and chronic phases of injury-induced TLE. The temporal profile of mitochondrial respiration deficits are reminiscent of increased steady-state ROS levels shown previously in these models (Jarrett et al., 2008; Waldbaum et al., 2010; Ryan et al., 2012). Secondly, a role for ROS in mitochondrial respiration deficits in TLE models was supported by two findings. 1) Increased steady-state mitochondrial ROS in forebrain-specific conditional deletion of Sod2 was sufficient to cause profound deficits in mitochondrial respiration. 2) Pharmacological scavenging of ROS with a catalytic antioxidant restored mitochondrial respiration deficits in the KA model of TLE without interfering with initial SE. Together, these results demonstrate that mitochondrial respiration deficits occur in experimental TLE and ROS contribute to these deficits.
Mitochondria serve a variety of important functions but arguably the most crucial of these functions is the generation of ATP. Literature including work from our laboratory demonstrates changes in individual mitochondrial enzyme activities which may indirectly predict mitochondrial dysfunction (Kudin et al., 2002; Ryan et al., 2012). However, here we demonstrate impairment in oxygen consumption, a reliable measure of mitochondrial respiration and its mechanistic underpinning in TLE. We demonstrate detailed alterations in OXPHOS assessed by oxygen consumption using real-time extracellular flux analysis indicating mitochondrial dysfunction at different phases of experimental TLE. The novel methodology enabled the use of small amounts of protein from specific areas of the brain at various time-points during the epileptogenic process.
Synaptosomes provide an ideal and unique neuronal compartment for accurately assessing metabolism in intact animals at the time of euthanasia. Pre-synaptic nerve terminals are highly active regions that require large amounts of ATP for all processes involved in neurotransmission. A major advantage of synaptosomes for metabolic analyses is that they contain both cytosolic and mitochondrial machinery which allows measurement of glycolysis and mitochondrial respiration simultaneously. Synaptic dysfunction is increasingly being recognized as a contributor to neurodegenerative diseases (Selkoe, 2002; Beal, 2004). Choi et al. have validated synaptosomal extracellular flux analyses using the Seahorse XF24 methodology with conventional oxygen electrode respirometry (Choi et al., 2009). We modified this protocol for our in vivo studies with control and chemoconvulsant-treated rats to measure metabolism during the course of epileptogenesis in a specific enriched neuronal population. This procedure not only allowed us to show the difference in maximal OCR rates but also the reserve capacity of hippocampal synaptosome i.e. the difference between baseline and maximal respiration rates that is potentially needed for large ATP demands. Decreased baseline respiration in the acute phase suggests that seizure activity lowered overall metabolic state which mimics hypometabolism in interictal periods (Chugani et al., 1994). Decreased ATP-linked respiration in the acute and chronic phases suggests that electron transport during these periods is less efficient perhaps due to increased ROS or damage to proteins, lipids, mtDNA. Together with our previous observation of posttranslational inactivation of complex I during the acute and chronic phases (Ryan et al., 2012), it is likely that the combined damage to the electron transport chain contributes to increased ROS production and therefore, increased susceptibility to seizures. Decrease in overall ATP production during epileptogenesis can lead to failure of Na+/K+ ATPase and result in increased neuronal excitability (Grisar, 1984).
Our study revealed important temporal alterations in bioenergetic parameters. First, we identified a biphasic impairment of mitochondrial respiration occurring shortly after SE (acute time-point) and during chronic epilepsy but not during the latent phase. All animals in chronic time-points were confirmed epileptic by continuous video-monitoring. This temporal profile is strikingly similar to changes in indices of mitochondrial and redox processes such as H2O2 production, mitochondrial DNA damage, redox-sensitive inactivation of aconitase, complex I inactivation and oxidative post-translational modification via carbonylation of the 75 kDa subunit of complex I (Liang et al., 2000; Jarrett et al., 2008; Ryan et al., 2012). These changes in experimental TLE occur in a biphasic manner and coincide with periods following and/or accompanying seizure activity. Our data provide some of the first evidence for mitochondrial dysfunction in a chemoconvulsant animal model of TLE during different phases of epileptogenesis. Secondly, epileptic animals have less reserve capacity and therefore are not able to deal with the large ATP demand of repeated seizures which leads to increased oxidative stress and potentially neuronal excitability. While some studies have noted deficits in proteins or enzymes as a result of seizures (Kudin et al., 2004; Kann et al., 2005; Kovac et al., 2012), our methodology shows dysfunction in the ability of the mitochondria to respire and therefore produce ATP. This indicates that mitochondria are unable to respond to the increased ATP demand associated with seizure activity resulting in decreased respiration. Third, deficits in glycolytic capacity observed in the acute phase coincided with mitochondrial dysfunction. This is in agreement with acute decreases in glycolytic substrate utilization and rates reported in response to SE (Galella et al., 1983; Gasior et al., 2010). Since glycolytic rates remained unaltered in chronic time-points of epileptogenesis when mitochondrial respiration was decreased, it is likely that glycolysis serves as a major energy generating process in chronic epilepsy. Ongoing glycolytic flux in chronic epilepsy likely fuels mitochondrial ROS production by complex I deficiency leading to oxidative damage to key membrane proteins and mtDNA and increased neuronal hyperexcitability. Loading wells with equal amounts of total protein and assaying for mitochondrial protein in the synaptosomal pellets from both treated and control groups ensured that the changes we observe are due to actual dysfunction as opposed to a change in mitochondrial or overall protein.
We demonstrate that ROS drive metabolic deficits in experimental TLE. Although our study supports mitochondria as a source of seizure-induced ROS(Liang et al., 2000; Jarrett et al., 2008), a significant increase in ROS is also known to occur through the plasma membrane bound NADPH oxidase (Nox2)(Patel et al., 2005; Kovac et al., 2014). The source of ROS contributing to the metabolic deficits we observe is most likely mitochondrial in origin for several reasons. First, superoxide and hydrogen peroxide generated by Nox2 can be scavenged by overexpression of extracellular SOD (ECSOD, (Patel et al., 2005)). The presence of multiple cytosolic peroxide removal systems together with the distance needed for Nox-derived hydrogen peroxide to access mitochondrial OXPHOS machinery makes it an unlikely candidate to mediate mitochondrial dysfunction. Secondly, using mice overexpressing or deficient in Sod2 as well as the activity of mitochondrial aconitase we have previously shown that mitochondrial ROS contribute to seizure-induced neuronal damage(Liang et al., 2000). Increased steady ROS in Sod2 deficient mice not only exacerbated neuronal death but lowered seizure threshold in haplodeficient mice (Sod2-/+)(Liang and Patel, 2004) and produced epilepsy in homozygous knockout mice (Sod2-/-) (Liang et al., 2012). The latter studies involved partial or complete deletions of Sod2 in a global manner which may have been impacted by mitochondrial disease and involvement of multiple peripheral organs. Here, using forebrain specific knockout mice we determined that the deficits in mitochondrial respiration were indeed due to mitochondrial ROS. Finally, the role of ROS in mediating mitochondrial respiration deficits was verified by pharmacologically scavenging intracellular ROS using a catalytic antioxidant known to scavenge H2O2, lipid peroxides, and peroxynitrite (Day, 2004). Although the MnIIITDE-2-ImP5 does not specifically target mitochondrial ROS and given that SE increases ROS from multiple sources, we can conclude that scavenging ROS inhibits mitochondrial respiration deficits. Therefore, it is more likely that mitochondrial-generated ROS acts locally to exert effects on respiration. Nevertheless, a crosstalk between NADPH oxidase generated ROS and mitochondrial respiration is not unprecedented and therefore cannot be ruled out (Dikalov, 2011). The ability of MnIIITDE-2-ImP5+ to cross the BBB following systemic administration and achieve brain concentrations capable of neuroprotection in vitro allowed its use as a tool to determine the role of ROS in rats treated with KA. However, its relatively short plasma half-life necessitated injections every 4h precluding chronic administration (O’Neill et al., 2010). Together with the inability of MnIIITDE-2-ImP5+ to alter behavioral SE after KA treatment and its late administration post-KA, suggests that its effects were not due to interference with the initial SE.
The significance of mitochondrial respiration deficits in TLE remains to be fully understood. One possibility is that mitochondrial respiration deficits result in oxidative damage to cellular macromolecules, inflammation and neuronal loss. Neuronal loss and inflammation can in turn decrease seizure threshold and contribute to chronic epilepsy. Neuronal loss is also a known mediator of cognitive dysfunction, an important comorbidity of seizures in TLE (van Rijckevorsel, 2006). This is evident in Alzheimer disease where oxidative stress precedes cognitive deficits and seizures (Christen, 2000; García-Cabrero et al., 2013). Impaired electron transport and mitochondrial function can cause detrimental effects including depolarization of mitochondrial potential, increased ROS production, apoptosis, and impaired ATP. Metabolic changes that occur following acute or during chronic seizure activity such as heightened glycolytic rates (Galella et al., 1983) can potentially overwhelm mitochondrial OXPHOS leading to increased electron leak and ROS production, particularly under conditions of impaired complex I activity. The bioenergetic deficit caused by oxidative damage to sensitive targets involved in the control of neuronal excitability could lower seizure threshold in a vicious cyclic manner. Alternatively, low levels of ROS are known to play an important physiological role in cell signaling and can provide beneficial responses through mitohormesis for tissue adaptation to injury (Schmeisser et al., 2013; Yuyun et al., 2013). A global decrease of metabolic rates via ROS during periods of chronic seizure activity may provide long term benefits as ROS are known to have preconditioning effects via antioxidant and repair pathways (Jarrett et al., 2008; Friedman and Dingledine, 2011). Further studies are needed to fully clarify the precise role of impaired mitochondrial respiration in TLE. Our results suggest that mitochondrial dysfunction via ROS production is a novel process underlying TLE.
Highlights.
Mitochondrial respiration deficits occur in experimental TLE
Mitochondrial reserve capacity is decreased in experimental TLE
Reactive oxygen species drive deficits in mitochondrial respiration
Acknowledgments
This work is supported by NIH RO1NS039587(M.P.), NIH UO1NS083422 (M.P.), NIH 5 F31 NS077739-03 (S.R.). The authors wish to thank Drs. Yogendra Raol, Andrew White and the UCAMC In Vivo Neurophysiology and Pathology Core Facilities.
Footnotes
Conflict of Interest: B.J.D. holds equity and serves as a consultant for Aeolus Pharmaceuticals which is developing metalloporphyrins as therapeutics.
Publisher's Disclaimer: This is a PDF file of an unedited manuscript that has been accepted for publication. As a service to our customers we are providing this early version of the manuscript. The manuscript will undergo copyediting, typesetting, and review of the resulting proof before it is published in its final citable form. Please note that during the production process errors may be discovered which could affect the content, and all legal disclaimers that apply to the journal pertain.
References
- Beal MF. Mitochondrial dysfunction and oxidative damage in Alzheimer's and Parkinson's diseases and coenzyme Q10 as a potential treatment. J Bioenerg Biomembr. 2004;36:381–386. doi: 10.1023/B:JOBB.0000041772.74810.92. [DOI] [PubMed] [Google Scholar]
- Bough KJ, Wetherington J, Hassel B, Pare JF, Gawryluk JW, Greene JG, Shaw R, Smith Y, Geiger JD, Dingledine RJ. Mitochondrial biogenesis in the anticonvulsant mechanism of the ketogenic diet. Ann Neurol. 2006;60:223–235. doi: 10.1002/ana.20899. [DOI] [PubMed] [Google Scholar]
- Brand MD, Nicholls DG. Assessing mitochondrial dysfunction in cells. Biochem J. 2011;435:297–312. doi: 10.1042/BJ20110162. [DOI] [PMC free article] [PubMed] [Google Scholar]
- Castello PR, Drechsel DA, Day BJ, Patel M. Inhibition of Mitochondrial Hydrogen Peroxide Production by Lipophilic Metalloporphyrins. 2008;324:970–976. doi: 10.1124/jpet.107.132134. [DOI] [PMC free article] [PubMed] [Google Scholar]
- Choi SW, Gerencser Aa, Nicholls DG. Bioenergetic analysis of isolated cerebrocortical nerve terminals on a microgram scale: spare respiratory capacity and stochastic mitochondrial failure. J Neurochem. 2009;109:1179–1191. doi: 10.1111/j.1471-4159.2009.06055.x. [DOI] [PMC free article] [PubMed] [Google Scholar]
- Christen Y. Oxidative stress and Alzheimer disease. Am J Clin Nutr. 2000;71:621S–629S. doi: 10.1093/ajcn/71.2.621s. [DOI] [PubMed] [Google Scholar]
- Chugani HT, Rintahaka PJ, Shewmon DA. Ictal patterns of cerebral glucose utilization in children with epilepsy. Epilepsia. 1994;35:813–822. doi: 10.1111/j.1528-1157.1994.tb02517.x. [DOI] [PubMed] [Google Scholar]
- Day BJ. Catalytic antioxidants: a radical approach to new therapeutics. Drug Discov Today. 2004;9:557–566. doi: 10.1016/S1359-6446(04)03139-3. [DOI] [PubMed] [Google Scholar]
- Delgado-Escueta AV, Wilson WA, Olsen RW, Porter RJ. New waves of research in the epilepsies: crossing into the third millennium. Adv Neurol. 1999;79:3–58. [PubMed] [Google Scholar]
- Dikalov S. Cross talk between mitochondria and NADPH oxidases. Free Radic Biol Med. 2011;51:1289–1301. doi: 10.1016/j.freeradbiomed.2011.06.033. [DOI] [PMC free article] [PubMed] [Google Scholar]
- Dranka BP, Hill BG, Darley-Usmar VM. Mitochondrial reserve capacity in endothelial cells: The impact of nitric oxide and reactive oxygen species. Free Radic Biol Med. 2010;48:905–914. doi: 10.1016/j.freeradbiomed.2010.01.015. [DOI] [PMC free article] [PubMed] [Google Scholar]
- Dunkley PR, Jarvie PE, Robinson PJ. A rapid Percoll gradient procedure for preparation of synaptosomes. Nat Protoc. 2008;3:1718–1728. doi: 10.1038/nprot.2008.171. [DOI] [PubMed] [Google Scholar]
- Friedman A, Dingledine R. Molecular cascades that mediate the influence of inflammation on epilepsy. Epilepsia. 2011;52(Suppl 3):33–39. doi: 10.1111/j.1528-1167.2011.03034.x. [DOI] [PMC free article] [PubMed] [Google Scholar]
- Galella G, Turano C, Girvin J. Metabolic changes in the hippocampus after prolonged epileptic discharge. J Neurosurg Sci. 1983;27:69–71. [PubMed] [Google Scholar]
- García-Cabrero AM, Guerrero-López R, Giráldez BG, Llorens-Martín M, Avila J, Serratosa JM, Sánchez MP. Hyperexcitability and epileptic seizures in a model of frontotemporal dementia. Neurobiol Dis. 2013;58:200–208. doi: 10.1016/j.nbd.2013.06.005. [DOI] [PubMed] [Google Scholar]
- Gasior M, Yankura J, Hartman AL, French A, Rogawski MA. Anticonvulsant and proconvulsant actions of 2-deoxy-D-glucose. Epilepsia. 2010;51:1385–1394. doi: 10.1111/j.1528-1167.2010.02593.x. [DOI] [PubMed] [Google Scholar]
- Goebbels S, Bormuth I, Bode U, Hermanson O, Schwab MH. Genetic Targeting of Principal Neurons in Neocortex and Hippocampus of NEX-Cre Mice. 2006;621:611–621. doi: 10.1002/dvg.20256. [DOI] [PubMed] [Google Scholar]
- Grisar T. Glial and neuronal Na+-K+ pump in epilepsy. Ann Neurol. 1984;16 Suppl:S128–S134. doi: 10.1002/ana.410160719. [DOI] [PubMed] [Google Scholar]
- Ikegami T, Suzuki Y, Shimizu T, Isono K, Koseki H, Shirasawa T. Model mice for tissue-specific deletion of the manganese superoxide dismutase (MnSOD) gene. Biochem Biophys Res Commun. 2002;296:729–736. doi: 10.1016/s0006-291x(02)00933-6. [DOI] [PubMed] [Google Scholar]
- Jarrett SG, Liang LP, Hellier JL, Staley KJ, Patel M. Mitochondrial DNA damage and impaired base excision repair during epileptogenesis. Neurobiol Dis. 2008;30:130–138. doi: 10.1016/j.nbd.2007.12.009. [DOI] [PMC free article] [PubMed] [Google Scholar]
- Kann O, Kovács R, Njunting M, Behrens CJ, Otáhal J, Lehmann TN, Gabriel S, Heinemann U. Metabolic dysfunction during neuronal activation in the ex vivo hippocampus from chronic epileptic rats and humans. Brain. 2005;128:2396–2407. doi: 10.1093/brain/awh568. [DOI] [PubMed] [Google Scholar]
- Kovac S, Domijan AM, Walker MC, Abramov AY. Prolonged seizure activity impairs mitochondrial bioenergetics and induces cell death. J Cell Sci. 2012;125:1796–1806. doi: 10.1242/jcs.099176. [DOI] [PMC free article] [PubMed] [Google Scholar]
- Kovac S, Domijan AM, Walker MC, Abramov AY. Seizure activity results in calcium- and mitochondria-independent ROS production via NADPH and xanthine oxidase activation. Cell Death Dis. 2014;5:e1442. doi: 10.1038/cddis.2014.390. [DOI] [PMC free article] [PubMed] [Google Scholar]
- Kudin AP, Bimpong-Buta NYB, Vielhaber S, Elger CE, Kunz WS. Characterization of superoxide-producing sites in isolated brain mitochondria. J Biol Chem. 2004;279:4127–4135. doi: 10.1074/jbc.M310341200. [DOI] [PubMed] [Google Scholar]
- Kudin AP, Kudina TA, Seyfried J, Vielhaber S, Beck H, Elger CE, Kunz WS. Seizure-dependent modulation of mitochondrial oxidative phosphorylation in rat hippocampus. Eur J Neurosci. 2002;15:1105–1114. doi: 10.1046/j.1460-9568.2002.01947.x. [DOI] [PubMed] [Google Scholar]
- Kunz WS, Kudin AP, Vielhaber S, Blümcke I, Zuschratter W, Schramm J, Beck H, Elger CE. Mitochondrial complex I deficiency in the epileptic focus of patients with temporal lobe epilepsy. Ann Neurol. 2000;48:766–773. [PubMed] [Google Scholar]
- Lee EM, Park GY, Im KC, Kim ST, Woo CW, Chung JH, Kim KS, Kim JS, Shon YM, Kim YI, Kang JK. Changes in glucose metabolism and metabolites during the epileptogenic process in the lithium-pilocarpine model of epilepsy. Epilepsia. 2012;53:860–869. doi: 10.1111/j.1528-1167.2012.03432.x. [DOI] [PubMed] [Google Scholar]
- Lian XY, Khan FA, Stringer JL. Fructose-1,6-bisphosphate has anticonvulsant activity in models of acute seizures in adult rats. J Neurosci. 2007;27:12007–12011. doi: 10.1523/JNEUROSCI.3163-07.2007. [DOI] [PMC free article] [PubMed] [Google Scholar]
- Liang LP, Ho YS, Patel M. Mitochondrial superoxide production in kainate-induced hippocampal damage. Neuroscience. 2000;101:563–570. doi: 10.1016/s0306-4522(00)00397-3. [DOI] [PubMed] [Google Scholar]
- Liang LP, Patel M. Mitochondrial oxidative stress and increased seizure susceptibility in Sod2(-/+) mice. Free Radic Biol Med. 2004;36:542–554. doi: 10.1016/j.freeradbiomed.2003.11.029. [DOI] [PubMed] [Google Scholar]
- Liang LP, Waldbaum S, Rowley S, Huang TT, Day BJ, Patel M. Mitochondrial oxidative stress and epilepsy in SOD2 deficient mice: attenuation by a lipophilic metalloporphyrin. Neurobiol Dis. 2012;45:1068–1076. doi: 10.1016/j.nbd.2011.12.025. [DOI] [PMC free article] [PubMed] [Google Scholar]
- Mecocci P, MacGarvey U, Kaufman AE, Koontz D, Shoffner JM, Wallace DC, Beal MF. Oxidative damage to mitochondrial DNA shows marked age-dependent increases in human brain. Ann Neurol. 1993;34:609–616. doi: 10.1002/ana.410340416. [DOI] [PubMed] [Google Scholar]
- O’Neill HC, White CW, Veress LA, Hendry-Hofer TB, Loader JE, Min E, Huang J, Rancourt RC, Day BJ. Treatment with the catalytic metalloporphyrin AEOL 10150 reduces inflammation and oxidative stress due to inhalation of the sulfur mustard analog 2-chloroethyl ethyl sulfide. Free Radic Biol Med. 2010;48:1188–1196. doi: 10.1016/j.freeradbiomed.2010.01.039. [DOI] [PMC free article] [PubMed] [Google Scholar]
- Patel M, Li QY, Chang LY, Crapo J, Liang LP. Activation of NADPH oxidase and extracellular superoxide production in seizure-induced hippocampal damage. J Neurochem. 2005;92:123–131. doi: 10.1111/j.1471-4159.2004.02838.x. [DOI] [PubMed] [Google Scholar]
- Pollard H, Charriaut-Marlangue C, Cantagrel S, Represa A, Robain O, Moreau J, Ben-Ari Y. Kainate-induced apoptotic cell death in hippocampal neurons. Neuroscience. 1994;63:7–18. doi: 10.1016/0306-4522(94)90003-5. [DOI] [PubMed] [Google Scholar]
- Rahman S. Mitochondrial disease and epilepsy. Dev Med Child Neurol. 2012;54:397–406. doi: 10.1111/j.1469-8749.2011.04214.x. [DOI] [PubMed] [Google Scholar]
- Rowley S, Patel M. Mitochondrial involvement and oxidative stress in temporal lobe epilepsy. Free Radic Biol Med. 2013;62:121–131. doi: 10.1016/j.freeradbiomed.2013.02.002. [DOI] [PMC free article] [PubMed] [Google Scholar]
- Ryan K, Backos DS, Reigan P, Patel M. Post-Translational Oxidative Modification and Inactivation of Mitochondrial Complex I in Epileptogenesis. J Neurosci. 2012;32:11250–11258. doi: 10.1523/JNEUROSCI.0907-12.2012. [DOI] [PMC free article] [PubMed] [Google Scholar]
- Ryan K, Liang LP, Rivard C, Patel M. Temporal and spatial increase of reactive nitrogen species in the kainate model of temporal lobe epilepsy. Neurobiol Dis. 2013;64C:8–15. doi: 10.1016/j.nbd.2013.12.006. [DOI] [PMC free article] [PubMed] [Google Scholar]
- Schmeisser S, Priebe S, Groth M, Monajembashi S, Hemmerich P, Guthke R, Platzer M, Ristow M. Neuronal ROS signaling rather than AMPK/sirtuin-mediated energy sensing links dietary restriction to lifespan extension. Mol Metab. 2013;2:92–102. doi: 10.1016/j.molmet.2013.02.002. [DOI] [PMC free article] [PubMed] [Google Scholar]
- Selkoe DJ. Alzheimer's disease is a synaptic failure. Science. 2002;298:789–791. doi: 10.1126/science.1074069. [DOI] [PubMed] [Google Scholar]
- Stafstrom CE, Ockuly JC, Murphree L, Valley MT, Roopra A, Sutula TP. Anticonvulsant and antiepileptic actions of 2-deoxy-D-glucose in epilepsy models. Ann Neurol. 2009;65:435–447. doi: 10.1002/ana.21603. [DOI] [PMC free article] [PubMed] [Google Scholar]
- Van Rijckevorsel K. Cognitive problems related to epilepsy syndromes, especially malignant epilepsies. Seizure. 2006;15:227–234. doi: 10.1016/j.seizure.2006.02.019. [DOI] [PubMed] [Google Scholar]
- Vielhaber S, Niessen HG, Debska-Vielhaber G, Kudin AP, Wellmer J, Kaufmann J, Schönfeld MA, Fendrich R, Willker W, Leibfritz D, Schramm J, Elger CE, Heinze HJ, Kunz WS. Subfieldspecific loss of hippocampal N-acetyl aspartate in temporal lobe epilepsy. Epilepsia. 2008;49:40–50. doi: 10.1111/j.1528-1167.2007.01280.x. [DOI] [PubMed] [Google Scholar]
- Waldbaum S, Liang LP, Patel M. Persistent impairment of mitochondrial and tissue redox status during lithium-pilocarpine-induced epileptogenesis. J Neurochem. 2010;115:1172–1182. doi: 10.1111/j.1471-4159.2010.07013.x. [DOI] [PMC free article] [PubMed] [Google Scholar]
- Wallace DC, Zheng XX, Lott MT, Shoffner JM, Hodge Ja, Kelley RI, Epstein CM, Hopkins LC. Familial mitochondrial encephalomyopathy (MERRF): genetic, pathophysiological, and biochemical characterization of a mitochondrial DNA disease. Cell. 1988;55:601–610. doi: 10.1016/0092-8674(88)90218-8. [DOI] [PubMed] [Google Scholar]
- Yuyun X, Jinjun Q, Minfang X, Jing Q, Juan X, Rui M, Li Z, Jing G. Effects of Low Concentrations of Rotenone upon Mitohormesis in SH-SY5Y Cells. Dose Response. 2013;11:270–280. doi: 10.2203/dose-response.12-005.Gao. [DOI] [PMC free article] [PubMed] [Google Scholar]