

Abstract
Objective
The field of retinal prosthetics for artificial vision has advanced considerably in recent years, however clinical outcomes remain inconsistent. The performance of retinal prostheses is likely limited by the inability of electrical stimuli to preferentially activate different types of retinal ganglion cell (RGC).
Approach
Here we examine the response of rabbit RGCs to high-frequency stimulation, using biphasic pulses applied at 2000 pulses per second. Responses were recorded using cell-attached patch clamp methods, and stimulation was applied epiretinally via a small cone electrode.
Results
When prolonged stimulus trains were applied to OFF-Brisk Transient (BT) RGCs, the cells exhibited a non-monotonic relationship between response strength and stimulus amplitude; this response pattern was different from those elicited previously by other electrical stimuli. When the amplitude of the stimulus was modulated transiently from a non-zero baseline amplitude, ON-BT and OFF-BT cells exhibited different activity patterns: ON cells showed an increase in activity while OFF cells exhibited a decrease in activity. Using a different envelope to modulate the amplitude of the stimulus, we observed the opposite effect: ON cells exhibited a decrease in activity while OFF cells show an increase in activity.
Significance
As ON and OFF RGCs often exhibit opposing activity patterns in response to light stimulation, this work suggests that high-frequency electrical stimulation of RGCs may be able to elicit responses that are more physiological than traditional pulsatile stimuli. Additionally, the prospect of an electrical stimulus capable of cell-type specific selective activation has broad applications throughout the fields of neural stimulation and neuroprostheses.
Keywords: Retinal prosthesis, Electric stimulation, Retinal ganglion cells, High frequency, ON and OFF
1. Introduction
Outer retinal degenerative diseases such as age-related macular degeneration (AMD) and retinitis pigmentosa (RP), affect the vision of over a million people in the United States [1, 2] and many more worldwide [3, 4]. These diseases target the outer retina and typically result in the loss of function of the light-sensitive photoreceptors, thereby decreasing the light responsiveness of the eye. Retinal ganglion cells (RGCs), the output neurons of the retina, as well as other neurons in the inner retina, are thought to survive the degenerative process and therefore provide a target for electrical stimulation arising from implanted microelectronic retinal prostheses.
There has been considerable progress in the field over the last decade and several clinical trials of retinal prosthetic devices are currently underway, both in the US and Europe [5]. Patients in these studies reliably report visual percepts arising from stimulation, and some have even been able to perform simple tasks such as identifying household objects, performing limited navigation, and reading simple words [6-8]. While this progress is highly encouraging, many aspects of overall performance remain somewhat limited. For example, even the fastest reading rates were restricted to only a few words per minute, and the average rate across all subjects was much slower [9].
Although it is not entirely clear why device performance is limited, one likely factor is the use of suboptimal stimulation methods. For example, the acuity of normal vision is typically quite high because tightly-packed RGCs, especially in the fovea, each extract information from only a narrow portion of visual space. In contrast, the diameter of stimulating electrodes used in existing implanted devices can be up to 200 μm [10]. As a result, each electrode can stimulate tens or even hundreds of RGCs, thereby greatly reducing resolution. Much effort is underway to develop higher electrode counts with increased resolution, but these new devices may face additional challenges. The mammalian retina contains at least twelve different types of RGCs [11-14]; each type extracts different features of the visual world and transmits this information to higher visual centers using distinct patterns of spiking [15-17]. Due to the close proximity of different RGCs to one another, stimulation from any given electrode is likely to elicit similar spiking patterns in multiple RGC types, thereby sending a signal to the brain that is non-physiological. New stimulation methods that could provide more precise control over elicited neural activity, e.g. preferential targeting of specific RGC types, would bring the elicited retinal response more in line with physiological retinal output, and presumably lead to better clinical outcomes.
Recent work has shown some progress toward selective activation of RGC types. For example, Eickenscheidt et. al. used a multicapacitor array to hyperpolarize photoreceptor terminals, mimicking the physiological ON retinal response [18]. However, targeting of photoreceptor terminals may limit the utility of such an approach due to photoreceptor degeneration in most patients that will be candidates for retinal prostheses. Similarly, Freeman et. al. was able to create differential responses in ON and OFF cells using sinusoidal stimulation [19]. They too surmised that the ON/OFF differences were the result of photoreceptor activation (again limiting the utility of their approach). Jensen and Rizzo found that ON cell populations in rabbit retina have lower stimulus thresholds than OFF cells in response to monophasic cathodal stimuli applied subretinally [20]. These results did not extend to rouse retina however [21], raising questions as to its suitability for clinical use. While selective activation of RGC types using optogenetic methods has been explored [22, 23], no method to preferentially activate RGC types via direct electrical stimulation has yet been reported.
High-frequency stimulation (HFS, > 1 kHz) has been used in neural prosthetic applications for years, most notably in cochlear prosthetics [24-27]. In addition when applied to the peripheral nervous system, HFS can induce a conduction block that prevents transmission of action potentials for the duration of the stimulus [28-33]. Recently, it has been shown that when high-frequency pulse trains are applied to a peripheral axon bundle, the amplitude and frequency can be tuned to induce a selective conduction block in certain fibers: relatively low stimulation rates selectively blocked activity in myelinated fibers while non-myelinated fibers were unaffected, while relatively high stimulation rates did the opposite – blocking activity in non-myelinated fibers while leaving myelinated fibers unaffected [34]. The mechanism through which the block occurs, as well as the reasons for its sensitivity to the rate of stimulation, both remain unknown, although theories involving activation and/or inactivation of several different ion channels have been proposed [35, 36]. Importantly, however, this work raises the possibility that HFS could selectively activate different types of neurons in the central nervous system as well.
Here we examined the response of RGCs to electrical stimulation applied at 2000 pulses per second (PPS). We found that for trains of 2000 PPS applied at constant amplitude, there was a non-monotonic relationship between the amplitude of the stimulus and the strength of the response; this differs from the response patterns of previously examined electrical stimuli. Additionally, we found that amplitude modulation of the stimulus could be used to preferentially activate certain RGC types: an identical stimulus produced an increase in activity in one cell-type while producing a decrease in activity in a different cell-type. This serves as the first instance in which an electrical stimulus has produced different responses in two different cell-types in the retina.
2. Methods
2.1. Animal preparation and retina isolation
The care and use of animals followed all federal and institutional guidelines and all protocols were approved by the Institutional Animal Care and Use Committees of the Boston VA Healthcare System and/or the Subcommittee of Research Animal Care of the Massachusetts General Hospital. Female New Zealand white rabbits (∼2.5 kg) were anesthetized with injections of xylazine/ketamine and subsequently euthanized with an intracardial injection of sodium pentobarbital. Immediately after death, the eyes were removed. All procedures following eye removal were performed under dim red illumination. The front of the eye was removed, the vitreous was eliminated, and the eye cup dissected so that the retina could be flattened. The retina was separated from the retinal pigment epithelium and mounted, photoreceptor side down, to a 10-mm square piece of Millipore filter paper (0.45 μm HA Membrane Filter) that was mounted with vacuum grease to the recording chamber (∼1.0 ml volume). A 2 mm circle in the center of the Millipore paper allowed light from below to be projected on to the photoreceptors.
2.2. Electrophysiology and Light responses
Patch pipettes were used to make small holes in the inner limiting membrane and ganglion cells were targeted under visual control. Spiking was recorded with a cell-attached patch electrode (8–12 MΩ), filled with Ames medium (Sigma Aldrich, A1420). Two silver-chloride coated silver wires served as the ground and were positioned at opposite edges of the recording chamber each ∼15 mm from the targeted cell.
The light stimulus and data acquisition software was controlled by custom software written in Lab View (National Instruments) and Matlab (Mathworks) and written by G. Spor, T. Muench, and D. Balya. The electric stimulation software was written by D. Freeman and M. Im. The sampling rate of the data acquisition setup was 100 kHz, and the time resolution of the stimulus generator was 50 kHz. Light stimuli were projected onto the retina from below through a liquid crystal display projector (Dell) and focused onto the outer segments of the photoreceptors. A photopic background intensity was maintained throughout the experiment (∼4 nW/m2)[13]. Light stimuli consisted of stationary flashed squares (size range: 100–1,000 μm), 1 s duration, centered at the soma. Cells were classified as brisk transient (BT) if they responded with high-frequency and transient bursts of spiking to stimuli centered in their receptive field [12, 13, 37]. Consistent with previous reports, responses were largest for larger squares (> 500 μm) and were small or nonexistent for small squares (≤100 μm). We found both ON and OFF varieties of these cells. All cells used in this study were either ON-BT or OFF-BT, but are sometimes referred to simply as ON or OFF.
In order to determine the origin of stimulated activity, excitatory glutamatergic synaptic input from bipolar cells was blocked in some experiments using CNQX (6-cyano-7-nitroquinoxaline-2,3-dione, 50 μM) and AP-7 (DL-2-amino-7-phosphonoheptanoic acid,100 μM). Synaptic blockage was confirmed by the absence of light elicited responses.
2.3. Electric Stimulation
Electric stimulation was delivered via a 10 kΩ Platinum-Iridium electrode (MicroProbes); the exposed area was conical with an approximate height of 125 μm and base diameter of 15 μm, giving a surface area of ∼5,900 μm2, comparable to the area of a 40 μm disk electrode. The height of the stimulating electrode remained fixed 25 μm above the inner limiting membrane; the distance was calibrated by touching the surface of the inner limiting membrane with the tip of the electrode and then using the micromanipulator to raise the height by 25 μm. Two silver chloride-coated silver wires served as the return; each was positioned ∼8 mm from the targeted cell and ∼12 mm from one another. Pulse stimuli were controlled by Multi-Channel Systems STG2004 hardware and software. The stimulating electrode was centered over the axon initial segment (AIS) on the proximal axon: this band of high-density sodium channels has been shown to correspond to the center of the region with the lowest threshold, and is generally located between 20 and 60 μm from the soma along the proximal axon [38-40]. Using an iterative process, we were able to quickly find the center of the low-threshold region; movement of the stimulating electrode towards the center of the low-threshold region resulted in decreasing thresholds while movement away from the center resulted in increasing thresholds. The stimulus used during this process was a 100 μs biphasic pulse applied at 10 PPS. We used this location as the approximate center of the sodium-channel band.
Pulsatile stimuli were biphasic pulses (equal and opposite rectangular phases, cathodal first) delivered at rates of 2000 PPS. Cathodal and anodal phase durations were 100 μs each. Cathodal-anodal inter-pulse interval (IPI) was 160 μs, while anodal-cathodal IPI was 140 μs. This asymmetry was necessary due to the minimum resolution of the stimulation hardware. For constant amplitude 2000 PPS application, the stimulus was applied for 5 seconds. This was repeated for a minimum of 3 trials per cell, with at least one minute between trials. For experiments in which the stimulus amplitude was modulated, the 2000 PPS pulse train was multiplied with a diamond shaped envelope; the resulting patterns referred to as “diamonds”. The diamonds were 300 ms in duration, consisting of a 150 ms rise to peak amplitude level followed by a symmetrical 150 ms return to baseline. We refer to these waveforms as “zero baseline” if the baseline amplitude was 0 (Figure 1a), or “non-zero baseline” (Figure 1b) if there was a non-zero baseline amplitude. For the non-zero baseline condition, baseline and peak amplitudes were varied independently, and ranged from 0 – 100 uA. Experiments consisted of 5 diamond repeats, with a 1 second interval between the end of one diamond and the beginning of the next, during which baseline amplitude (non-zero) was maintained. This was duplicated for 3 trials, for a total of 15 repeats per cell.
Figure 1.
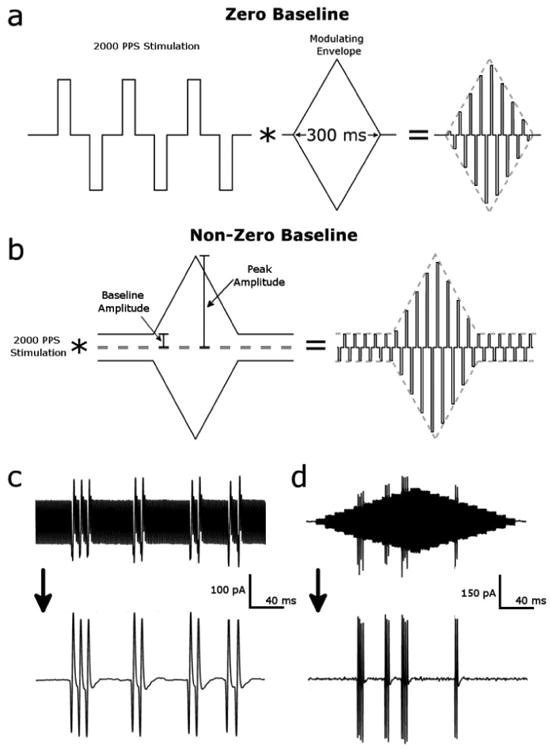
Stimulus waveforms and artifact removal. (a) Stimulus waveform (zero baseline) was developed by multiplying a 2000 PPS stimulus pattern (100 μs biphasic, 160 μs cathodal-anodal inter-phase interval, 140 μs anodal-cathodal inter-phase interval) with a 300 ms wide amplitude modulation “diamond”; the diamond had symmetric rising and falling phases. Baseline amplitude for this waveform was 0 μA and the peak amplitude of the diamond ranged from 20 to 100 μA (b) Stimulus waveform with non-zero baseline. Baseline amplitude and peak amplitude vary independently between 20 and 100 μA (c) Stimulus artifact removal verification. Spikes can be seen embedded within the stimulus artifact (top) during a 20 uA constant amplitude 2000 PPS stimulus. Removal of the artifact via notch filter reveals the spikes in greater detail (bottom) (d) Artifact removal applied to a 40 uA diamond reveals spikes embedded within the signal.
The stimulus produced a strong electrical artifact in the response (Figure 1c, top). To remove this artifact, the response was converted to the frequency domain, where the primary frequency (2 kHz) and the first 25 harmonics were removed via a notch filter. The response was then converted back into the time domain: the signal-to-noise ratio of action potentials was then large enough to facilitate simple threshold detection (Figure 1c and d, bottom). All processing was performed in Matlab.
3. Results
3.1. Constant Amplitude 2000 PPS Stimulation
We measured the response to 5 second trains of 2000 PPS stimulation in OFF-Brisk Transient (BT) cells. The amplitude of the train remained constant within a given trial, but across trials ranged from 20 to 100 μA. Figure 2a shows spike raster plots from a typical OFF-BT cell in response to such trains. Each vertical line represents a single elicited action potential. At 20 μA, the stimulus typically produced very few spikes (top row), but as amplitude increased up to 60 μA, the number of elicited spikes increased substantially. Interestingly, as amplitude increased further (80-100 μA), the number of elicited spikes decreased, creating a nonmonotonic response profile. We counted the total number of spikes elicited over the full 5 second pulse train at each amplitude and plotted the total as a function of amplitude, averaged over all OFF-BT cells (n = 7) (Figure 2b).
Figure 2.

Response of OFF-BT RGCs to 2000 PPS stimuli is reduced at high amplitudes. (a) Spike raster plots of an OFF-BT cell in response to 5 second trains of 2000 PPS stimulation; each row is the response to a pulse train at a different amplitude level (indicated at left). All responses are from the same cell. Shaded area indicates the initial 250 ms of the response (see panel c). (b) Total number of spikes across 5 second trials as a function of stimulus amplitude, averaged over all cells (n = 7). (c) Total number of spikes elicited during the initial 250 ms of the stimulus, averaged over all cells. Error bars indicate ± standard deviation.
The initial portions (∼250 ms) of the elicited responses were generally strong at all amplitude levels (shaded region in Figure 2a); this raises the possibility that the pattern observed in Figure 2b may be dependent on the interval over which spikes were counted. To explore this, we counted the number of spikes that occurred within the first 250 ms of stimulus onset, and similarly plotted this count as a function of stimulus amplitude (Figure 2c). Unlike the total number of spikes elicited in the full 5 second interval, the number of spikes elicited in this initial phase plateaued at about 40 μA, i.e. further increases in stimulus amplitude did not generate significant changes in the number of elicited spikes. These findings therefore suggest that short, transient increases in the amplitude of stimulation can elicit robust spiking, but that prolonged trains of 2000 PPS may have a suppressive effect, especially at higher amplitudes.
3.2. Zero Baseline Amplitude Modulation
Artificial stimuli used in laboratory experiments (large, instantaneous changes in luminance) often do not correlate well with luminance changes seen in the natural environment [41, 42]; natural luminance changes generally occur more gradually over time rather than as step changes. Because of this, instantaneous changes in stimulus amplitude may not accurately mimic natural retinal input. In an effort to utilize stimuli that are able to more accurately recreate natural activity patterns, we decided to test gradual, transient changes in stimulus amplitude rather than large instantaneous changes. Additionally, we shortened the duration of the stimuli from 5 seconds to 300 ms, closer to the time-scale of typical natural retinal activity. Stimulus trains were created by multiplying a 2000 PPS constant-amplitude train with a diamond-shaped modulating envelope (Figure 1a) – the envelope consisted of a linear rise to peak amplitude that occurred over 150 ms followed by a symmetric return to 0 μA. We refer to these transient changes in amplitude as “diamonds”.
Diamonds with peak amplitude of 20, 40, 60, 80, and 100 μA were applied to OFF-BT cells; Figure 3a illustrates the response histograms arising in a typical cell. Each diamond elicited a transient burst of spikes whose strength varied with the amplitude of stimulation. To facilitate comparison of the response differences across amplitude, we represented each histogram as a line plot – the points of the line were taken as the height of each bin (see inset, Figure 3a – 40 μA) (plotted lines represent the average of all cells, n = 6). The maximum spike rate of the response generally increased with the diamond amplitude up to about 60 μA, after which further increases in stimulus amplitude had little effect on the peak response level. Similar measurements were made in ON-BT cells (Figure 3b right, n = 6), and responses appeared qualitatively similar to those from OFF cells. To further examine the response similarity across cell-types, we calculated the peak spike rate as a function of stimulus amplitude (panel c), as well as the total number of spikes elicited at each amplitude (panel d) – although OFF-BT cells elicited slightly more spiking than ON cells in both metrics, the responses at all amplitudes were not significantly different. The relationship of time to peak spike rate vs. stimulus amplitude was also examined (not shown) and found to be identical between cell-types (it is likely that slight differences would have been present if a smaller bin size had been used). Thus, the results associated with Figure 3 suggest that transient, amplitude-varying trains of 2000 PPS stimulation can elicit robust spiking in both ON and OFF RGCs, and that responses will be highly similar in both types.
Figure 3.
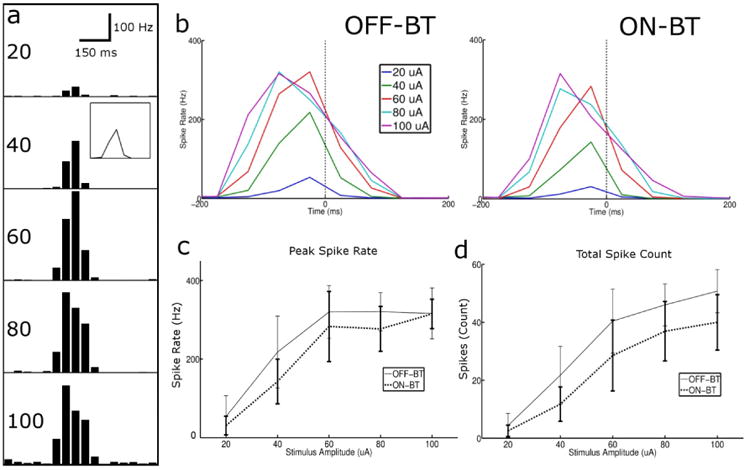
Amplitude modulation of 2000 PPS stimulation produces similar responses in ON and OFF-BT cells. (a) Response from a single OFF-BT cell to diamond-shaped modulating waveforms with peak amplitudes ranging from 20-100 μA. For each amplitude level, the response histogram is shown, averaged over all repeats. Bin size was 50 ms. Inset in the 40 μA box shows the same data presented as a line plot (b) Average response histogram (line plot) for each stimulus amplitude averaged over all OFF-BT (left) and ON-BT (right) cells (c) Total number of elicited spikes as a function of peak amplitude for ON and OFF cell populations (d) Peak spike rate vs. stimulus amplitude. Error bars indicate ± SD.
3.3. Non-zero Baseline Amplitude Modulation
In the experiments with 5 second persistent (constant-amplitude) trains (Figure 2), all cells exhibited a strong burst of spiking for the first ∼250 ms, even when the total number of spikes was low (i.e. Figure 2a, 80 μA). Because the zero baseline stimuli diamonds last for only 300 ms, we reasoned that the responses seen in Figure 3 primarily represent this initial response. Because responses appear to be suppressed during the latter portions of the persistent trains (after the initial response), we questioned whether the simultaneous application of constant baseline stimulation with the diamond transients would influence the elicited activity.
Figure 4a (top panel) demonstrates the stimulus waveform used (referred to as non-zero baseline amplitude-modulated trains, Figure 1b). The amplitude of the pulse train was held constant at 40 μA (referred to as baseline), except for 300 ms periods during which it increased to 60 μA over the first 150 ms and returned to baseline over the next 150 ms (again referred to as “diamonds”). There was a 1 second delay between the end of one diamond and the beginning of the next, during which baseline amplitude was maintained. The shaded vertical bars indicate the extent of the 300 ms diamond, and are used to correlate the timing of the stimulus to features of the response. The response histogram from a single ON-BT cell is shown in the middle panel. Although there was some variability in both the level of background spiking as well as the peak levels that occurred during a diamond, the responses were qualitatively similar in all ON-BT cells: the rate of elicited spiking increased during the diamond-shaped modulation and returned to the background level as soon as the diamond was complete. The average response for all ON BT cells tested (n = 7) is shown in Figure 4b (middle panel).
Figure 4.
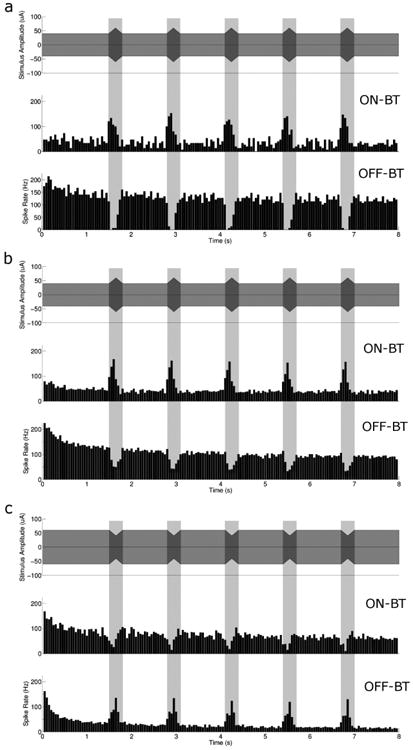
Non-zero baseline amplitude modulated 2000 PPS stimulus produces differential responses in ON vs. OFF-BT cells. (a) (top) Schematic representation of a 2000 PPS modulating envelope with a baseline level of 40 μA and peak amplitude of 60 μA. Response histograms are shown for a single ON-BT (middle) and OFF-BT cell (bottom) (b) Population results for a modulating envelope with a baseline of 40 μA and a peak of 60 μA (top), for ON-BT (middle) and OFF-BT (bottom) responses. (c) Population results for a modulating envelope with a baseline of 60 μA and a peak (decrease) of 40 μA (top), for ON-BT and OFF-BT responses. All histograms have a bin size of 50 ms.
We applied the identical stimulus to OFF-BT cells as well and found a surprising difference in the response pattern (Fig. 4a, bottom panel): instead of spiking increasing during the diamond-shaped modulation, the rate of spiking decreased. Similar to the responses from ON-BT cells, the levels of both peak and background spiking varied across OFF-BT cell responses, but the patterns were qualitatively similar across all cells tested. The average histogram for all OFF BT cells (n = 7) is shown in Figure 4b (bottom panel).
One of the factors that may contribute to the differential response is the difference in spiking levels between the two cell-types during the baseline stimulation periods: OFF-BT cells exhibited a much higher level of baseline spiking than did ON-BT cells, however the diamonds still drove this activity in opposite directions in the two cell-types. The response differences exhibited by ON and OFF cells are qualitatively similar to the response differences exhibited by the two cell-types in response to a light stimulus: at the onset of a luminance increase there is a sharp transient increase in the number of spikes generated by ON-BT cells, while there is a decrease in background spiking or no response in OFF-BT cells.
To further explore the ability of amplitude-modulated high-rate pulse trains to generate differential responses, we reversed the amplitude levels of the baseline and the modulation peak; baseline was fixed at 60 μA while the “peak” level became a reduction in amplitude to 40 μA (illustrated schematically in Figure 4c, top). The inverted stimulus elicited the opposite response: there was a decrease in ON cell activity (middle; n = 6) and an increase in OFF cell response (bottom; n = 6). The decrease in spiking in ON-BT cells with a corresponding increase in spiking in OFF-BT cells is analogous of the physiological response to a luminance decrease.
4. Discussion
The most significant finding of this study is the demonstration that ON and OFF-BT cells can be differentially activated. In response to a 2000 PPS stimulus with baseline amplitude of 40 μA and peak amplitude of 60 μA, ON-BT cells exhibited a transient increase in activity during each diamond, while OFF-BT cells exhibited a transient decrease in activity. For a different stimulus train (baseline of 60 μA and a peak of 40 μA), the opposite was true: OFF cells showed an increase in activity while ON cells showed a decrease in activity. Thus this finding has two important implications for neural stimulation and retinal prosthetics. First, the fact that a stimulus can generate an increase in spiking in ON cells and a decrease in OFF cells (or vice-versa with a different stimulus train) suggests that it may be possible to use such a stimulus to elicit spiking patterns in the retina that more closely resemble physiological patterns. Further testing is needed to determine whether all ON/OFF pairs respond in a similar manner (e.g. ON-sustained/OFF-sustained). Second, this is the first demonstration that a single stimulus can be used to drive cells in opposite directions (activate one cell and suppress the other). Although further refinements are needed before this approach can be implemented clinically (see below), the ability to differentially activate different types of neurons is of considerable importance for a wide range of other neural stimulation applications. For example, many regions of the CNS contain heterogeneous distributions of projection neurons and local interneurons. The ability to selectively activate one or the other would likely provide a much higher level of control than currently exists for many other neural prosthetic applications.
4.1. Mechanism
In Figure 2, we show that an OFF-BT RGC exhibits a non-monotonic response profile to 5 second trains of constant-amplitude 2000 PPS stimulation. The profile is unimodal, with maximum response occurring at intermediate stimulus amplitudes (∼40 μA) and lesser responses occurring at both lower and higher stimulus amplitudes. This was surprising, as previously tested electrical stimulation paradigms have consistently shown a monotonic increase in elicited activity as stimulus amplitude increases [43-45]. Blocking of excitatory synaptic glutamatergic input using CNQX and AP-7 (Methods) did not alter the response, revealing that cellular response to 2000 PPS stimulation is the result of direct activation of the RGC, and not from activation of presynaptic excitatory neurons. This was the case for both constant amplitude 2000 PPS stimulation (n = 3 OFF-BT) as well as for amplitude modulated 2000 PPS stimulation (n = 2 OFF-BT, n = 3 ON-BT, data not shown). It is still unclear how the high rate of stimulus would create this unimodal response profile, but several additional possibilities exist. For example, stimulation at high rates may cause tonic depolarization of the cell, holding the membrane at a depolarized state and preventing further spiking [36, 46, 47]. Alternately, there may be potassium and/or other inhibitory channels that are activated preferentially by this stimulus. Finally, HFS at high amplitudes may activate inhibitory amacrine cells, leading to a decrease in RGC activity. More work is necessary to determine the precise mechanism of this property of OFF-BT cells, and to determine if this occurs in other cell-types, particularly ON-BT cells.
The mechanism behind ON and OFF-BT cells responding differently to the same stimulus waveform is also not revealed by the present study. In addition to the differences in cell-types seen during the diamond transients, OFF-BT RGCs exhibited a much stronger response to baseline stimulation at 40 uA than did ON cells. Analogously, ON cells had a stronger response at baseline levels of 60 uA. It will be interesting in further studies to explore the factors that underlie these differences. Much work has been done examining the differing synaptic circuitry of ON and OFF cells [48-54], however very little is known about the intrinsic differences in the electrophysiological properties of these cell-types. Margolis et al. examined the RGC response of ON and OFF cells while blocking synaptic input, and found that OFF cells maintain spontaneous activity in the absence of any input, and exhibit subthreshold membrane potential oscillations, rebound excitation, and burst firing. In contrast, ON cells exhibit no endogenous activity and display none of the aforementioned phenomena [55]. Later, the same group determined the presence of a low-voltage activated (LVA) Ca2+ channel in OFF cells that does not exist in ON cells [56]. A computational modeling study by Kamaneva et. al. determined that many of the behavioral differences between the two cells can be explained by the addition of this LVA Ca2+ current in OFF cells [57]. The same group also showed that these channel differences could be exploited to generate differential responses in ON vs. OFF RGCs to sinusoidal stimulation [58]. However, their simulation showed no difference in ON and OFF RGC response to high-frequency sinusoidal stimulation (1 kHz), suggesting that the LVA Ca2+ may not underlie the differential responses presented here. Determining the precise mechanism behind the differential responses is left for later investigations.
4.2. Future Work
This work represents the first time an identical stimulus has produced different responses in different retinal ganglion cell-types. However, further development is needed before these methods can be implemented clinically. For instance, the average background spiking level for OFF-BT cells seen in Figure 4b was approximately 100 Hz during baseline stimulation, much higher than normal spontaneous activity. The spontaneous firing rate in healthy rabbit RGCs varies greatly between cells, but can be as high as 30 Hz [59]. RGCs in the degenerate mouse retina, however, can maintain spontaneous rates as high as 80 Hz [60]. Such rates can persist for long periods of time, suggesting that rates in this range are not intrinsically toxic to the cell. Because the background spiking rates in OFF BT cells observed here are even higher than those that occur in the degenerate retina, it would be desirable to reduce such levels so as to minimize any potential adverse effects. Encouragingly, we observed an accommodative effect in background spiking that was strong at the onset of the pulse train and persisted throughout its time course (Figure 4). This raises the possibility that even further reductions in background level may occur in response to even more prolonged stimulation trains. In addition, there is a large parameter space associated with these waveforms, raising the possibility that other parameter sets may further decrease background firing levels.
Our results suggest that further testing of this stimulus paradigm is warranted. If HFS parameters can be optimized in order to maximize the difference in responses between cell-types, as well as lower the spiking levels produced during the baseline periods, we may be able to more closely replicate physiological response patterns in the retina that will lead to improved outcomes in present generation retinal prosthetics. Additionally, the prospect of an electrical stimulus capable of cell-specific selective activation has broad applications throughout the fields of neural stimulation and neuroprostheses.
Acknowledgments
This work was supported by the Veterans Administration (1I01RX000350-01A1) and by the National Institute of Health (1R01 EY019967-01).
References
- 1.Friedman DS, et al. Prevalence of age-related macular degeneration in the United States. Arch Ophthalmol. 2004;122(4):564–72. doi: 10.1001/archopht.122.4.564. [DOI] [PubMed] [Google Scholar]
- 2.Bunker CH, et al. Prevalence of retinitis pigmentosa in Maine. Am J Ophthalmol. 1984;97(3):357–65. doi: 10.1016/0002-9394(84)90636-6. [DOI] [PubMed] [Google Scholar]
- 3.Hartong DT, Berson EL, Dryja TP. Retinitis pigmentosa. Lancet. 2006;368(9549):1795–809. doi: 10.1016/S0140-6736(06)69740-7. [DOI] [PubMed] [Google Scholar]
- 4.Chopdar A, Chakravarthy U, Verma D. Age related macular degeneration. BMJ. 2003;326(7387):485–8. doi: 10.1136/bmj.326.7387.485. [DOI] [PMC free article] [PubMed] [Google Scholar]
- 5.Weiland JD, Cho AK, Humayun MS. Retinal prostheses: current clinical results and future needs. Ophthalmology. 2011;118(11):2227–37. doi: 10.1016/j.ophtha.2011.08.042. [DOI] [PubMed] [Google Scholar]
- 6.Ahuja AK, et al. Blind subjects implanted with the Argus II retinal prosthesis are able to improve performance in a spatial-motor task. Br J Ophthalmol. 2011;95(4):539–43. doi: 10.1136/bjo.2010.179622. [DOI] [PMC free article] [PubMed] [Google Scholar]
- 7.Zrenner E, et al. Subretinal electronic chips allow blind patients to read letters and combine them to words. Proc Biol Sci. 2011;278(1711):1489–97. doi: 10.1098/rspb.2010.1747. [DOI] [PMC free article] [PubMed] [Google Scholar]
- 8.Humayun MS, et al. Interim results from the international trial of Second Sight's visual prosthesis. Ophthalmology. 2012;119(4):779–88. doi: 10.1016/j.ophtha.2011.09.028. [DOI] [PMC free article] [PubMed] [Google Scholar]
- 9.daCruz L, et al. Patients Blinded by Outer Retinal Dystrophies Are Able to Identify Letters Using the Argus II Retinal Prosthesis System. Invest Ophthalmol Vis Sci. 2010;51(E-Abstract) Abstract #: 2023. [Google Scholar]
- 10.Ahuja AK. Blind subjects implanted with the Argus II retinal prosthesis are able to improve performance in a spatial-motor task. Br J Ophthalmol. 2011;95:539–543. doi: 10.1136/bjo.2010.179622. [DOI] [PMC free article] [PubMed] [Google Scholar]
- 11.Rockhill RL, et al. The diversity of ganglion cells in a mammalian retina. J Neurosci. 2002;22(9):3831–43. doi: 10.1523/JNEUROSCI.22-09-03831.2002. [DOI] [PMC free article] [PubMed] [Google Scholar]
- 12.DeVries SH, Baylor DA. Mosaic arrangement of ganglion cell receptive fields in rabbit retina. Journal of Neurophysiology. 1997;78(4):2048–2060. doi: 10.1152/jn.1997.78.4.2048. [DOI] [PubMed] [Google Scholar]
- 13.Roska B, Werblin F. Vertical interactions across ten parallel, stacked representations in the mammalian retina. Nature. 2001;410(6828):583–587. doi: 10.1038/35069068. [DOI] [PubMed] [Google Scholar]
- 14.O'Brien BJ, et al. Intrinsic physiological properties of cat retinal ganglion cells. J Physiol. 2002;538(Pt 3):787–802. doi: 10.1113/jphysiol.2001.013009. [DOI] [PMC free article] [PubMed] [Google Scholar]
- 15.Meister M, Berry MJ., 2nd The neural code of the retina. Neuron. 1999;22(3):435–50. doi: 10.1016/s0896-6273(00)80700-x. [DOI] [PubMed] [Google Scholar]
- 16.Meister M, Lagnado L, Baylor DA. Concerted Signaling by Retinal Ganglion-Cells. Science. 1995;270(5239):1207–1210. doi: 10.1126/science.270.5239.1207. [DOI] [PubMed] [Google Scholar]
- 17.Schnitzer MJ, Meister M. Multineuronal firing patterns in the signal from eye to brain. Neuron. 2003;37(3):499–511. doi: 10.1016/s0896-6273(03)00004-7. [DOI] [PubMed] [Google Scholar]
- 18.Eickenscheidt M, et al. Electrical stimulation of retinal neurons in epiretinal and subretinal configuration using a multicapacitor array. J Neurophysiol. 2012;107(10):2742–55. doi: 10.1152/jn.00909.2011. [DOI] [PubMed] [Google Scholar]
- 19.Freeman DK, et al. Selective Activation of Neuronal Targets with Sinusoidal Electric Stimulation. Journal of Neurophysiology. 2010 doi: 10.1152/jn.00551.2010. On-line access. [DOI] [PMC free article] [PubMed] [Google Scholar]
- 20.Jensen RJ, Rizzo JF., 3rd Thresholds for activation of rabbit retinal ganglion cells with a subretinal electrode. Exp Eye Res. 2006;83(2):367–73. doi: 10.1016/j.exer.2006.01.012. [DOI] [PubMed] [Google Scholar]
- 21.Jensen RJ, Rizzo JF. Activation of ganglion cells in wild-type and rd1 mouse retinas with monophasic and biphasic current pulses. J Neural Eng. 2009;6 doi: 10.1088/1741-2560/6/3/035004. In Press. [DOI] [PubMed] [Google Scholar]
- 22.Busskamp V, Roska B. Optogenetic approaches to restoring visual function in retinitis pigmentosa. Curr Opin Neurobiol. 2011;21(6):942–6. doi: 10.1016/j.conb.2011.06.001. [DOI] [PubMed] [Google Scholar]
- 23.Greenberg KP, Pham A, Werblin FS. Differential targeting of optical neuromodulators to ganglion cell soma and dendrites allows dynamic control of center-surround antagonism. Neuron. 2011;69(4):713–20. doi: 10.1016/j.neuron.2011.01.024. [DOI] [PubMed] [Google Scholar]
- 24.Litvak LM, et al. Desynchronization of electrically evoked auditory-nerve activity by high-frequency pulse trains of long duration. J Acoust Soc Am. 2003;114(4 Pt 1):2066–78. doi: 10.1121/1.1612492. [DOI] [PMC free article] [PubMed] [Google Scholar]
- 25.Wilson BS, et al. Temporal representations with cochlear implants. Am J Otol. 1997;18(6 Suppl):S30–4. [PubMed] [Google Scholar]
- 26.Litvak L, Delgutte B, Eddington D. Auditory nerve fiber responses to electric stimulation: modulated and unmodulated pulse trains. J Acoust Soc Am. 2001;110(1):368–79. doi: 10.1121/1.1375140. [DOI] [PMC free article] [PubMed] [Google Scholar]
- 27.Javel E, Shepherd RK. Electrical stimulation of the auditory nerve. III. Response initiation sites and temporal fine structure. Hear Res. 2000;140(1-2):45–76. doi: 10.1016/s0378-5955(99)00186-0. [DOI] [PubMed] [Google Scholar]
- 28.Bhadra N, Kilgore KL. High-frequency electrical conduction block of mammalian peripheral motor nerve. Muscle Nerve. 2005;32(6):782–90. doi: 10.1002/mus.20428. [DOI] [PubMed] [Google Scholar]
- 29.Baratta R, et al. Orderly stimulation of skeletal muscle motor units with tripolar nerve cuff electrode. IEEE Trans Biomed Eng. 1989;36(8):836–43. doi: 10.1109/10.30809. [DOI] [PubMed] [Google Scholar]
- 30.Bowman BR, McNeal DR. Response of single alpha motoneurons to high-frequency pulse trains. Firing behavior and conduction block phenomenon. Appl Neurophysiol. 1986;49(3):121–38. doi: 10.1159/000100137. [DOI] [PubMed] [Google Scholar]
- 31.Cattell M, Gerard RW. The “inhibitory” effect of high-frequency stimulation and the excitation state of nerve. J Physiol. 1935;83(4):407–15. doi: 10.1113/jphysiol.1935.sp003238. [DOI] [PMC free article] [PubMed] [Google Scholar]
- 32.Joseph L, Haeffele BD, Butera RJ. Conduction block induced by high frequency AC stimulation in unmyelinated nerves. Conf Proc IEEE Eng Med Biol Soc. 2007;2007:1719–22. doi: 10.1109/IEMBS.2007.4352641. [DOI] [PubMed] [Google Scholar]
- 33.Shaker HS, et al. Reduction of bladder outlet resistance by selective sacral root stimulation using high-frequency blockade in dogs: an acute study. J Urol. 1998;160(3 Pt 1):901–7. doi: 10.1016/S0022-5347(01)62830-1. [DOI] [PubMed] [Google Scholar]
- 34.Joseph L, Butera RJ. High-frequency stimulation selectively blocks different types of fibers in frog sciatic nerve. IEEE Trans Neural Syst Rehabil Eng. 2011;19(5):550–7. doi: 10.1109/TNSRE.2011.2163082. [DOI] [PMC free article] [PubMed] [Google Scholar]
- 35.Mou Z, et al. A simulation study of the combined thermoelectric extracellular stimulation of the sciatic nerve of the Xenopus laevis: the localized transient heat block. IEEE Trans Biomed Eng. 2012;59(6):1758–69. doi: 10.1109/TBME.2012.2194146. [DOI] [PubMed] [Google Scholar]
- 36.Kilgore KL, Bhadra N. Nerve conduction block utilising high-frequency alternating current. Med Biol Eng Comput. 2004;42(3):394–406. doi: 10.1007/BF02344716. [DOI] [PubMed] [Google Scholar]
- 37.Cleland BG, Levick WR. Brisk and sluggish concentrically organized ganglion cells in the cat's retina. J Physiol. 1974;240(2):421–56. doi: 10.1113/jphysiol.1974.sp010617. [DOI] [PMC free article] [PubMed] [Google Scholar]
- 38.Fried SI, et al. Axonal sodium-channel bands shape the response to electric stimulation in retinal ganglion cells. J Neurophysiol. 2009;101(4):1972–87. doi: 10.1152/jn.91081.2008. [DOI] [PMC free article] [PubMed] [Google Scholar]
- 39.Sekirnjak C, et al. High-resolution electrical stimulation of primate retina for epiretinal implant design. J Neurosci. 2008;28(17):4446–56. doi: 10.1523/JNEUROSCI.5138-07.2008. [DOI] [PMC free article] [PubMed] [Google Scholar]
- 40.Behrend MR, et al. Selective labeling of retinal ganglion cells with calcium indicators by retrograde loading in vitro. J Neurosci Methods. 2009;179(2):166–72. doi: 10.1016/j.jneumeth.2009.01.019. [DOI] [PMC free article] [PubMed] [Google Scholar]
- 41.Puchalla JL, et al. Redundancy in the population code of the retina. Neuron. 2005;46(3):493–504. doi: 10.1016/j.neuron.2005.03.026. [DOI] [PubMed] [Google Scholar]
- 42.Felsen G, Dan Y. A natural approach to studying vision. Nat Neurosci. 2005;8(12):1643–6. doi: 10.1038/nn1608. [DOI] [PubMed] [Google Scholar]
- 43.Tsai D, et al. Direct activation and temporal response properties of rabbit retinal ganglion cells following subretinal stimulation. J Neurophysiol. 2009;102(5):2982–93. doi: 10.1152/jn.00545.2009. [DOI] [PubMed] [Google Scholar]
- 44.Cai C, et al. Response variability to high rates of electric stimulation in retinal ganglion cells. J Neurophysiol. 2011;106(1):153–62. doi: 10.1152/jn.00956.2010. [DOI] [PMC free article] [PubMed] [Google Scholar]
- 45.Freeman DK, et al. Selective activation of neuronal targets with sinusoidal electric stimulation. Journal of Neurophysiology. 2010;104:2778–2791. doi: 10.1152/jn.00551.2010. [DOI] [PMC free article] [PubMed] [Google Scholar]
- 46.Krauthamer V, Crosheck T. Effects of high-rate electrical stimulation upon firing in modelled and real neurons. Med Biol Eng Comput. 2002;40(3):360–6. doi: 10.1007/BF02344220. [DOI] [PubMed] [Google Scholar]
- 47.Williamson RP, Andrews BJ. Localized electrical nerve blocking. IEEE Trans Biomed Eng. 2005;52(3):362–70. doi: 10.1109/TBME.2004.842790. [DOI] [PubMed] [Google Scholar]
- 48.Zaghloul KA, Boahen K, Demb JB. Different circuits for ON and OFF retinal ganglion cells cause different contrast sensitivities. J Neurosci. 2003;23(7):2645–54. doi: 10.1523/JNEUROSCI.23-07-02645.2003. [DOI] [PMC free article] [PubMed] [Google Scholar]
- 49.Famiglietti EV, Jr, Kaneko A, Tachibana M. Neuronal architecture of on and off pathways to ganglion cells in carp retina. Science. 1977;198(4323):1267–9. doi: 10.1126/science.73223. [DOI] [PubMed] [Google Scholar]
- 50.Famiglietti EV, Jr, Kolb H. Structural basis for ON-and OFF-center responses in retinal ganglion cells. Science. 1976;194(4261):193–5. doi: 10.1126/science.959847. [DOI] [PubMed] [Google Scholar]
- 51.Schiller PH. Central connections of the retinal ON and OFF pathways. Nature. 1982;297(5867):580–3. doi: 10.1038/297580a0. [DOI] [PubMed] [Google Scholar]
- 52.Pang JJ, Gao F, Wu SM. Light-evoked excitatory and inhibitory synaptic inputs to ON and OFF alpha ganglion cells in the mouse retina. J Neurosci. 2003;23(14):6063–73. doi: 10.1523/JNEUROSCI.23-14-06063.2003. [DOI] [PMC free article] [PubMed] [Google Scholar]
- 53.Murphy GJ, Rieke F. Network variability limits stimulus-evoked spike timing precision in retinal ganglion cells. Neuron. 2006;52(3):511–24. doi: 10.1016/j.neuron.2006.09.014. [DOI] [PMC free article] [PubMed] [Google Scholar]
- 54.Sagdullaev BT, McCall MA, Lukasiewicz PD. Presynaptic inhibition modulates spillover, creating distinct dynamic response ranges of sensory output. Neuron. 2006;50(6):923–35. doi: 10.1016/j.neuron.2006.05.015. [DOI] [PubMed] [Google Scholar]
- 55.Margolis DJ, Detwiler PB. Different mechanisms generate maintained activity in ON and OFF retinal ganglion cells. J Neurosci. 2007;27(22):5994–6005. doi: 10.1523/JNEUROSCI.0130-07.2007. [DOI] [PMC free article] [PubMed] [Google Scholar]
- 56.Margolis DJ, et al. Dendritic calcium signaling in ON and OFF mouse retinal ganglion cells. J Neurosci. 2010;30(21):7127–38. doi: 10.1523/JNEUROSCI.5694-09.2010. [DOI] [PMC free article] [PubMed] [Google Scholar]
- 57.Kameneva T, Meffin H, Burkitt AN. Modelling intrinsic electrophysiological properties of ON and OFF retinal ganglion cells. J Comput Neurosci. 2011;31(3):547–61. doi: 10.1007/s10827-011-0322-3. [DOI] [PubMed] [Google Scholar]
- 58.Kameneva T, Meffin H, Burkitt AN. Differential stimulation of ON and OFF retinal ganglion cells: a modeling study. Conf Proc IEEE Eng Med Biol Soc. 2010;2010:4246–9. doi: 10.1109/IEMBS.2010.5627176. [DOI] [PubMed] [Google Scholar]
- 59.Caldwell JH, Daw NW. New properties of rabbit retinal ganglion cells. J Physiol. 1978;276:257–76. doi: 10.1113/jphysiol.1978.sp012232. [DOI] [PMC free article] [PubMed] [Google Scholar]
- 60.Margolis DJ, et al. Functional stability of retinal ganglion cells after degeneration-induced changes in synaptic input. J Neurosci. 2008;28(25):6526–36. doi: 10.1523/JNEUROSCI.1533-08.2008. [DOI] [PMC free article] [PubMed] [Google Scholar]