

Abstract
Objective
The purpose of this study was to determine whether the technologist has an effect on the radiologists’ interpretative performance of diagnostic mammography.
Materials and Methods
Using data from a community based mammography registry from 1994 to 2009, we identified 162,755 diagnostic mammograms interpreted by 286 radiologists and performed by 303 mammographic technologists. We calculated sensitivity, false positive rate, and positive predictive value of biopsy (PPV2) for examinations performed (images taken) by each mammographic technologist, separately for film and digital modalities. We assessed the variability of these performance measures among mammographic technologists, using mixed effects logistic regression and taking into account the clustering of examinations within women, radiologists, and radiology practice.
Results
Among the 291 technologists performing film examinations, mean sensitivity of the examinations they performed was 83.0% (95% Confidence Interval (CI)=80.8–85.2%), mean false positive rate was 8.5 per 1000 examinations (95%CI: 8.0–9.0%), and mean PPV2 was 27.1% (95%CI: 24.8–29.4). For the 45 technologists performing digital examinations, mean sensitivity of the examinations they performed was 79.6% (95%CI: 73.1–86.2%), mean false positive rate was 8.8 (95%CI: 7.5–10.0%), and mean PPV2 was 23.6% (95%CI: 18.8–28.4%). We found significant variation by technologist in the sensitivity, false positive rate, and PPV2 for film but not digital mammography (p<0.0001 for all 3 film performance measures).
Conclusions
Our results suggest that the technologist has an influence on radiologists’ performance of diagnostic film mammography but not digital. Future work should examine why this difference by modality exists and determine if similar patterns are observed for screening mammography.
Introduction
Diagnostic mammography is defined as those examinations performed for indications other than the screening of asymptomatic women.[1, 2] Understanding the variability in the performance of diagnostic mammography is vital since breast cancer is approximately ten times more prevalent among women receiving diagnostic versus screening mammography.[3, 4] Prior studies report significant variation in the interpretative performance of diagnostic mammography across radiologists.[3] In particular, higher radiologist performance has been reported for radiologists specializing in breast imaging and for radiologists working in a facility with at least one radiologist with high interpretative volume.[5, 6] Prior studies have also found that radiologists’ performance improves with the availability of clinical symptom information and prior images for comparison.[7] Patient characteristics have not been shown to explain the radiologists performance variability.[8]
In addition to radiologist and patient factors, variability may derive from factors associated with the radiologic technologists carrying out the diagnostic mammogram. The radiologists’ interpretive ability may be influenced by the quality of the image, the accuracy of positioning, and the interaction between the radiologist and technologist. There is scant information examining the role of technologists on the variability in the radiologists’ interpretative performance of diagnostic mammography. The purpose of this study was to determine whether the radiologists’ interpretation of diagnostic mammography differs according to the technologist involved in performing the examination, for both screen-film and digital modalities. We hypothesize that there is technologist variability associated with performance characteristics, after controlling for the effect of the radiologist.
Material and Methods
The data used in this study were collected under a waiver of consent. The study was reviewed and approved by the Institutional Review Board at The University of North Carolina at Chapel Hill.
Study Sample
We identified all diagnostic mammograms from the Carolina Mammography Registry (CMR) from January 1994 to December 2009 among women ages 18 and older. Diagnostic mammograms were excluded if a woman had a personal history of breast cancer or had breast implants. In addition, we required that each technologist perform an average of 20 diagnostic mammograms per year.
Data Sources and Definitions
Prospective data collected from participating CMR mammography practices includes characteristics of women, reason for the breast imaging visit, breast cancer risk factors, imaging procedures performed, radiologist findings, assessment and management recommendations, as well as de-identified codes indicating the radiologist interpreting the mammogram and the mammographic technologist performing the examination. These data are linked with the North Carolina Central Cancer Registry (NCCCR) and pathology data to allow for the calculation of standard performance measures including recall rate, sensitivity, false positive rate, and positive predictive value of the recommendation of the biopsy (PPV2).
Patient data in the descriptive analyses includes: patient age, race, breast density based on the Breast Imaging-Reporting and Data System (BI-RADS) density classification of almost entirely fat, scattered fibroglandular densities, heterogeneously dense, and extremely dense,[9] family history of breast cancer, history of a breast biopsy/breast surgery, time since last mammogram, and year of the examination. Lack of a response and responses of no were grouped for family history of breast cancer and history of a breast biopsy/breast surgery.
Using standard definitions, we defined diagnostic mammograms as mammograms performed for a problem or symptom. Each mammogram was classified as positive or negative based on the BI-RADS assessment. Positive mammograms were BI-RADS of 0, 4, 5, or 3 when the recommendation was biopsy, fine needle aspiration, or surgical consult. Negative mammograms were defined as BI-RADS of 1, 2, or 3 with no recommendation for biopsy, fine needle aspiration, or surgical consult.[10] Among film examinations a total of 26,835 had a BIRADS assessment of 3 and of these 1,398 (5.2%) were recommended for biopsy, FNA or surgical consult and were thus coded as positive. For the digital examinations a total of 4,165 had a BIRADS assessment of 3 and of these 53 (1.3%) were recommended for biopsy, FNA or surgical consult and were coded as positive. This classification for BIRADS 3 is the same as that found in work published by the Breast Cancer Surveillance Consortium (http://breastscreening.cancer.gov). Using data from the NCCCR, we determined which mammograms had a breast cancer diagnosis in the subsequent 365 days. From the radiologist assessment and the cancer diagnosis, each mammographic examination was classified as true positive (positive mammogram with cancer diagnosed in the follow-up period), false positive (positive mammogram with no cancer diagnosed in the follow-up period), true negative (negative mammogram with no cancer diagnosed in the follow-up period), or false negative (negative mammogram with cancer diagnosed in the follow-up period).
We calculated sensitivity, false positive rate, and PPV2. Sensitivity was defined as the proportion of positive examinations among women with a breast cancer diagnosis. False positive rate was defined as the proportion of women with a positive mammographic examination but no cancer diagnosis. The PPV2 was defined as the proportion of diagnostic examinations recommended for biopsy that resulted in a cancer diagnosis within one year.
Data Analysis
We computed descriptive statistics for the patient characteristics associated with film and digital mammograms. We described the number of diagnostic mammograms carried out by each technologist. We calculated the mean and 95% confidence intervals (95%CI) for the performance measures of sensitivity, false positive rate, and PPV2.
To assess variability in performance measures across technologists, we employed a set of mixed effects logistic regressions, using PROC GLIMMIX (SAS version 9.3). We modeled the performance measures directly, using the strategy outlined by Couglin et al.[11] Each model accounted for the possibility of multiple mammograms for the same woman, by modeling the residual variance using a compound symmetric structure. The models also included radiologist-specific, practice-specific, and technologist-specific random effects. The technologist-specific random effects, latent differences in technologists’ performance measures from the population mean, allowed for the modeling of distinct performance measures for each technologist. By also including the radiologist-specific and practice-specific random effects, we adjusted for individual differences between radiologists and mammography practices. This approach enabled us to determine if technologists’ impact on performance measures was independent of the radiologist interpreting the image and the practice site where the mammogram was performed. In other words, after controlling for differences between radiologists and practice, we tested whether statistically significant performance differences existed between technologists. Significance in the variation of performance measures across technologists was evaluated by conducting likelihood ratio tests, using the residual pseudolikelihood.[12]
Results
From 1994 to 2009 there were a total of 162,755 diagnostic mammograms interpreted by 286 radiologists and performed by 303 technologists. Of these, 141,754 film examinations were interpreted by 277 radiologists and performed by 291 technologists; in comparison, 21,001 digital examinations were interpreted by 58 radiologists and performed by 45 technologists. A total of 33 technologists were in both the film and digital groups, as practices converted from film to digital during the study period.
The patient characteristics associated with the 162,755 diagnostic mammograms by imaging modality (film and digital) and cancer status are presented in Table 1. For the study population, breast cancer was found in 4,752 of the 141,754 diagnostic film mammograms (cancer diagnosis rate of 3.4%) and in 802 of the 21,001 diagnostic digital mammograms (cancer diagnosis rate of 3.8%). The majority of the women in the study were white and ages 40–59 years. A higher proportion of examinations resulting in a cancer diagnosis reported a family history of breast cancer (10.2% versus 7.5% for film; 13.1% versus 10.3% for digital). Approximately 30.0% of mammograms had a history of a breast procedure. Prior mammography use was lower for digital versus film examinations. The majority of film examinations were performed for symptomatic reasons while the majority of digital examinations were performed for additional evaluation of a recent prior mammogram.
Table 1.
Characteristics of the Diagnostic Mammograms by Modality and Cancer Status
| Patient Characteristic | Film Examinations (n=141,754) |
Digital Examinations (n=21,001) |
||
|---|---|---|---|---|
| Without cancer (n=137,002) |
With cancer (n=4,752) |
Without cancer (n=20,199) |
With cancer (n=802) |
|
| N (%) | N (%) | N (%) | N (%) | |
| Age (years) 18–39 40–49 50–59 60–69 70–79 80+ |
21,975 (16.0) 42,745 (31.2) 33,632 (24.6) 22,218 (16.2) 12,741 (9.3) 3,691 (2.7) |
291 (6.1) 848 (17.9) 1,154 (24.3) 1,158 (24.4) 891 (18.8) 410 (8.6) |
2,447 (12.1) 5,951 (29.5) 5,009 (24.8) 3,929 (19.5) 2,153 (10.7) 710 (3.5) |
28 (3.5) 116 (14.5) 177 (22.1) 203 (25.3) 168 (21.0) 110 (13.7) |
| Race Black White Other Missing |
22,124 (16.2) 96,188 (70.2) 1,896 (1.4) 16,794 (12.3) |
820 (17.3) 3,349 (70.5) 44 (0.9) 539 (11.3) |
3,707 (18.4) 14,550 (72.0) 271 (1.3) 1,671 (8.3) |
138 (17.2) 595 (74.2) 9 (1.1) 60 (7.5) |
| Breast Density Extremely dense Heterogeneously dense Scattered fibroglandular densities Almost entirely fat Missing |
13,076 (9.5) 55,194 (40.3) 55,251 (40.3) 4,614 (3.4) 8,867 (6.5) |
350 (7.4) 1,822 (38.3) 2,031 (42.7) 131 (2.8) 418 (8.8) |
950 (4.7) 9,384 (46.5) 6,709 (33.2) 714 (3.5) 2,442 (12.1) |
25 (3.1) 371 (46.3) 262 (32.7) 32 (4.0) 112 (14.0) |
| Family history of breast cancer Yes No/Missing* |
10,291 (7.5) 126,711 (92.5) |
485 (10.2) 4,267 (89.8) |
2,080 (10.3) 18,119 (89.7) |
105 (13.1) 697 (87.0) |
| History of breast biopsy/surgery Yes No/Missing* |
39,398 (28.8) 97,604 (71.2) |
1,403 (29.5) 3,349 (70.5) |
6,038 (29.9) 14,161 (70.1) |
255 (31.8) 547 (68.2) |
| Time since last examination < 1 year 1 to < 3 years >= 3 years None/Missing* |
71,801 (52.4) 29,845 (21.8) 7735 (5.7) 27,621 (20.2) |
2,185 (46.0) 887 (18.7) 463 (9.7) 1,217 (25.6) |
13,038 (64.6) 1,915 (9.5) 677 (3.4) 4,569 (22.6) |
459 (57.2) 72 (9.0) 64 (8.0) 207 (25.8) |
| Reason for examination Symptomatic Short interval follow-up Additional evaluation of recent mammogram |
76,713 (56.0) 18,202 (13.3) 42,087 (30.7) |
2,974 (62.6) 196 (4.1) 1,582 (33.3) |
7,010 (34.7) 2,772 (13.7) 1,041 (51.6) |
334 (41.7) 35 (4.4) 433 (54.0) |
Non-responses to family history, history of a prior breast biopsy/surgery, and time since last examination are grouped with No responses.
The mean number of diagnostic mammograms performed per technologist per year was 134.5 for film (inter quartile range (IQR) = 133.5) and 175.8 for digital (IQR=289.4). Figure 1A shows the distribution of the average number of diagnostic film mammograms carried out per year per technologist. The majority of technologists conducted fewer than 100 examinations. For digital diagnostic examinations, there is a similar pattern with the majority of technologists carrying out an average of fewer than 100 examinations per year. There is a spike with 22% of technologists performing 300–399 diagnostic digital examinations per year (Figure 1B).
Figure 1.


Distribution of the average number of diagnostic mammograms performed per technologist per year; A. film, B. digital
For the study population, a total of 17,270 (10.6%) of the 162,755 diagnostic mammograms were interpreted as positive (14,906 film and 2,364 digital). Among these positive examinations, biopsy was recommended in 10,161 (58.8%) of cases (8,578 film and 1,583 digital) and subsequently performed in 6,629 (65.2%) of these cases (5,507 film and 1,122 digital). The adjusted mean (95%CI) and median (25th and 75th percentiles) performance measures for diagnostic film and digital examinations are shown in Table 2. The sensitivity was not significantly higher for film versus digital, evidenced by the overlapping confidence intervals (83.0% with 95%CI: 80.8–85.2% for film and 79.6% with 95%CI: 73.1–86.2% for digital). The false positive rate and the PPV2 showed similar results for film and digital examinations.
Table 2.
Mean (95% confidence intervals) and median (25th – 75th percentile) interpretative performance measures for diagnostic film and digital mammography
| Performance Measure | Film Examinations | Digital Examinations | ||
|---|---|---|---|---|
| Mean (95%CI) | Median (25th–75th percentile) | Mean (95%CI) | Median (25th–75th percentile) | |
| Sensitivity | 83.0 (80.8–85.2) |
85.7 (75.0–100) |
79.6 (73.1–86.2) |
90.9 (80.0–100) |
| False Positive Rate | 8.5 (8.0–9.0) |
7.9 (5.8–11.1) |
8.8 (7.5–10.0) |
8.1 (6.2–10.7) |
| Positive Predictive Value of the biopsy (PPV2) | 27.1 (24.8–29.4) |
25.7 (15.0–37.5) |
23.6 (18.8–28.4) |
25.2 (13.8–35.5) |
The model-based performance measures for each technologist, taking into account the random effects of the radiologist and the practice where the mammogram was performed, are displayed in graphical format as smoothed histograms, stratified by modality (Figures 2A–2F). Taking Figure 2A as an example, even after adjusting for the radiologist and practice effects, predicted sensitivity of film ranges from 0.75 to 0.89 among technologists, with a median of 0.84. The range of performance measures shown in these figures indicates the variability in performance for mammographic studies and suggests more heterogeneity by technologist among performance measures for film than digital. All tests of the technologist variability were significant for film examinations, with p-values of <0.0001 for the sensitivity, false positive rate, and PPV2. For digital examinations the p-values were 0.817 for the sensitivity, 0.324 for the false positive rate, and 0.999 for the PPV2.
Figure 2.


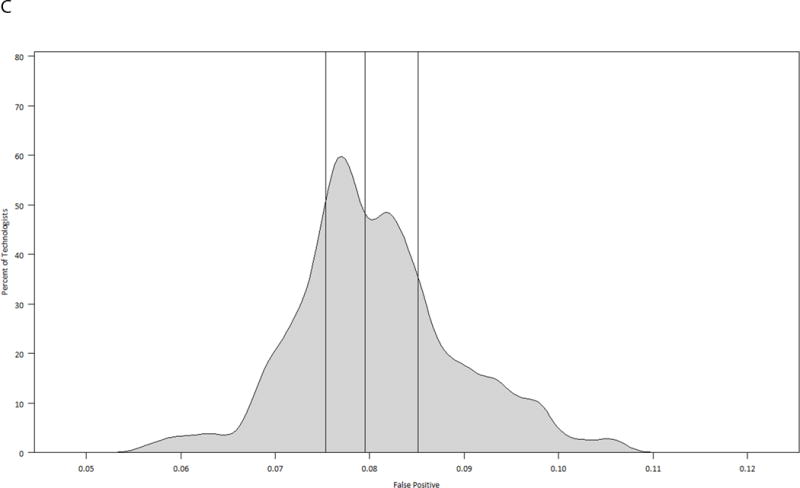
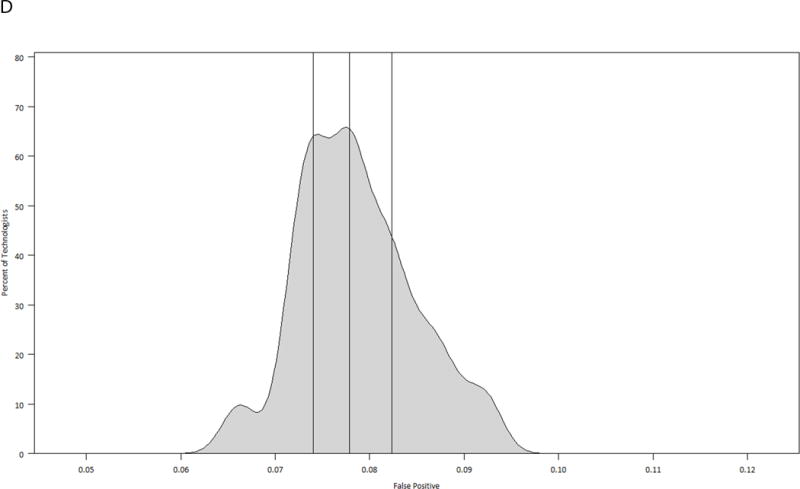


Model-based smoothed histograms of diagnostic mammography performance measures for the 303 technologists by imaging modality (film and digital) with vertical lines at 25th, 50th, and 75th quartiles;
A. Sensitivity film
B. Sensitivity digital
C. False positive rate film
D. False positive rate digital
E. Positive predictive value of biopsy (PPV2) film
F. Positive predictive value of biopsy (PPV2) digital
Discussion
We found significant variability in performance measures by technologist for film but not digital examinations, after adjusting for the radiologist interpreting the image and the practice where the mammogram was performed. There appeared to be significant technologist variability for digital examinations until the practice-specific random effect was included in the models, suggesting that the variability in performance measures by technologist could be accounted for by site differences. This work is the first to look at the effect of technologists on radiologists’ performance. The results are interesting in that we found variation among technologists, but the findings also raise questions as to why we detect variability among technologists for film yet not for digital. One explanation is that this observed difference in technologist variability is not a function of imaging modality but rather the evolution of more rigorous quality standards for technologists over time. For film mammography, it is unknown which specific technologist factors may affect the interpretative performance of radiologists in diagnostic mammography. The way radiologists interact with their technologists and the experience and training of the technologist may influence performance. It is possible that the interaction between radiologists and technologists as well as the technologist experience changed with the introduction of digital mammography. Another explanation for our finding may be that larger practices adopted digital earlier than smaller, more rural practices, and that larger practices have more standardized procedures in place. A third possible explanation is that digital mammography is more forgiving; images can be processed and repeated more easily. Additional work should evaluate what changes, if any, may account for less variability among technologists using digital.
Variability in radiologists’ interpretation of diagnostic mammography has been studied with these findings indicating a range of sources of variation. In a 2011 study by Haneuse et al., radiologists’ interpretative volumes of diagnostic mammograms as well as the proportion of mammograms with a diagnostic focus were shown to impact their performance.[13] Specifically, diagnostic volume and diagnostic focus of the radiologist were found to have a quadratic relationship with sensitivity and specificity with annual diagnostic mammogram volumes of 1000 and a diagnostic focus of 20% having the highest accuracy.[13] Interestingly, neither radiologist’s screening volume nor total mammography volume were consistently associated with interpretative diagnostic performance. Using data from 35,895 diagnostic film mammograms from the Breast Cancer Surveillance Consortium (BCSC), Miglioretti et al. found substantial variation in the interpretative performance of radiologists for diagnostic mammography.[8] This study reported that the strongest predictor of a radiologist’s improved accuracy was having a primary affiliation with an academic medical center, although it is important to note that only seven out of 123 radiologists had a primary academic appointment. Other factors associated with higher sensitivity included radiologists who worked at least 20% in breast imaging and those that performed breast biopsy examinations.[8] Similarly, Leung et al. found that breast specialists detected more cancers than general radiologists when reviewing diagnostic mammograms.[6] Radiologist experience measured as number of years spent interpreting mammography was associated with a higher threshold for considering a diagnostic mammogram as abnormal.[8] In contrast to the study by Haneuse et al., Miglioretti et al. did not find radiologists’ interpretative diagnostic volume to be associated with sensitivity or false-positive rate.[8]
In addition to radiologist characteristics, the interpretative performance of diagnostic mammography has been examined with regard to possible variability by facility factors.[5, 14, 15] Using BCSC data in conjunction with a facility survey, Jackson et al. found significant variability in the false-positive rates of diagnostic mammography, controlling for patient and radiologist factors.[5] In particular, facilities that reported concern about malpractice had moderately or greatly increased diagnostic mammography examination recommendations and had significantly higher false-positive rates.[5] In another study, facilities identified as serving vulnerable women (based on a measure of educational attainment, income, race/ethnicity, and rural/urban residence) had similar interpretative performance for diagnostic mammography to evaluate an abnormal screening result as facilities serving non-vulnerable women.[14] When evaluating a symptomatic breast problem, facilities serving vulnerable women were more likely to recommend biopsy compared to facilities serving non-vulnerable women.[14] In addition, a 2012 study showed that facilities with on-site diagnostic services (ultrasound or biopsy) tended to have higher false positive rates, regardless of the patient population served.[15] Hence, there may be unmeasured facility characteristics that influence diagnostic mammography performance.
Although several studies have examined the variability in the interpretative performance of diagnostic mammography, there is still considerable variation which remains unexplained. Our findings are the first to indicate that when controlling for radiologist and practice differences, there is a technologist effect on diagnostic performance measures for film mammography. Further research is needed to explain why the effect was not seen in digital.
Our study has several strengths. Using data from the CMR we were able to examine the interpretative performance of more than 160,000 diagnostic mammograms including both film and digital examinations. The CMR data includes a diverse patient population, a large number of examinations and cancer outcomes, and geographic inclusion of radiologists and technologists across the state. However, our study sample is limited to examinations performed in North Carolina, and may reflect practice patterns specific to this geographic region. Another limitation of our study is that while we know breast ultrasound was performed in 29% of film and 45% of digital diagnostic mammograms, we are unable to ascertain which technologist performed the breast ultrasound and it is possible that the training and experience of the sonographer performing the study could affect our findings. In addition, it is feasible that there could be inconsistency in whether or not there was direct radiologist supervision of diagnostic mammography and we are unable to account for this. Another limitation of our study is that we were unable to control for individual characteristics of the radiologists. While the majority of technologists performed few diagnostic mammograms, this has little impact on this analysis since it is the number of technologists and not the number of examinations per technologist that contributes to the power to detect a technologist-specific effect.
We found that the radiologists’ performance of diagnostic mammography varied according to the technologist performing the examination for film but not digital mammography. There are important questions that can be examined in future work with respect to interaction with and supervision by the radiologist, and the training, experience and work habits of the technologist for film and digital. As film is declining in use, understanding the technologists’ role in digital will be key to maximizing performance of the radiologist. We expect that our findings will be different when evaluating screening mammography, as screening is a less focused exam than diagnostic. Understanding the characteristics of technologists and how the technologist workforce has evolved overtime may shed light on why diagnostic performance variability among technologists exists in film but not digital mammography.
Acknowledgments
Financial Support
This work was supported by funding from the National Institute of Health, National Cancer Institute under grants R01CA155342 and U01CA70040.
Footnotes
Conflicts of Interest
None
Contributor Information
Louise M. Henderson, Email: louise_henderson@med.unc.edu, Department of Radiology, CB 7515, The University of North Carolina, Chapel Hill, NC 27599-7515. Tel: 919.843.7799; Fax: 919.966.0525.
Thad Benefield, Email: thad_benefield@med.unc.edu, Department of Radiology, CB 7515, The University of North Carolina, Chapel Hill, NC 27599-7515. Tel: 919.966.6160; Fax: 919.966.0525.
J. Michael Bowling, Email: jbowling@email.unc.edu, Department of Health Behavior, CB 7440, The University of North Carolina, Chapel Hill, NC 27599-7440. Tel: 919.302.8166; Fax: 919.928.8955.
Danielle Durham, Email: danielle_durham@med.unc.edu, Department of Epidemiology, CB 7435, The University of North Carolina, Chapel Hill, NC 27599. Tel: 919.966.0492; Fax: 919.966.0525.
Mary W. Marsh, Email: katie_marsh@med.unc.edu, Department of Radiology, CB 7515, The University of North Carolina, Chapel Hill, NC 27599-7515, Tel: 919.966.2865, Fax: 919.966.0525.
Bruce F. Schroeder, Email: schroeder@cbispecialists.com, Department of Radiology, CB 7515, The University of North Carolina, Chapel Hill, NC 27599-7515, Carolina Breast Imaging Specialists, Greenville NC 27834; Departments of Radiology and Oncology, The Brody School of Medicine at East Carolina University, Greenville NC 27834. Tel: 252.565.8951; Fax: 252.565.8958.
Bonnie C. Yankaskas, Email: bcy@med.unc.edu, Department of Radiology, CB 7515, The University of North Carolina, Chapel Hill, NC 27599-7515, Tel: 919.966.0493, Fax: 919.966.0525.
References
- 1.Dee KE, Sickles EA. Medical audit of diagnostic mammography examinations: comparison with screening outcomes obtained concurrently. AJR. 2001;176(3):729–33. doi: 10.2214/ajr.176.3.1760729. [DOI] [PubMed] [Google Scholar]
- 2.Sohlich RE, Sickles EA, Burnside ES, Dee KE. Interpreting data from audits when screening and diagnostic mammography outcomes are combined. AJR. 2002;178(3):681–6. doi: 10.2214/ajr.178.3.1780681. [DOI] [PubMed] [Google Scholar]
- 3.Sickles EA, Miglioretti DL, Ballard-Barbash R, et al. Performance benchmarks for diagnostic mammography. Radiology. 2005;235(3):775–90. doi: 10.1148/radiol.2353040738. [DOI] [PubMed] [Google Scholar]
- 4.Ballard-Barbash R, Taplin SH, Yankaskas BC, et al. Breast Cancer Surveillance Consortium: a national mammography screening and outcomes database. AJR. 1997;169(4):1001–8. doi: 10.2214/ajr.169.4.9308451. [DOI] [PubMed] [Google Scholar]
- 5.Jackson SL, Taplin SH, Sickles EA, et al. Variability of interpretive accuracy among diagnostic mammography facilities. J Natl Cancer Inst. 2009;101(11):814–27. doi: 10.1093/jnci/djp105. [DOI] [PMC free article] [PubMed] [Google Scholar]
- 6.Leung JW, Margolin FR, Dee KE, Jacobs RP, Denny SR, Schrumpf JD. Performance parameters for screening and diagnostic mammography in a community practice: are there differences between specialists and general radiologists? AJR. 2007;188(1):236–41. doi: 10.2214/AJR.05.1581. [DOI] [PubMed] [Google Scholar]
- 7.Barlow WE, Chi C, Carney PA, et al. Accuracy of screening mammography interpretation by characteristics of radiologists. J Natl Cancer Inst. 2004;96(24):1840–50. doi: 10.1093/jnci/djh333. [DOI] [PMC free article] [PubMed] [Google Scholar]
- 8.Miglioretti DL, Smith-Bindman R, Abraham L, et al. Radiologist characteristics associated with interpretive performance of diagnostic mammography. J Natl Cancer Inst. 2007;99(24):1854–63. doi: 10.1093/jnci/djm238. [DOI] [PMC free article] [PubMed] [Google Scholar]
- 9.American College of Radiology. Breast Imaging Reporting and Data System (BI-RADS) 4. Reston, VA: American College of Radiology; 2003. [Google Scholar]
- 10.Illustrated Breast Imaging Reporting and Data System (BI-RADS) 3. Reston, VA: American College of Radiology; 1998. [Google Scholar]
- 11.Coughlin SS, Trock B, Criqui MH, Pickle LW, Browner D, Tefft MC. The logistic modeling of sensitivity, specificity, and predictive value of a diagnostic test. J Clin Epidemiol. 1992;45(1):1–7. doi: 10.1016/0895-4356(92)90180-u. [DOI] [PubMed] [Google Scholar]
- 12.Wolfinger R, O’Connell M. Generalized linear mixed models a pseudo-likelihood approach. Journal of Statistical Computation and Simulation. 1993;48(3–4):233–243. [Google Scholar]
- 13.Haneuse S, Buist DS, Miglioretti DL, et al. Mammographic interpretive volume and diagnostic mammogram interpretation performance in community practice. Radiology. 2012;262(1):69–79. doi: 10.1148/radiol.11111026. [DOI] [PMC free article] [PubMed] [Google Scholar]
- 14.Goldman LE, Walker R, Miglioretti DL, et al. Accuracy of diagnostic mammography at facilities serving vulnerable women. Med Care. 2011;49(1):67–75. doi: 10.1097/MLR.0b013e3181f380e0. [DOI] [PMC free article] [PubMed] [Google Scholar]
- 15.Goldman LE, Walker R, Miglioretti DL, et al. Facility characteristics do not explain higher false-positive rates in diagnostic mammography at facilities serving vulnerable women. Med Care. 2012;50(3):210–6. doi: 10.1097/MLR.0b013e3182407c8a. [DOI] [PMC free article] [PubMed] [Google Scholar]