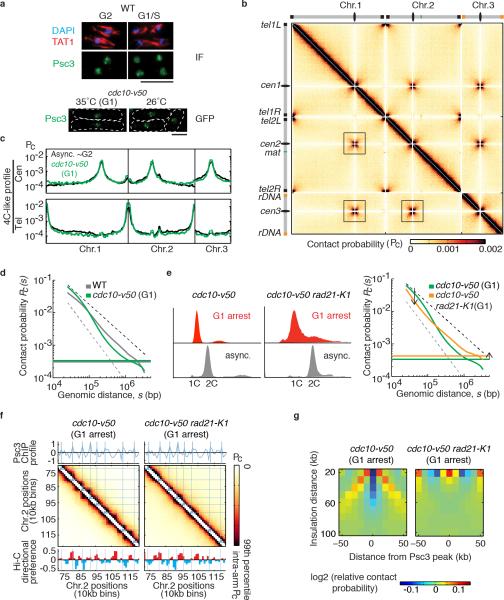
Extended Data Figure 6. Hi-C analysis of G1 arrested cells.
a, Cohesin (Psc3) localization was examined by immunofluorescence in asynchronous wild type cells. Cell cycle stage was determined by tubulin staining (TAT1). Psc3 was detected in the nucleus in both G2 and G1/S phase cells (top). Psc3-GFP localization was examined in G1 arrested cells (cdc10-v50). Predominant nuclear staining and Psc3-GFP dots were detected in both asynchronous cells and G1 arrested cells (bottom). Scale bar, 5μm. b, All-by-all interaction heatmap for G1 cells. The inter-chromosomal cross-like pattern is more prominent in G1 cells than in asynchronous cells. c, 4C-like inter-chromosomal profiles for centromeres and telomeres. d, Global decay of intra-arm contact probability as a function of genomic distance in G1 cells (green) compared with wild type (grey); flat lines indicate average inter-chromosomal contact probability. Slower decay of contact probability over short distances, followed by a more rapid decrease after 100kb, was observed in G1 arrested cells. The black and grey dashed lines represent the slope for fractal globules (-1) and polymers in a melt (-3/2), respectively. e, FACS analysis of cell populations used for Hi-C (left). Global decay of intra-arm contact probability as a function of genomic distance in G1-arrested rad21-K1 (orange) compared to G1 cells (green) is shown at right. f, Hi-C heatmaps of a segment of chromosome 2 for indicated samples overlaid with lines corresponding to cohesin peaks from the 10kb binned cohesin (Psc3) profile. The Hi-C directional preference profile is shown below. Note the globules are not visible in G1 arrested rad21-K1 (cdc10-v50 rad21-K1). g, Insulation plot around cohesin peak sites (detected in G1-arrested cells) for G1 and G1-arrested rad21-K1.

