Abstract
Study Design
Total of 40 patients with spinal metastases from renal cell carcinomas (RCC) or prostate carcinomas (PC) were studied using DCE (Dynamic contrast-enhanced) MRI.
Objective
Our aim was to evaluate spinal metastases from RCC and PC to assess the sensitivity and specificity of perfusion parameters obtained by quantitative and semi-quantitative methods, which would allow for noninvasive discrimination between hypovascular and hypervascular lesions.
Summary of Background Data
Conventional MRI can be inconclusive in assessing diagnostically complex spinal lesions in cancer patients in whom fibrosis, infarction, edema related to compression fractures, and infection may simulate malignant neoplasm. Conventional MRI is also of limited value in assessing tumor vascularity and identifying hypervascular tumors. DCE MRI offers an advantage over conventional MRI in that it provides anatomical, physiological, and hemodynamic information about neoplastic lesions.
Methods
DCE perfusion parameters: vascular permeability (Ktrans), plasma volume (Vp), wash-in slope, and peak-enhancement were measured to assess their potential as discriminators of tumor vascularity. A Mann-Whitney test (at p≤0.01), was performed to quantify and compare significance of perfusion parameters between the two groups.
Results
Of the four perfusion parameters studied, Vp was observed to have the largest difference in mean (µ) between PC (µ=3.29/sec) and RCC metastases (µ=5.92/sec). This was followed by the peak-enhancement, Ktrans, and wash-in parameters. A Mann-Whitney test showed a significant difference between Vp values for PC and RCC lesions (p≤0.001). Similarly, peak-enhancement showed a significant difference between the two histologies (p≤0.001), as did Ktrans (p≤0.01). The receiver operating characteristic curve showed that Vp recorded the highest area under the curve (0.867).
Conclusion
Vp was shown to be the best discriminator between spinal metastases from PC and RCC with the mean Vp of RCC metastasis being 1.8 times that of the PC lesions, thus discriminating between hyper- and hypovascular metastases, which has important clinical implications.
Keywords: Tumor, Spinal metastases, Renal cell carcinoma, Prostate carcinoma, hypovascular, hypervascular, Magnetic resonance imaging, T1 DCE perfusion, Permeability, Plasma volume
Introduction
Common histologies for spinal metastases include neoplasms for which the primary origins are tumors of the breast, lung, prostate, and renal cell.1 Patients with metastatic spinal lesions often present with pain.1–3 Destruction of the spinal column leading to mechanical instability and neurological deficits, such as motor dysfunction due to spinal cord compression, are also possible outcomes of spinal metastases.3 Prostate cancer or prostate carcinoma (PC) is the most commonly diagnosed cancer in males and the second leading cause of cancer deaths.4 Renal cell carcinomas (RCC) are characteristically the most hypervascular of solid tumors, accounting for approximately 90% of kidney cancers.5,6
Magnetic resonance imaging (MRI) has become the standard for imaging spinal marrow disorders. At times, conventional MRI techniques can fail to differentiate malignant from benign lesions because of their similar appearance on imaging.7 It can be difficult to detect tumors when red bone marrow predominates in the axial skeleton, since T1 and T2 values of some tumor types approximate those of hematopoietic bone marrow.8 Thus, conventional MRI can be inadequate in assessing diagnostically complex spinal lesions in cancer patients in whom fibrosis, infarction, edema related to compression fractures, and infection may simulate malignant neoplasm.8 Additionally, before malignant marrow lesions can be seen with conventional MRI, normal bone marrow cells must be replaced by malignant cells to cause local alterations of T1 and T2 values.8 In these cases, conventional imaging may be falsely negative at early stages of disease.
Dynamic contrast-enhanced (DCE) MRI offers an advantage over conventional MRI in that it provides anatomical, physiological, and hemodynamic information about neoplastic lesions.9,10,11 DCE-MRI is a robust technique in evaluating spinal tumor vascularity with excellent concordant correlation with digital subtraction angiography (DSA), which is the gold standard for vascular imaging.12 A number of studies13–16 have shown the potential role of DCE-MRI in improving the management of diseases beyond the brain where its role is well-understood.17 In particular, DCE-MRI’s ability to distinguish between benign and malignant marrow lesions of the vertebral and appendicular skeleton is notable.18–21 Furthermore, perfusion imaging has been shown to be adept in monitoring the response to radiotherapy of tumors in spinal bone metastases.22 A recent study has shown that the semi-quantitative metrics extracted from DCE-MRI can differentiate between hypervascular and hypovascular metastatic lesions of the spine.18 Our aim in this study was to evaluate spinal metastases from RCC and PC using the T1 DCE-MRI perfusion technique and to assess the sensitivity and specificity of perfusion parameters obtained by both quantitative (derived from pharmacokinetic modeling) and semi-quantitative methods, which would allow for noninvasive discrimination between hypovascular and hypervascular spinal metastases. We hypothesized that the values for perfusion parameters will be higher for metastases originating from RCC than from PC, given that the primary source of metastatic RCC lesions confers a hypervascular pattern.
Materials and Methods
Subjects
A waiver of authorization was granted by our institutional review board before this retrospective study. Patients with known untreated spinal metastases who had completed a DCE-MRI examination between 2011 to 2013 were included in this study. A total of 40 patients (mean age, 63.3) who had documented spinal metastases for which the primary tumor origin was either PC (20 patients; mean age, 67.6; 28 lesions) or RCC (20 patients; mean age, 59; 28 lesions) fit the inclusion criteria. A total of 56 metastatic spine lesions were studied.
Data Acquisition
MRI sequences of the spine were acquired with a 1.5-T GE scanner (Milwaukee, Wisconsin) using an 8-channel cervical-thoracic-lumbar (CTL) surface coil. All patients in both groups underwent routine MRI, including sagittal T1 (field-of-view[FOV], 32–36 cm; slice thickness, 3 mm; repetition time[TR], 400–650ms; flip angle[FA], 90°) and T2 (FOV, 32–36 cm; slice thickness, 3 mm; TR, 3500–4000ms; FA, 90°), axial T1 (FOV, 18 cm; slice thickness, 8 mm; FA, 90°) and T2 (FOV, 18 cm; slice thickness, 8mm; TR, 3000–4000ms; FA, 90°), and sagittal Short Inversion Time Inversion Recovery[STIR] (FOV, 32–36 cm; slice thickness, 3 mm; TR, 3500–6000ms; FA, 90°).
DCE-MRI of the spine was then acquired. A bolus of gadolinium-diethylenetriamine penta-acetic acid (Gd-DTPA) was administered by a power injector at 0.1 mmol/kg body weight and a rate of 2 to 3 mL/sec. The kinetic enhancement of tissue during and after injection of Gd-DTPA was obtained using a 3D T1-weighted fast spoiled-gradient (SPGR) echo sequence (TR, 4–5 seconds; echo time [TE], 1–2 seconds; slice thickness, 5 mm; FA, 25°; FOV, 32cm; temporal resolution (∆t) of 6.5 seconds and consisted of 10 –12 images in the sagittal plane. The 3D SPGR sequences generated phase images in addition to the standard magnitude images. The duration of the DCE sequence was 300 seconds. Sagittal and axial T1-weighted post-Gd-DTPA MR images were acquired after DCE-MRI.
Data Analysis
Data processing and analysis was performed using dynamic image processing software (Version 2; NordicIce-NeuroLab, Bergen, Norway). Pre-processing steps included background noise removal, spatial and temporal smoothing, and detection of the arterial input function (AIF) from the aorta. All regions of interests (ROIs) around the metastatic lesions were placed by a neuroradiologist with 13 years of experience (S.K.) in the solid part of the tumor with careful consideration to avoid venous structures, hemangiomas, disc spaces, cortical bone, and spondylotic changes. Anatomical images that matched the DCE-MRI images were used in ROI placements. Voxel-by-voxel estimates of quantitative perfusion parameters, including vascular permeability (Ktrans) and plasma volume (Vp), were determined using a Toft’s pharmacokinetic model analysis23 from the NordicICE software. Wash-in (the slope of the DCE curve) and peak-enhancement, which can be obtained from semi-quantitative analysis, were also calculated to assess their potential as discriminators of tumor histology. If tumor tissue was present in multiple slices, ROI values were determined for each slice. The radiologists placing ROIs was blinded to additional clinical information and additional imaging. A Mann-Whitney U test, at a significance level of p≤0.01, was performed to quantify and compare the significances of the DCE-MRI perfusion parameters- Ktrans, Vp, wash-in, and peak-enhancement of spinal metastases originating from PC to those of spinal metastases originating from RCC.
Dynamic MR Signal Response Curve
The dynamic response curve illustrates changes in MRI signal intensity over time in tissue that corresponds to the change in concentration of contrast agent over time in the same tissue. The dynamic response curves from the same ROIs defined to measure perfusion parameters in metastatic PC and RCC spinal lesions were extracted and compared. Only MRI signal intensities corresponding to the phases of the post-injection time period (10 phases) were included for the calculation. A Mann-Whitney U test (at a significance level of p≤0.01) was conducted to assess the difference between the dynamic response curves of the two different pathologies. In addition, the receiver operating characteristic (ROC) curve analysis was applied to assess the sensitivity and specificity of perfusion parameters between the two pathologies. All statistical analysis was done with SPSS (Version 15.0 for Windows).
Results
DCE-MRI on PC and RCC
Figure 1 presents T1-weighted images (1a) and corresponding DCE dynamic perfusion images (1b) of example cases of metastatic PC and RCC spinal lesions. Metastatic RCC lesions, in general, visually appeared more hyperintense on the dynamic images from DCE-MRI when compared to those of metastatic PC spinal lesions (Figure 1b). Figure 1c shows typical dynamic dose response curves following rapid contrast injection. Dynamic dose response curves obtained from tumor ROIs within the spinal lesions show much greater changes in intensity with the RCC tumor lesions. Figure 2 shows the corresponding DCE perfusion maps of the same cases presented in Figure 1. For metastatic RCC spinal lesions, Ktrans, Vp, and peak-enhancement showed greater hyperintensity on the DCE perfusion maps when compared to those parameters for metastatic PC spinal lesions.
Figure 1.
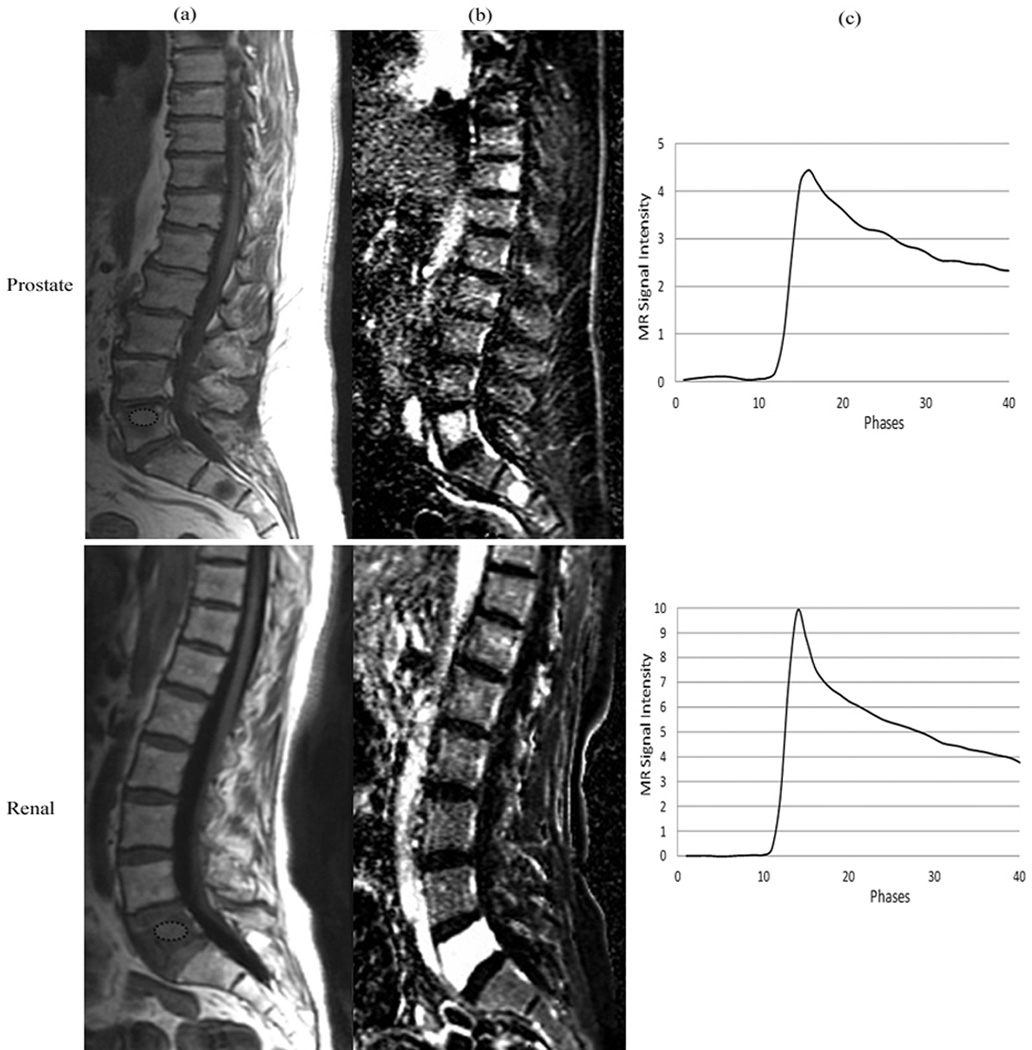
(a) Representative sagittal T1-weighted MR images depicting metastatic spinal lesions (encircled) originating from prostate and renal cell carcinoma. (b) Dynamic images from DCE-MRI illustrating the hyperintensity at the spinal levels that contain metastatic lesions. (c) MRI signal intensity time curves obtained from the region of interest (encircled) in the spinal lesions.
Figure 2.
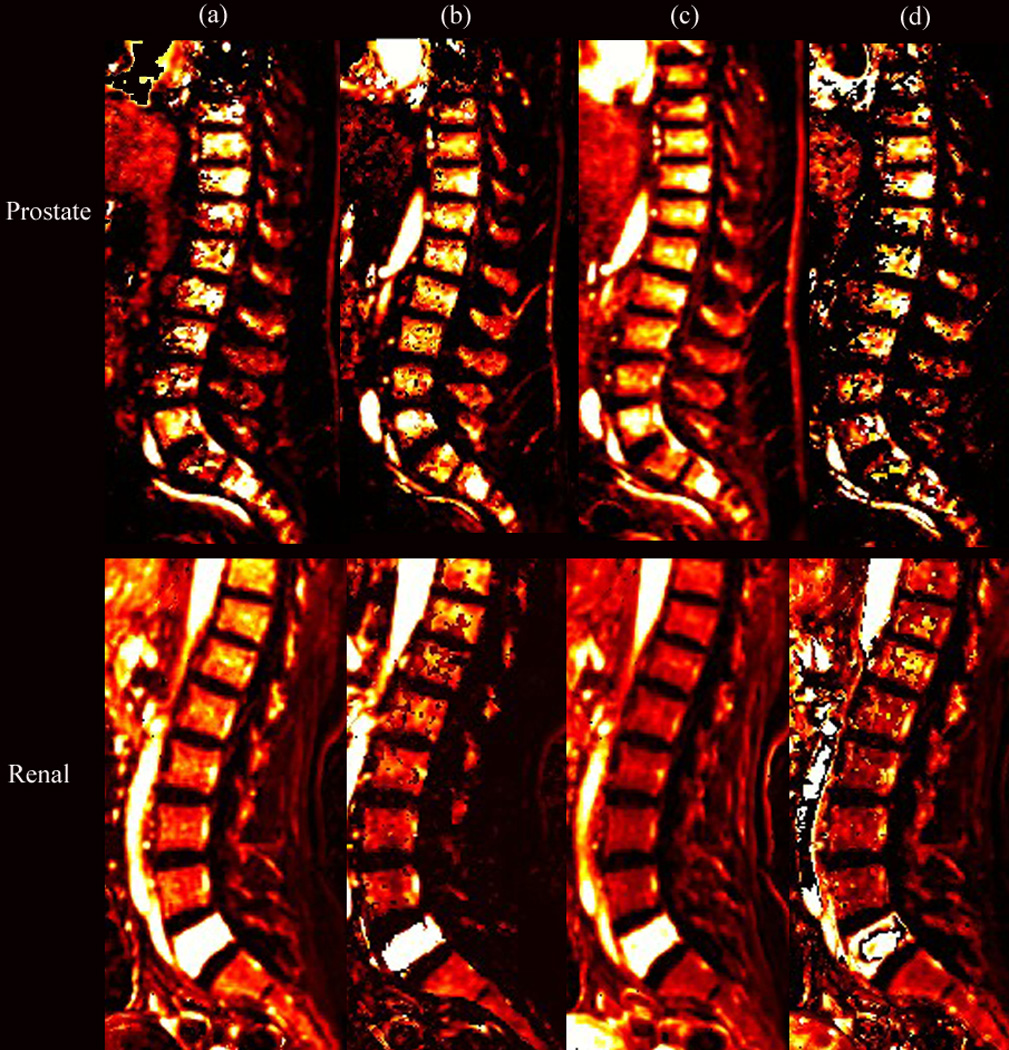
Perfusion maps of (a) Ktrans, (b) Vp, (c) peak-enhancement, and (d) wash-in for the same patients shown in Figure 1, illustrating the hyperintensity at the L5 spinal level, which corresponds to metastatic prostate (PC) and renal cell (RCC) histologies.
The mean and standard deviations of the perfusion parameters from the two histologies are shown in Figure 3. Of the four perfusion parameters, Vp was observed to have the largest difference in mean (µ) between PC (µ=3.29) and RCC (µ=5.92) spinal metastases. This was followed by the peak-enhancement parameter (PC, µ=2.09; RCC, µ=3.42), Ktrans (PC, µ=1.90 (min−1); RCC, µ=2.80 (min−1)), and lastly, the wash-in parameter (PC, µ=2.26; RCC, µ=2.97). A Mann-Whitney U test showed a significant difference between the observed Vp values for metastatic PC and RCC spinal lesions (p≤0.001). Similarly, peak-enhancement was significantly different between the two histologies (p≤0.001), as was Ktrans (p≤0.01). However, the wash-in parameter was not significantly different between the metastatic PC and RCC spinal lesions.
Figure 3.
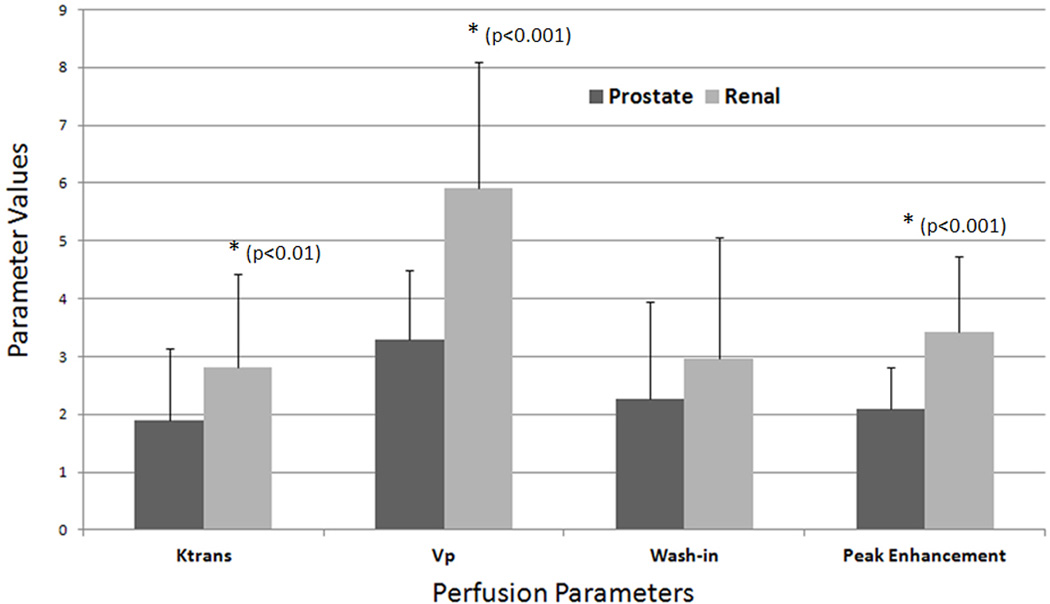
A bar graph illustrating the mean values and standard deviations for the DCE-MRI perfusion parameters Ktrans (1/sec), Vp (1/sec), wash-in, and peak-enhancement in metastatic spinal lesions originating from prostate and renal cell carcinoma. The spinal lesions from prostate carcinoma recorded a µ = 1.90/sec and SD = 1.23/sec for Ktrans, µ = 3.29/sec and SD = 1.19/sec for Vp, µ = 2.26/sec and SD = 1.70/sec for wash-in, and µ = 2.09/sec and SD = 0.73/sec for peak-enhancement. The spinal lesions from renal cell carcinoma recorded a µ = 2.80/sec and SD = 1.62/sec for Ktrans, µ = 5.92/sec and SD = 2.18/sec for Vp, µ = 2.97/sec and SD = 2.09/sec for wash-in, and µ = 3.42/sec and SD = 1.32/sec for peak-enhancement.
The dynamic MR signal response curve, a function of time and concentration of contrast agent in the tumor tissue, is illustrated in Figure 4. The averaged dynamic MR signal response curves obtained from tumor lesion ROIs were shown to be significantly (p≤0.001) different between metastatic PC and RCC spinal lesions.
Figure 4.
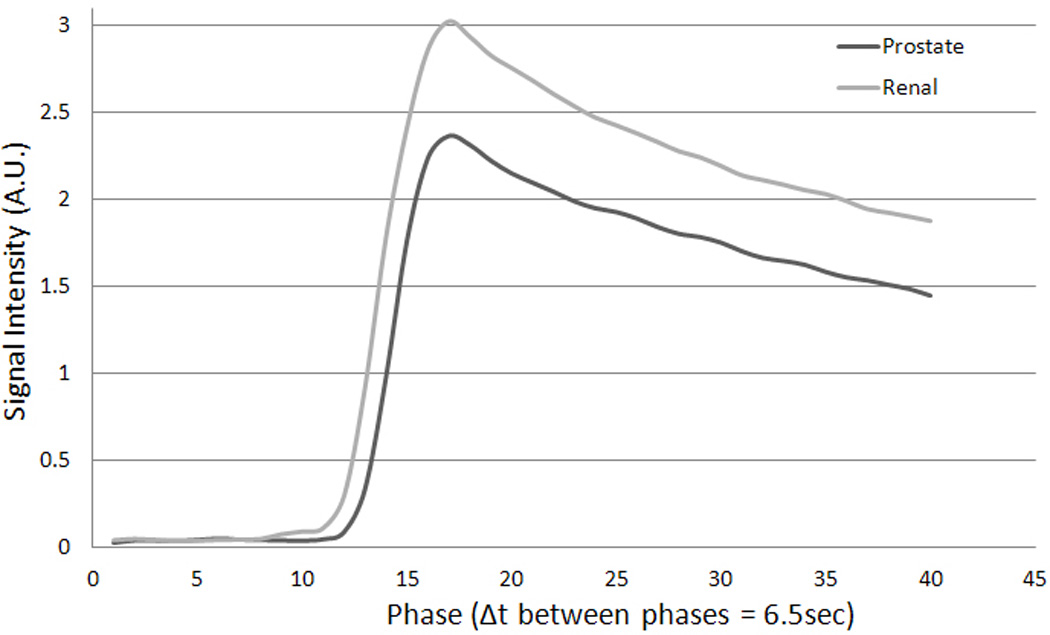
Average dynamic MR signal intensity curves over time (phase) recorded from the region of interest defined for spinal lesions for all prostate (PC) and renal cell (RCC) metastases. The difference in average maximum signal intensities recorded by prostate metastases (2.36) and renal cell metastases (3.02) was 0.66.
The ROC curve, which presents the relationship between the true positive rate and the false positive rate of classifying a lesion, is depicted in Figure 5. Vp recorded the highest area under the curve (AUC; 0.867). Peak-enhancement recorded the second highest AUC (0.821) and was followed by Ktrans (AUC, 0.698) and wash-in (AUC, 0.607).
Figure 5.
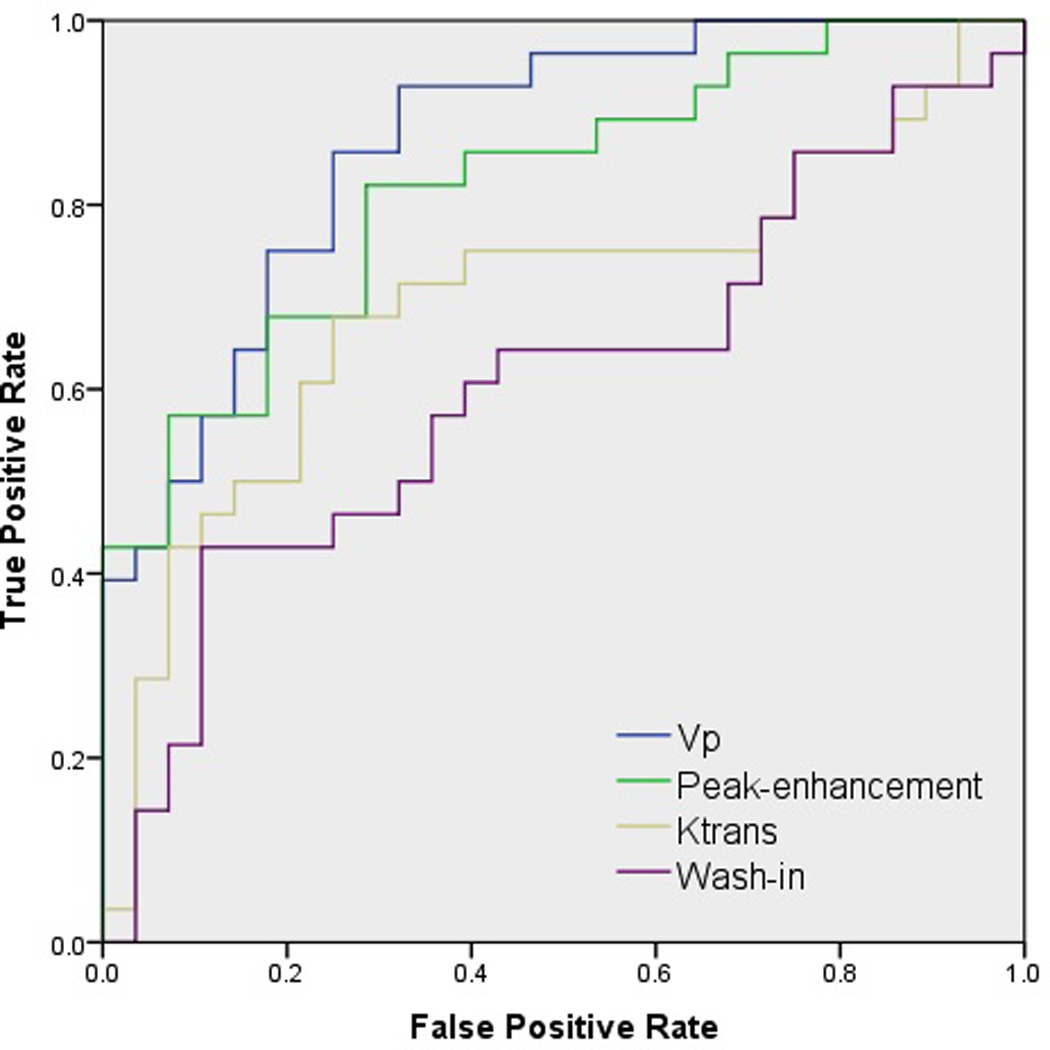
Receiver operating characteristic curves depicting the true positive rate (specificity) and the false positive rate (sensitivity) of DCE-MRI perfusion parameters in classifying metastatic spinal lesions of prostate (PC) and renal cell carcinomas (RCC).
Discussion
The results of our study indicate that the quantitative DCE-MRI perfusion parameters of Ktrans and Vp as well as the semi-quantitative parameter of peak-enhancement can discriminate between metastatic RCC spinal lesions, which are representative of hypervascular neoplasms, and metastatic PC spinal lesions, which are representative of hypovascular neoplasms. Of the four perfusion parameters studied, Vp was shown to be the best discriminator between spinal metastases from PC and RCC, with the mean Vp of RCC metastases being 1.8 times that of the PC lesions. A Mann-Whitney U test also showed a significant difference between the Vp values of PC and RCC metastases to the spine (p≤0.001). The higher values for Vp recorded by RCC metastases to the spine correlates with pathological findings, as RCC is known to be one of the most highly vascularized solid malignancies.24 A similar statistical significance was shown for the perfusion parameter of peak-enhancement (p≤0.001), as the mean peak enhancement for spinal lesions originating from RCC was 1.64 times that of lesions originating from PC. Peak-enhancement, which indicates the peak concentration of contrast agent in the extravascular space, has been shown to be associated with angiogenic markers such as microvascular density and vascular endothelial growth factor (VEGF).25,26 This correlates with our findings, as RCC exhibits increased neovascularization,27 which would thus lead to the higher peak-enhancement values that were recorded in this paper for RCC metastases to the spine, when compared with those recorded for spinal lesions from PC.
The DCE-MRI parameter Ktrans, which represents the rate of blood transfer from the vascular compartment to the extravascular-extracellular space, showed slightly less significance (p≤0·01) in illustrating a difference between the mean vascular permeability of PC and RCC spinal lesions. We also found that Ktrans and Vp of metastatic RCC spinal lesions show a trend towards higher values, when compared to those of metastatic PC spinal lesions. The high Vp recorded in this paper for RCC spinal lesions correlates with the known hypervascular nature of RCC. The trend towards higher Ktrans values in RCC may indicate that RCC and PC have different levels of vascularity, since Ktrans is a measure of vascular permeability. In addition, the Vp and peak-enhancement parameters in this paper also indicate that RCC and PC have different vascularities. The greater vascularity of RCC, when compared with PC, does not imply that RCC must be more permeable than PC. Based on previous a study,22 post-treatment Vp goes down, but Ktrans does not change or changes to a lesser extent, which may not be significant. Leakage does not mean high vascularity. It only means leaky vessels. In other words, vessel density might be normal or low, but whatever is present is leaking.
The ROC curve, which illustrates the performance of perfusion parameters in a binary classification of metastatic spinal lesions, demonstrates that Vp, with an AUC of 0.867, is the most specific and sensitive DCE-MRI parameter in accurately discriminating between PC and RCC metastases to the spine (Figure 5). This is concordant with our finding that Vp had the greatest mean difference between PC and RCC spinal lesions, as well as showing a statistically significant difference in Vp values for the two histologies. Peak-enhancement, which showed the second-greatest mean difference in Vp between RCC and PC neoplasms, closely followed the Vp findings in its classification specificity. Our findings showed wash-in to be the least sensitive and specific parameter in classifying the two histologies, with no statistically significant difference between the wash-in values of metastatic spinal lesions of PC and RCC. This correlated well with the MRI signal intensity curve, from which the wash-in parameter is derived. The dynamic dose response following the rapid injection of contrast agent defines the wash-in phase, and both metastatic PC (slope, 0.54) and RCC (slope, 0.55) spinal lesions illustrated similar slopes that can be seen in Figure 4. Although the wash-in phase was shown to have similar slopes for the two histologies studied, there is a significant difference between the MRI signal intensity curves for post-contrast injection when both the wash-in and wash-out phases are taken into account. This study demonstrates a significant difference (p≤0.001) between the microvasculature of the hypovascular PC and the hypervascular RCC metastases to the spine through the difference between the two histologies in MRI signal intensity curves, which are a function of the concentration of contrast agent in the tumor tissue and the hemodynamic tissue characteristics (Figure 4).
Practical Applications
DCE-MRI seeks to non-invasively characterize tissue vascularity by analyzing the distribution kinetics of the low-molecular-weight paramagnetic contrast agent after intravenous bolus injection in the microvessels and the extravascular-extracellular space of the tissue under review.28,29 Since the local capillary blood supply and the extravasation of contrast agent into the interstitial tissue space leads to a temporal change in signal intensity, DCE-MRI can be used to assess the concentration of contrast agent in tissue, microvessel density, capillary permeability, and perfusion.28
DCE-MRI perfusion imaging provides the ability to non-invasively identify hypervascular lesions and distinguish them from other abnormalities, such as inflammatory lesions, spondylotic changes, marrow changes related to therapy, and non-neoplastic conditions of the marrow that are not adequately differentiated by conventional MRI. As such DCE-MRI perfusion parameters can serve as an important diagnostic and prognostic tool for cancerous lesions, thereby significantly affecting the management of patients with cancer. Pre-surgical assessments of a spinal lesion via DCE-MRI would allow surgeons to determine if pre-operative tumor embolization is required to decrease intraoperative blood loss. Furthermore, DCE-MRI could serve as a surrogate biomarker for assessing response to anti-angiogenic and radiation therapy before the development of structural changes on routine MRI.9 Early identification of treatment failure allows for modification of treatment and personalized treatments, both of which would improve therapy outcomes. This study shows that perfusion imaging can help identify viable tumors from non-viable tumors and treatment-related changes of the marrow (Figure 6). Patients with unknown spinal lesions may benefit from DCE-MRI, as it non-invasively measures hemodynamic characteristics and can differentiate tumors from various non-neoplastic processes that alter the appearance of marrow. DCE-MRI would also be helpful in pediatric population that has abundant red marrow, which limits detection of neoplastic infiltration of marrow on standard MRI.8
Figure 6.
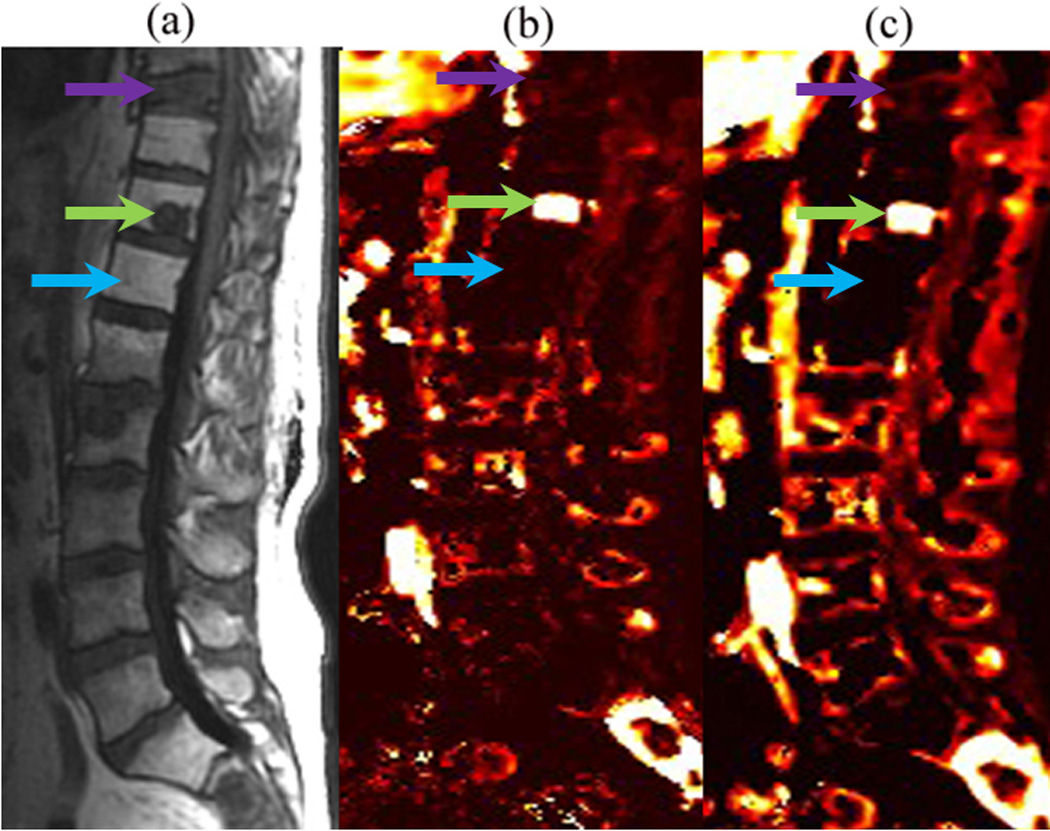
(a) Sagittal T1-weighted conventional MR image, (b) Vp, and (c) Ktrans illustrating a viable tumor (green arrow) in the T11 spinal level of a patient who had prior radiation. Note the decreased perfusion of a nonviable tumor (purple arrow) and normal marrow in the radiation field (blue arrow).
The DCE-MRI technique has several limitations. To apply a pharmacokinetic model for quantitative analysis, both the precontrast T1 value and AIF need to be accurately measured. In the design of DCE-MRI study, competing demands for high spatial resolution, acquisition coverage, and signal-to-noise result in inadequate temporal resolution (∆t between phases) for reliable measurement of the AIF. Low sampling rate due to low temporal resolution can affect the time course of AIF and initial contrast agent wash-in.
Semi-quantitative parameters including peak enhancement and wash-in do not have simple relationship to the physiological parameters of interest (permeability and tissue perfusion). On the other hand, quantitative parameters such as Ktrans describe the leakage rate of the contrat agent. For blood vessels where leakage is rapid, perfusion will determine contrast agent distribution and Ktrans approximates to tissue blood flow per unit volume. However, the model based parameters has a limitation that kinetic models may not exactly fit the DCE-MRI data observed, because the models make assumptions that may not be valid for specific tumor type or every tissue. In this study only 2 prototypical hypervascular renal and hypovascular prostate lesions were included. Future studies to include additional different types of spinal metastases would provide more useful clinical implications.
Conclusion
There is a statistically significant difference between hypovascular and hypervascular perfusion indices of spinal metastasis. Non-invasive identification of tumor vascularity has important clinical implications and can lead to changes in patient management that could potentially improve outcomes.
Acknowledgements
Authors thank Sandhya George (Editor) for editing the manuscript.
Footnotes
The manuscript submitted does not contain information about medical device(s)/drug(s). No funds were received in support of this work. Relevant financial activities outside the submitted work: consultancy, payment for lectures, travel/accommodations/meeting expenses.
References
- 1.Nguyen Q, Shiu AS, Rhines LD, et al. Management of spinal metastases from renal cell carcinoma using stereotactic body radiotherapy. International Journal of Radiation Oncology Biology Physics. 2010;76(4):1185–1192. doi: 10.1016/j.ijrobp.2009.03.062. [DOI] [PubMed] [Google Scholar]
- 2.Schaberg J, Gainor BJ. A profile of metastatic carcinoma of the spine. Spine. 1985;10(1):19–20. doi: 10.1097/00007632-198501000-00003. [DOI] [PubMed] [Google Scholar]
- 3.Gerszten PC, Germanwala A, Burton SA, Welch WC, Ozhasoglu C, Vogel WJ. Combination kyphoplasty and spinal radiosurgery: a new treatment paradigm for pathological fractures. Journal of Neurosurgery: Spine. 2005;3(4):296–301. doi: 10.3171/spi.2005.3.4.0296. [DOI] [PubMed] [Google Scholar]
- 4.Brawley OW. Prostate cancer epidemiology in the United States. World J Urol. 2012;30(2):195–200. doi: 10.1007/s00345-012-0824-2. [DOI] [PubMed] [Google Scholar]
- 5.Yoshino S, Kato M, Okada K. Prognostic significance of microvessel count in low stage renal cell carcinoma. International Journal of Urology. 1995;2(3):156–160. doi: 10.1111/j.1442-2042.1995.tb00445.x. [DOI] [PubMed] [Google Scholar]
- 6.Sternberg CN, Davis ID, Mardiak J, et al. Pazopanib in locally advanced or metastatic renal cell carcinoma: results of a randomized phase III trial. Journal of Clinical Oncology. 2010;28(6):1061–1068. doi: 10.1200/JCO.2009.23.9764. [DOI] [PubMed] [Google Scholar]
- 7.Zhou XJ, Leeds NE, McKinnon GC, Kumar AJ. Characterization of benign and metastatic vertebral compression fractures with quantitative diffusion MR imaging. Am J Neuroradiol. 2002;23(1):165–170. [PMC free article] [PubMed] [Google Scholar]
- 8.Moulopoulos L, Maris T, Papanikolaou N, Panagi G, Vlahos L, Dimopoulos M. Detection of malignant bone marrow involvement with dynamic contrast-enhanced magnetic resonance imaging. Annals of oncology. 2003;14(1):152–158. doi: 10.1093/annonc/mdg007. [DOI] [PubMed] [Google Scholar]
- 9.Montazel J, Divine M, Lepage E, Kobeiter H, Breil S, Rahmouni A. Normal Spinal Bone Marrow in Adults: Dynamic Gadolinium-enhanced MR Imaging1. Radiology. 2003;229(3):703–709. doi: 10.1148/radiol.2293020747. [DOI] [PubMed] [Google Scholar]
- 10.Puech P, Potiron E, Lemaitre L, et al. Dynamic Contrast-enhanced–magnetic Resonance Imaging Evaluation of Intraprostatic Prostate Cancer: Correlation with Radical Prostatectomy Specimens. Urology. 2009;74(5):1094–1099. doi: 10.1016/j.urology.2009.04.102. [DOI] [PubMed] [Google Scholar]
- 11.O'Connor JP, Jackson A, Parker GJ, Jayson GC. DCE-MRI biomarkers in the clinical evaluation of antiangiogenic and vascular disrupting agents. Br J Cancer. 2007;96(2):189–195. doi: 10.1038/sj.bjc.6603515. [DOI] [PMC free article] [PubMed] [Google Scholar]
- 12.Mazura JC, Patsalides A, Pauliah M, Peck K, et al. Proceedings of the Annual Symposium. New York: ASNR; 2012. Spinal Blood Flow Maps, a Minimally Invasive Alternative to Spinal Angiography in the Evaluation of Extramedullary Spinal Tumors. [Google Scholar]
- 13.De Bruyne S, Van Damme N, Smeets P, et al. Value of DCE-MRI and FDG-PET/CT in the prediction of response to preoperative chemotherapy with bevacizumab for colorectal liver metastases. Br J Cancer. 2012;106(12):1926–1933. doi: 10.1038/bjc.2012.184. [DOI] [PMC free article] [PubMed] [Google Scholar]
- 14.Kneeshaw P, Turnbull L, Smith A, Drew P. Dynamic contrast enhanced magnetic resonance imaging aids the surgical management of invasive lobular breast cancer. European Journal of Surgical Oncology (EJSO) 2003;29(1):32–37. doi: 10.1053/ejso.2002.1391. [DOI] [PubMed] [Google Scholar]
- 15.Drew P, Kerin M, Mahapatra T, et al. Evaluation of response to neoadjuvant chemoradiotherapy for locally advanced breast cancer with dynamic contrast-enhanced MRI of the breast. European Journal of Surgical Oncology (EJSO) 2001;27(7):617–620. doi: 10.1053/ejso.2001.1194. [DOI] [PubMed] [Google Scholar]
- 16.Johansen R, Jensen LR, Rydland J, et al. Predicting survival and early clinical response to primary chemotherapy for patients with locally advanced breast cancer using DCE-MRI. Journal of Magnetic Resonance Imaging. 2009;29(6):1300–1307. doi: 10.1002/jmri.21778. [DOI] [PubMed] [Google Scholar]
- 17.Pauliah M, Saxena V, Haris M, Husain N, Rathore RKS, Gupta RK. Improved T1-weighted dynamic contrast-enhanced MRI to probe microvascularity and heterogeneity of human glioma. Magn Reson Imaging. 2007;25(9):1292–1299. doi: 10.1016/j.mri.2007.03.027. [DOI] [PubMed] [Google Scholar]
- 18.Khadem N, Karimi S, Peck K, et al. Characterizing Hypervascular and Hypovascular Metastases and Normal Bone Marrow of the Spine Using Dynamic Contrast-Enhanced MR Imaging. Am J Neuroradiol. 2012;33(11):2178–2185. doi: 10.3174/ajnr.A3104. [DOI] [PMC free article] [PubMed] [Google Scholar]
- 19.Erlemann R, Reiser M, Peters P, et al. Musculoskeletal neoplasms: static and dynamic Gd-DTPA--enhanced MR imaging. Radiology. 1989;171(3):767–773. doi: 10.1148/radiology.171.3.2717749. [DOI] [PubMed] [Google Scholar]
- 20.Bollow M, Knauf W, Korfel A, et al. Initial experience with dynamic MR imaging in evaluation of normal bone marrow versus malignant bone marrow infiltrations in humans. Journal of Magnetic Resonance Imaging. 1997;7(1):241–250. doi: 10.1002/jmri.1880070138. [DOI] [PubMed] [Google Scholar]
- 21.Tokuda O, Hayashi N, Taguchi K, Matsunaga N. Dynamic contrast-enhanced perfusion MR imaging of diseased vertebrae: analysis of three parameters and the distribution of the time-intensity curve patterns. Skeletal Radiol. 2005;34(10):632–638. doi: 10.1007/s00256-005-0949-0. [DOI] [PubMed] [Google Scholar]
- 22.Chu S, Karimi S, Peck KK, et al. Measurement of blood perfusion in spinal metastases with dynamic contrast-enhanced magnetic resonance imaging: evaluation of tumor response to radiation therapy. Spine. 2013;38(22):E1418–E1424. doi: 10.1097/BRS.0b013e3182a40838. [DOI] [PMC free article] [PubMed] [Google Scholar]
- 23.Sourbron SP, Buckley DL. On the scope and interpretation of the Tofts models for DCE- MRI. Magnetic Resonance in Medicine. 2011;66(3):735–745. doi: 10.1002/mrm.22861. [DOI] [PubMed] [Google Scholar]
- 24.Slaton JW, Inoue K, Perrotte P, et al. Expression levels of genes that regulate metastasis and angiogenesis correlate with advanced pathological stage of renal cell carcinoma. The American Journal of Pathology. 2001;158(2):735–743. doi: 10.1016/S0002-9440(10)64016-3. [DOI] [PMC free article] [PubMed] [Google Scholar]
- 25.Hylton N. Dynamic contrast-enhanced magnetic resonance imaging as an imaging biomarker. Journal of Clinical Oncology. 2006;24(20):3293–3298. doi: 10.1200/JCO.2006.06.8080. [DOI] [PubMed] [Google Scholar]
- 26.Shih TT, Hou H, Liu C, et al. Bone marrow angiogenesis magnetic resonance imaging in patients with acute myeloid leukemia: peak enhancement ratio is an independent predictor for overall survival. Blood. 2009;113(14):3161–3167. doi: 10.1182/blood-2008-08-173104. [DOI] [PubMed] [Google Scholar]
- 27.Lidgren A, Hedberg Y, Grankvist K, Rasmuson T, Vasko J, Ljungberg B. The expression of hypoxia-inducible factor 1α is a favorable independent prognostic factor in renal cell carcinoma. Clinical Cancer Research. 2005;11(3):1129–1135. [PubMed] [Google Scholar]
- 28.Verstraete KL, Woude HVd, Hogendoorn PC, De Deene Y, Kunnen M, Bloem JL. Dynamic contrast-enhanced MR imaging of musculoskeletal tumors: Basic principles and clinical applications. Journal of Magnetic Resonance Imaging. 1996;6(2):311–321. doi: 10.1002/jmri.1880060210. [DOI] [PubMed] [Google Scholar]
- 29.Alonzi R, Padhani AR, Allen C. Dynamic contrast enhanced MRI in prostate cancer. Eur J Radiol. 2007;63(3):335–350. doi: 10.1016/j.ejrad.2007.06.028. [DOI] [PubMed] [Google Scholar]


