Abstract
Experience-dependent formation of synaptic input clusters can occur in juvenile brains. Whether this also occurs in adults is largely unknown. We previously reconstructed the normal and learned circuits of prism-adapted barn owls and found that changes in clustering of axo-dendritic contacts (putative synapses) predicted functional circuit strength. Here we asked whether comparable changes occurred in normal and prism-removed adults. Across all anatomical zones, no systematic differences in the primary metrics for within-branch or between-branch clustering were observed: 95–99% of contacts resided within clusters (<10–20 microns from nearest neighbor) regardless of circuit strength. Bouton volumes, a proxy measure of synaptic strength, were on average larger in the functionally strong zones, indicating that changes in synaptic efficacy contributed to the differences in circuit strength. Bootstrap analysis showed that the distribution of inter-contact distances strongly deviated from random not in the functionally strong zones but in those that had been strong during the sensitive period (60d ~ 250d), indicating that clusters formed early in life were preserved regardless of current value. While cluster formation in juveniles appeared to require the production of new synapses, cluster formation in adults did not. In total, these results support a model in which high cluster dynamics in juveniles sculpt a potential connectivity map that is refined in adulthood. We propose that preservation of clusters in functionally weak adult circuits provides a storage mechanism for disused but potentially useful pathways.
1. INTRODUCTION
Encoding of learned skills is thought to involve a combination of changes in synaptic connectivity, synaptic weights and the integrative properties of neurons. The relative contribution of each mechanism may differ across circuits and over time due to physical differences between developing, juvenile and adult brains. One unifying model is the input clustering hypothesis (Mel, 1992, Poirazi and Mel, 2001), also referred to as synaptic clustering or the clustered plasticity model (reviewed in Govindarajan et al., 2006, DeBello, 2008, Larkum and Nevian, 2008, Branco and Hausser, 2010, Magee, 2011, Winnubst and Lohmann, 2012). It states that learned information can be stored through spatial clustering of functionally related synaptic inputs on individual branches of dendrite, enabling supralinear summation that strengthens the postsynaptic response. Tests of this idea using diverse techniques and brain systems have recently emerged with heavy emphasis on juvenile brains (reviewed in DeBello et al., 2014) Yet the microstructural changes needed to drive the formation or dissolution of input clusters are observed in both juveniles and adults (Holtmaat and Svoboda, 2009), raising the question of whether such dynamics are harnessed to modify clustering patterns in adults.
The barn owl auditory localization pathway is well suited for investigating this issue. Owls reared wearing prismatic spectacles (Knudsen and Brainard, 1991) develop a new, learned microcircuit (DeBello et al., 2001) that drives adaptive auditory orienting behavior. At the same time, the normal microcircuit becomes functionally weak, yet is preserved anatomically – the neural trace of a now dormant skill (Knudsen, 2002). The axonal inputs and target dendrites of each circuit can be identified on the basis of topographic position within the external nucleus of the inferior colliculus (ICX). This provides a before and after snapshot of learning within the same block of tissue (Fig. 1).
Figure 1. Experimental design.
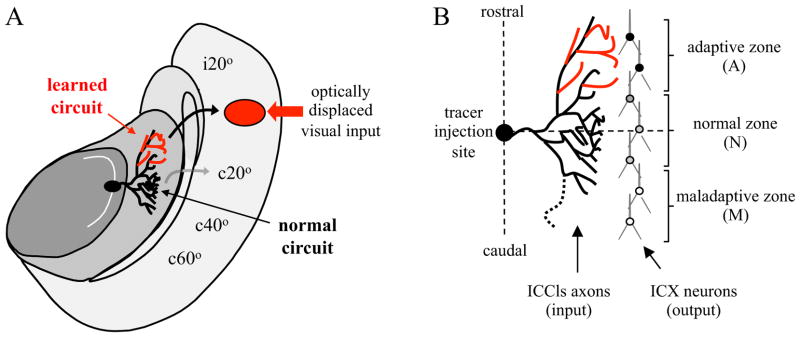
A, Diagram of horizontal section through the R midbrain of a prism-adapted owl. Neurons in the central nucleus of the inferior colliculus (ICC) are tuned to distinct values of interaural time difference (ITD) and arranged topographically to form a map, indicated by the curved arrow located in the lateral shell of the ICC (ICCls). ITDs corresponding to ipsilateral space are represented in the rostral pole and ITDs corresponding to progressively more contralateral space towards the caudal pole. ICCls neurons project to the external nucleus of the inferior colliculus (ICX) where a complete map of auditory space is assembled. The axonal projection labeled by focal injection of anterograde tracer at c50 μs ITD is depicted. Black and red lines depict the normal and learned circuits. Major postsynaptic targets of these axons are CaMKII+ space-specific neurons in ICX (depicted in B). Curved arrows indicate the projection of CaMKII+ neurons to the OT where the auditory space map aligns with a visual space map. An ITD of 50 μs corresponds to 20° azimuth in visual space. In both ICX and OT, ipsilateral space is represented in the rostral pole and contralateral space progressively towards the caudal pole. Red arrow indicates the location of optically displaced visual input arising from a stimulus located 20° to the owl’s left (for illustration; actual prisms used were 19°). After full adaptation, depicted here, the learned circuit drives strong responses in ICX which are conveyed to the appropriate location in OT (black arrow), whereas the persistent normal circuit drives weak responses in ICX which are conveyed to the non-displaced location in OT (grey arrow). Following prism removal, the normal responses are re-expressed and the learned responses suppressed (see Figures 2 and 4). B, Microanatomical analysis in a prism-adapted owl. Contacts between tracer-labeled axons and CaMKII+ dendrites are distributed across the entire rostrocaudal extent of the axonal arbor, ~ 2mm, and with similar bulk density within the adaptive and normal zones. Nonetheless, in response to auditory stimulus and co-activation of these synapses, the postsynaptic cells located in the adaptive zone respond most strongly.
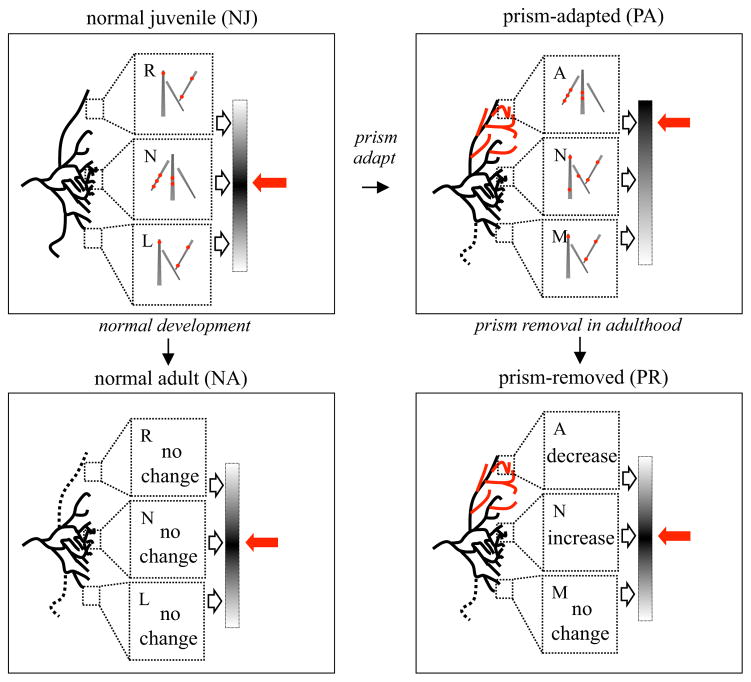
We previously used in vivo electrophysiological mapping and retrospective confocal microscopy to measure circuit strength and input clustering in two experimental groups: normal juveniles and prism-adapted owls up through the age of sexual maturity (Fig. 2). In all topographic zones and across both groups, the pattern of input clustering mirrored functional circuit strength (McBride et al., 2008). These results are consistent with the model and provided the first direct demonstration that clustering patterns can adjust in accordance with behaviorally relevant learning signals.
Figure 2. Experimental groups.
Results from a previous study on normal juveniles (NJ) and prism-adapted owls (PA) are depicted in the top panels, and the predictions for normal adult and prism-removed owls are depicted in the bottom panels. In all cases the normal zone (N) is centered at the level of the injection site. Rostral is the right space zone (R; for normal owls), which corresponds to the adaptive zone (A) for prism owls. Caudal is the left space zone (L; for normal owls) or corresponding maladaptive zone (M) for prism owls. These diagrams represent the right side of the brain and right-shifting prisms; zones are inverted on the left side. Axo-dendritic contact clustering is represented by the distribution of contacts (red dots) along a population of dendrites within high magnification image fields. Top left, The projection in normal juveniles (NJ) drives strong responses in the normal zone as depicted by the graded output bar on the right. This matches the location of the non-displaced visual input (red arrow). The previous study found more clustering in the normal zone than in the flanking zones. Top right, The projection in PA owls contains the elaborated learned zone (red lines), the persistent normal zone (black lines) and the slightly winnowed maladaptive zone (dotted line). Clustering in the adaptive zone was greater than in the normal and maladaptive zones, the flanking zones of NJ, and similar to that observed in the normal zone of NJ. Bottom left, During normal development there is slight winnowing on both flanks of the projection. For these normal adults (NA), the model predicts more clustering in the normal than in the flanking zones i.e. no change from the NJ configuration. Bottom right, In contrast, for prism-removed (PR) owls, the model predicts a decrease in clustering in the adaptive zone and an increase in the normal zone (both compared to PA), to match the re-expression of normal functional output as specified by the non-displaced visual input.
Here we extend this analysis to normal and prism-removed adults (Fig. 2). When prisms are removed from owls that have continuously adapted throughout the juvenile sensitive period and beyond, auditory tuning reverts to normal (Brainard and Knudsen, 1998). We hypothesized that weakening of the prism-induced learned circuit is associated with decreased input clustering, and strengthening of the dormant normal circuit with increased clustering. The latter was observed; the former was not. Close spacing of contacts was present across all topographic zones in both experimental groups. These results are not entirely consistent with the idea that changes in clustering drive refinement of procedural skills in the adult brain. However, the fact that the brain preserves even maladaptive clusters supports the idea that they have long-term adaptive value.
2. MATERIALS AND METHODS
2.1. Animals
15 barn owls (Tyto alba) of both sexes were used in this study. Animals were housed in aviaries and cared for in accordance with the UC Davis animal care policy.
2.2. Prism rearing
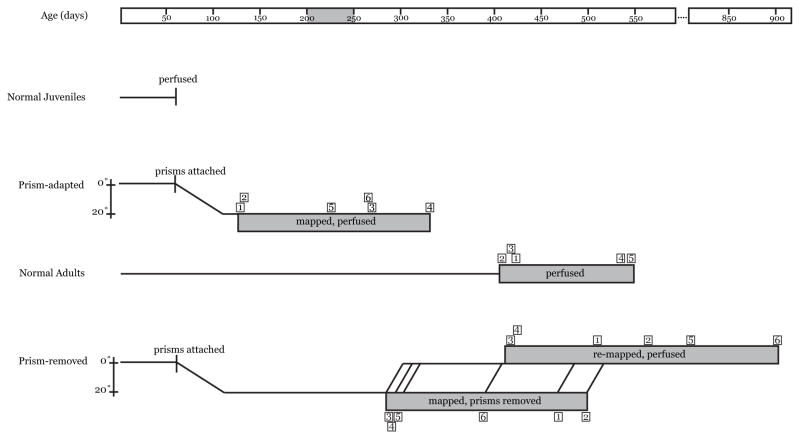
Owls were hatched in captivity or collected from the wild at young ages (<40d). Five normal adults (NA) and six prism-removed owls (PR) completed the multi-year experimental paradigm. They were raised together in large flight rooms from the age of fledging, ~60–70d. At this age, PR owls received fresnel lenses with 19° lateral displacement (prisms), reversibly attached to headgear surgically mounted on the skull. Details of the surgical procedure can be found in (Swofford and DeBello, 2007). In the flight rooms all owls hunted live mice, flew to perches and interacted with each other, natural experience that drives both normal development and adaptive adjustments to prisms. The PR owls were first mapped in young adulthood to confirm auditory tuning shifts. Prisms were removed at various times in adulthood. After 1 to 17 months without prisms, individuals were re-mapped to confirm re-expression of normal auditory tuning and then sacrificed for clustering analysis. The schematic and timeline presented in Figures 2 and 3 include experiments presented in this study and those from a previous study that focused on normal juvenile (NJ) and prism-adapted (PA) owls, all of substantially younger ages.
Figure 3. Timeline.
Owls reach adult head size at ~45d and fledge at 60–70d. This age represents the initial state of the auditory space map. Grey bar indicates the age of sexual maturity, 200–250d. Timelines for all individual owls (small boxed numbers) in each of four experimental groups are shown. Prisms were mounted at 60–70d. Prism-adapted owls (previous study) were analyzed only after full adaptation, which typically requires two months. Prism-adapted owls were late juveniles up through the age of sexual maturity at the time of anatomical analysis. In contrast, normal adults (this study) and prism-removed adults (this study) were considerably older. Prism-removed adults were mapped to confirm adaptive shifts and re-mapped after prism removal to confirm re-expression of normal responses. For prism-removed adults, the durations of prism experience ranged from 223 to 442 days and durations of prism-removal from 37 to 516 days.
2.3. Electrophysiology
For mapping, prisms were temporarily removed and the owls secured in a stereotax located within an anechoic chamber. Auditory stimuli were presented through a free-field speaker array (4° separation), and visual stimuli by hand-held projection onto a co-aligned tangent screen made of acoustically transparent cloth. Neural responses were recorded using platinum-iridium electrodes of 1–5Mohm impedance (Thomas Recording, Germany) and digitized using Spike2 software (CED, Cambridge, England). Recordings were focused on the deep layers of the optic tectum (OT), where individual neurons exhibit sharp spatial tuning for both auditory and visual stimuli. The auditory map in deep OT is inherited from monosynaptic connections originating in the external nucleus of the inferior colliculus (ICX), the main site of plasticity. For each recording site in prism-adapted and prism-removed owls, adaptive shift was calculated as the (weighted average of auditory spatial tuning in microseconds) × 2.5 – (center of the visual receptive field in degrees).
2.4. In vitro anterograde tracing and immunohistochemistry (IHC)
Axons were labeled by focal injection of anterograde tracer into the lateral shell of the central nucleus of the inferior colliculus (ICCls). Injections were performed in acute brain slices to facilitate targeting and uniformity of injection size. Tracers were micro-Ruby and Texas Red Dextran (Invitrogen/Molecular Probes catalog # D-7162 and D-3328). Injections were targeted to the representation of frontal space, from ~ 0 to c30 μs. To allow for anterograde transport, slices were incubated in carbogen-bubbled normal ACSF for 1–2 hours, fixed in 4% paraformaldehyde, sunk in sucrose, re-sectioned at 30–40 μm on a freezing microtome, placed in 0.1 M PB and processed for immunoreactivity to CaMKIIα (mouse anti-CaMKIIα, clone 6G9, subtype IgG1; Chemicon, Temecula, CA), which is known to provide a near Golgi-like fill of the target dendrites in ICX. Details of the slice preparation and injection procedure can be found in (Rodriguez-Contreras et al., 2005) and (McBride et al., 2008).
2.5. Confocal imaging and digital processing
Imaging was performed on a Zeiss LSM 510 META Confocal Microscope (Carl Zeiss, Inc., Germany) using a 63x oil-immersion objective (Plan Apochromat; numerical aperture, 1.4; Olympus oil, refractive index 1.515). Images were deconvolved using Hyugens Professional 2.9 (SVI). Criteria for field selection and parameters for confocal imaging and image deconvolution settings were as described in (McBride et al., 2008). A case blind observer performed Field selection and analysis.
2.6. Clustering Analysis
Image analysis was performed using Volocity 5.0.1 (Improvision, Coventry, UK) running on a 64-bit dual processor Dell T3400. In the previous study, image stacks were subdivided into quadrants for analysis due to limitations in the program’s working capacity. In this study using a newer version of the software, this was not necessary. Therefore the analyzed volumes were 96×96×10 microns, four times larger than in McBride et al., 2008 and the maximum detectable inter-contact distance was 136 μm, compared with 68 μm in McBride et al., 2008.
To locate sites of contact between tracer-labeled axons and CaMKIIα neurons, three-dimensional profiles were generated using a lower threshold intensity value of 10. Each contiguous axon and dendritic plexus was isolated as a separate object using the classifier tools. Sites of overlap between axon and dendrite were identified by the presence of double-labeled voxels at their interface. To exclude overlap objects representing close passes of axon and dendrite not in physical contact, objects were required to meet an empirically determined minimum size threshold (Rodriguez-Contreras et al., 2005): objects smaller than 4 voxels were discarded. The utility of this interface thickness criterion is supported by correlative LM-EM studies. Immunoelectron microscopy of representative contacts in owl ICX revealed true synapses made between tracer-labeled axons and the dendrites of CaMKII+ neurons (Rodriguez-Contreras et al., 2005). In a larger-scale study of thalamic synapses made onto layer 4 spiny stellate cells in cat visual cortex, contacts were identified at the LM level whenever a gap could not be discerned between axon and dendrite (da Costa and Martin, 2011). At the EM level, fully half of the false positives were found not to be in contact. The interface thickness criterion applied to our primary data should exclude these false positives, reducing the rate to a tolerable percentage in the context of tradeoff between high-throughput and high-resolution mapping. A related methodological consideration is immunohistochemical detection of synaptic markers. In juvenile owls 59% of axo-dendritic contacts co-localized with staining for the postsynaptic protein Homer1. The same antibody applied to adult tissue, however, produced poor labeling with far fewer punctae (Supplementary Figure S1). Therefore, Homer1 co-localization was not used as a criterion for synapse identification because it would have produced an unacceptably high false negative rate.
Vetted contacts were indexed to their parent axon and dendritic branch. The skeletal length of each dendrite was measured. When multiple contacts occurred on the same branch, inter-contact distance (ICD) was determined as the straight-line distance from one contact to its nearest neighbor. Because the dendritic segments analyzed were nearly linear, this value closely approximated the distance between contacts measured along the dendritic path. More complete description of these procedures can be found in (Rodriguez-Contreras et al., 2005) and (McBride et al., 2008).
2.7. Determination of microanatomical zones
The rostrocaudal location of each high-resolution image field was determined from wide-field images (5x objective) obtained on a Zeiss Axioscope 2 FS. A contour delineating the auditory space map in ICX was made by tracing a curved line through the region of highest CaMKII intensity, from rostral to caudal pole. A radial projection from the center of the injection site in ICCls was traced to this ICX contour. The rostrocaudal location of each 63x image field (outlined by modest photobleaching that had occurred during confocal acquisition) was measured as the distance along the contour between its center and the projected location of the injection site.
2.8. Bootstrap Analysis
To investigate deviations in clustering from that expected from a random distribution of contacts, the pool of dendrites receiving multiple contacts was isolated for each zone and the location of each contact was randomized. Bootstrap was performed 10,000 times to generate simulated ICD distributions for comparison to data distributions. Each simulated distribution (n=1,000) was compared to data using a Kolmorogov-Smirnoff test. The D statistic from this test indicates the magnitude of deviation from random distribution. The distributions of D statistics were used to compare across zones using a Student’s t-test. Within a zone, the D statistics were used to compute p values, the median of which is reported.
2.9. Between-Branch Targeting
To analyze between-branch targeting, the skeletal length of each dendrite, whether or not it received contacts, was measured from tip to nearest branchpoint or to the cell body for proximal branches. Four metrics were calculated: Between Branch Dispersion (BBD) is the number of branches receiving only one contact per total number of branches receiving any contacts. Branch Occupancy Fraction (BOF) is the number of branches receiving any contacts per total number of branches. Mean Density of Occupied Branches (MDOB) is the total number of contacts per total number of branches receiving contacts. Mean Density on All Branches (MDAB) is the total number of contacts per total number of branches.
2.10. Bouton volume measurements
Boutons were identified as swellings no longer than 3 μm with a diameter at least 1.5 times greater than that of the adjoining axon. The long axis was manually traced as the beginning and end of each swelling, and the length, width and height were used to calculate volume using the standard formula for ellipsoids.
3. RESULTS
3.1. Adaptive adjustments in auditory tuning in prism-removed (PR) owls
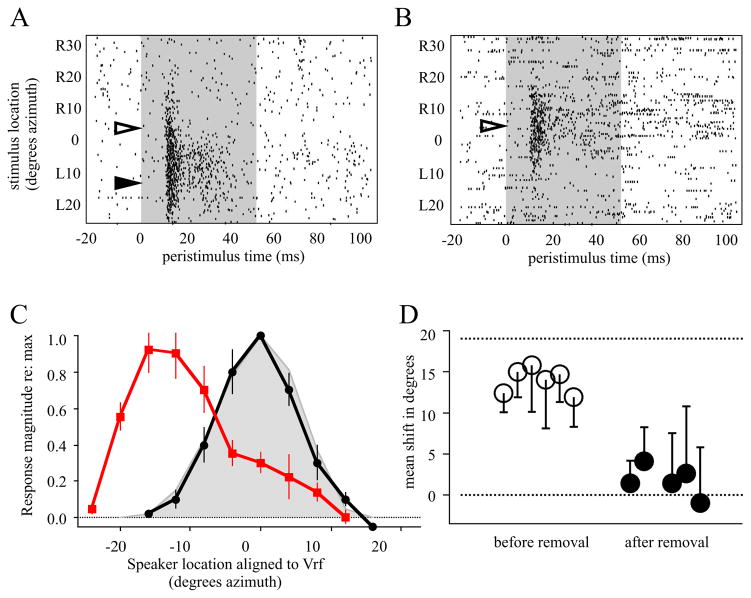
Electrophysiological surveys were conducted on PR adults following each new epoch of prism experience (see Fig. 3 for timeline). Auditory tuning at a representative site in the OT after full adaptation to prisms (Fig. 4A) and 75 days after prism removal (Fig. 4B) are shown. The adaptive shift back to normal tuning involved both strengthening of the normal response and weakening (complete suppression at this site) of the previously learned response. Population tuning curves (Fig. 4C) for owl PR3 confirm that the shift back to normal is complete and robust across sites. The mean adaptive shift before and after prism removal is shown for all six PR owls in Fig. 4D. Consistent with previous studies, the magnitude of adaptive shifts prior to removal was ~70–80% of that expected from the optical displacement, 19° in these experiments, whereas the shift back to normal alignment was reliably complete.
Figure 4. Electrophysiological mapping.
A, Raster plot of auditory tuning in an owl adapted to R19° prisms. Shaded region indicates duration of sound stimulus, action potentials are represented by ticks. The visual receptive field was centered at R4° (open arrowhead), which predicts auditory responses at L13° (solid arrowhead) for full adaptation. At this time point learned responses were strong while normal responses were weak to modest. B, Recording from the same owl 75d after prism removal. The visual receptive field was centered at R5° (open arrowhead). The previously learned responses were no longer expressed, and strong normal responses had been re-expressed. C, Population tuning curves for owl PR3. Each curve was normalized to maximum response and aligned to the visual receptive field (Vrf) measured with prisms off. Error bars are standard error. Red, mapping prior to prism removal. Black, maping 75d after prism removal. Grey, composite for normal adult owls (data from this and other studies). D, Mean adaptive shifts for owls prior to prism removal (n=6, open circles) and after (n=5, filled circles). Error bars are standard deviation.
3.2. Visualization and analysis of axodendritic contacts
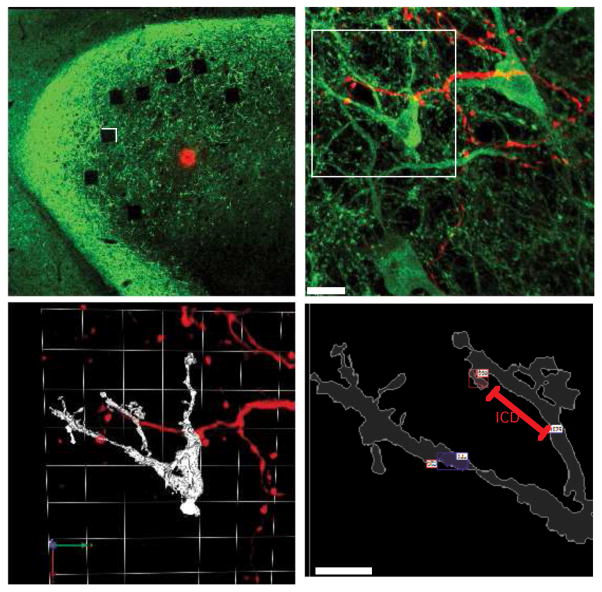
Primary data for anatomical analysis are shown in Fig. 5. Consistent with previous results in juveniles, antibodies to CaMKIIα (6G9 clone) labeled the complete somatodendritic architecture of a subset of neurons in the external nucleus of the inferior colliculus (ICX). The density and quality of label, and fine details of dendritic structure, were indistinguishable from that observed in juveniles. Likewise, focal injection of anterograde tracer in the lateral shell of the central nucleus of the inferior colliculus (ICCls) labeled axonal projection that terminated within the CaMKII+ region of ICX. Axo-dendritic contacts were profuse in this region.
Figure 5. Labeling and analysis of the axo-dendritic interface.
A, Low magnification image of a horizontal section through L midbrain of a prism-removed adult. The injection site (red dot) is in the ICCls at the representation of ~ 20 μs. The labeled axons, not easily visible at this magnification, terminate primarily in ICX. Immunoreactivity for CaMKII is shown in green. The spatial density of CaMKII+ labeling is highest in ICX. Photobleached squares indicate the locations of high magnification image fields (96 μm per side) used for quantitative analysis. See Rodriguez-Contreras et al., 2005, and McBride et al., 2008 for additional images. B, Confocal image stack, 63x objective. The field corresponds to the white box region in A. Multiple CaMKII+ somata are visible within the dense plexus of CaMKII+ dendrites, as are a smaller number of tracer-labeled axons. Synapse-sized overlap objects are yellow. Scale bar = 10 μms. C, 3D reconstruction of the upper left quadrant (white box in B). CaMKII+ neuron is rendered in white, tracer-labeled axons in red. The arrows (lower left) and white grid represent the orientation and coordinate frame for 3D visualization and analysis D, Zoomed view of two dendritic branches receiving sparse axo-dendritic contacts (small red and blue boxes with white labels) from the tracer-labeled axons. Contacts were identified according to criteria outlined in the Methods. The two boxes on the lower branch correspond to a single contact as they are within the 2 μm threshold. The two boxes on the upper branch are separate contacts. ICD (inter-contact distance) was measured as a straight line along the dendritic path. Scale bar = 5 μms.
3.3. Within-branch input clustering in normal adult (NA) and PR owls
The hypothesis predicts tightest clustering of contacts in anatomical zones driving the strongest functional responses. In both NA and PR owls, this is the normal zone at the center of the axonal projection. Zones driving weaker responses are predicted to exhibit less clustering. For both groups, these zones are on the flanks of the projection (Fig. 2).
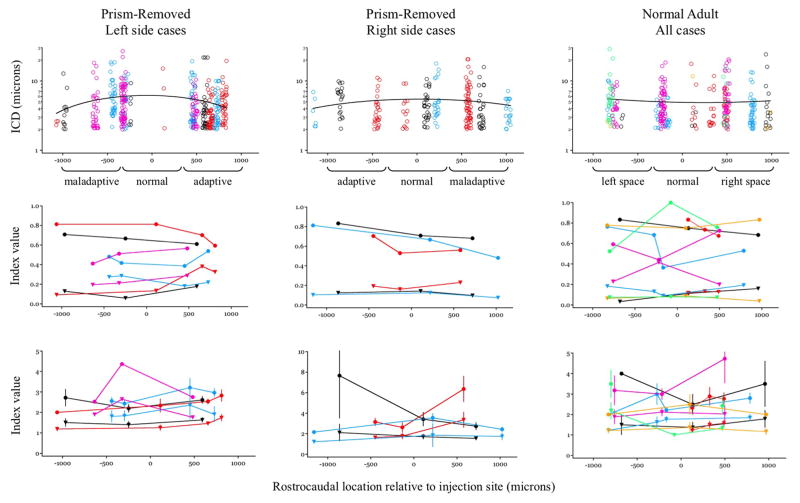
In contrast to predictions, no systematic differences in inter-contact distances (ICDs) were observed across the rostrocaudal axis (Fig. 6, upper panels). In PR owls, ICD distributions were marginally better fit with a polynomial function (shown) than linear regression, indicating a slight and non-significant trend towards larger ICDs – less clustering – in zones driving the strongest responses. In both PR and NA owls, the mean ICD was similar across all functional zones at ~5 μms (Fig. 7, grey fill). These findings contrast with data from prism-adapted and normal juveniles in which mean ICD varied strongly across zones and mirrored functional strength (Fig. 7, open bars).
Figure 6. Input clustering in PR and NA owls.
Top panels, ICD vs rostocaudal location for adult owls. PR owls were separated into left side cases (n=4) and right side cases (n=3) because the adaptive direction is opposite. NA cases (n=6) were pooled. Each case is color-coded and plotted relative to the rostrocaudal location of the image field. Functional zones are indicated and based on known topography, direction and magnitude of prismatic displacement. Black curves are polynomial fits. Middle panels, Between-branch targeting: Circles = BBD; Triangles = BOF. Bottom panels, Contacts per branch: Circles = MDOB; Triangles = MDAB. Error bars are standard deviation.
Figure 7. Mean ICD across experimental groups.
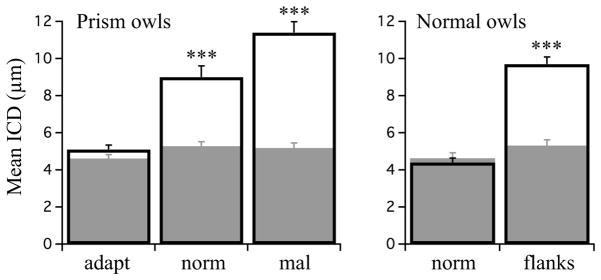
Left, mean ICD across all four experimental groups. Filled bars represent adult owls (this study); open bars represent juvenile owls (previous study). In juveniles, the strong functional zones are the adaptive zone in prism owls and the normal zone in normal owls. Clustering was greater in these zones than in functionally weak zones. In adults, in which normal zones are functional strong, clustering was similar across zones. Open bars = PA; Grey fills = PR; adapt = adaptive zone; norm = normal zone; mal = maladaptive zone. Asterisks indicate p <0.0001, Mann-Whitney U test, for within-zone comparisons PA vs PR. Right, mean ICD in normal owls. Open bars = NJ; Grey fills = NA. norm = normal zone; flanks = right and left space zones combined.
3.4. Between-branch distribution and contact density
The distribution of contacts across different branches of dendrite might also contribute to information storage, especially if the integrative properties of those dendrites were regulated by experience (Losonczy et al., 2008, Makara et al., 2009). To address this we analyzed all dendrites in the image fields regardless of whether they harbored contacts. Four metrics were designed to measure the divergence of a fixed number of contacts onto a field of dendrites of polysomatic origin: Between Branch Dispersion (BBD) is the number of branches receiving only one contact per total number of branches receiving any contacts. Branch Occupancy Fraction (BOF) is the number of branches receiving any contacts per total number of branches. Mean Density of Occupied Branches (MDOB) is the total number of contacts per total number of branches receiving contacts. Mean Density on All Branches (MDAB) is the total number of contacts per total number of branches. As shown in the middle and lower panels of Fig. 6, no systematic differences in any metric were observed across the rostrocaudal axis.
3.5. Deviations from a random distribution
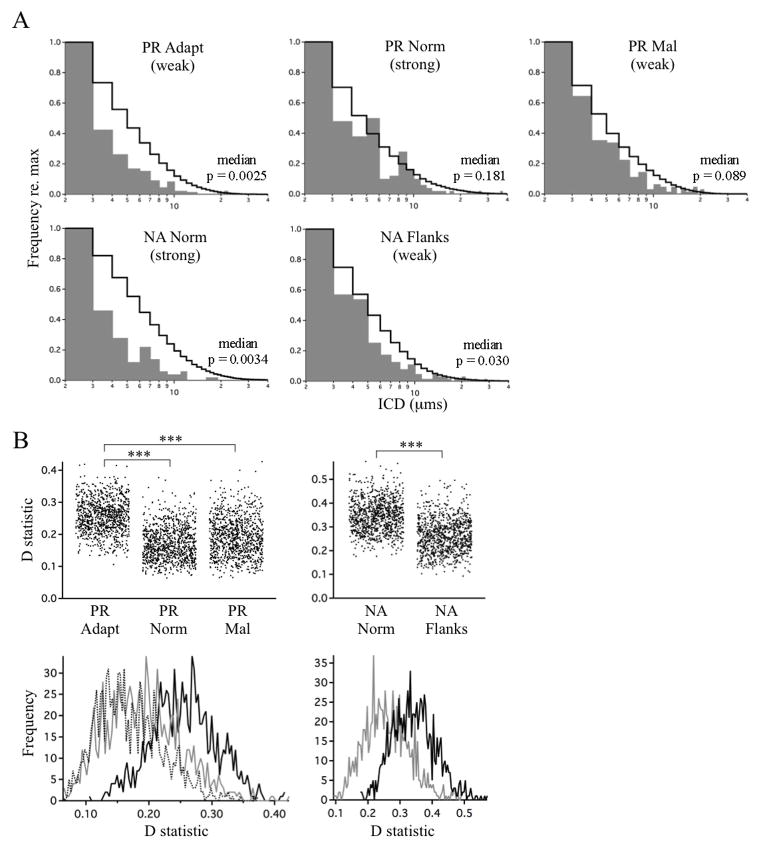
Across all zones and experimental groups there was a tendency for clustering to be greater than expected from a random distribution of contacts (Fig. 8). However, this tendency varied strongly in magnitude and statistical significance. The adaptive zone of PR owls and the normal zone of NA owls exhibited the largest deviations, which were highly significant, while the maladaptive zone of PR owls and both flanking zones of NA owls exhibited the smallest deviations, which were marginally insignificant. This pattern does not correlate with the functional strengths at time of analysis. It does correlate with the magnitude of instructive signals experienced during the sensitive period for plasticity from 60 ~ 200d (Brainard and Knudsen, 1998). The persistence of this marked deviation from random in the PR adaptive zone and NA normal zone could represent an anatomical trace of learning.
Figure 8. Deviations from random distribution.
A, Comparison of observed ICD values (grey fill) and those expected from a random distribution as determined by bootstrap analysis (black lines, calculated from 10,000 simulations). Number of ICDs in each zone: PR adapt, n=305; PR norm, n=169; PR mal, n=197. For NA owls, data from the left and right space zones (NA flanks), representing functionally weak responses at the time of analysis, were pooled. Number of ICDs: NA norm, n=124; NA flanks, n=199. Functional strengths are indicated. Each simulation was compared to the data using the Kolmorogov-Smirnoff test, yielding a range of p values. Median p values are indicated. B, The D statistics from the Kolmorogov-Smirnoff test are shown in top panels (1,000 simulations). Frequency histograms of D statistics are shown in bottom panels (PR adapt = solid black line; PR norm = dotted line; PR mal = grey line; NA norm = solid black line, NA flanks = dotted line). Because the D statistics were normally distributed, a Student’s t-test was used to compare across groups: PR adapt vs PR norm, p < 0.001; PR adapt vs PR mal, p < 0.001; NA norm vs NA flanks, p < 0.001.
3.6. Clustering changes during the transition from juvenile to adult
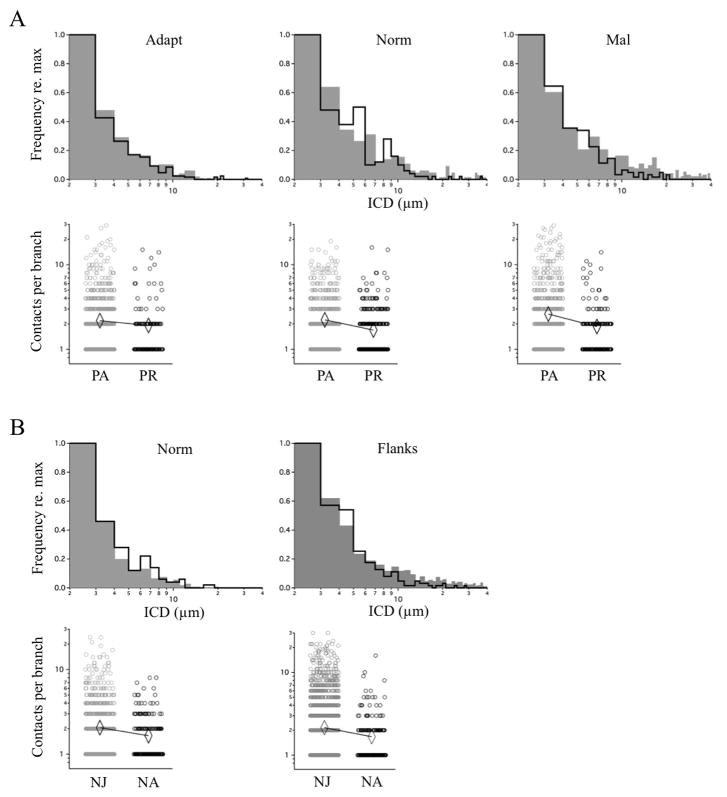
The ICD distributions for prism-adapted (PA) owls represent the clustering pattern prior to prism-removal. Comparison of the frequency histograms for adaptive, normal zone and maladaptive zones of PA vs PR owls confirmed that nearly all long-range contacts (ICDs >10–20 μms) had been eliminated (Fig. 9A, upper panels). This increased clustering did reflect functional changes associated with prism removal, but only for the normal zone; the changes in adaptive and maladaptive zones were opposite of the predicted direction.
Figure 9. Age-related changes in ICD distribution and contact density.
ICD frequency histograms were constructed and overlaid with their counterparts collected in McBride et al., 2008. Within-branch contact density (number of contacts per branch) in each zone is displayed separately, with mean values indicated by diamonds. A, Prism-Adapted (grey) vs Prism-Removed (black). Upper histograms: The ICD distributions had not changed in the adaptive zone (p = 0.739; Kolmogorov-Smirnov), but had in the normal (p=0.005) and maladaptive (p<0.0001) zones, in both cases through a loss of ICDs > 10 μms. Lower scatter plots: There was a trend towards decreased contact density in all zones in Prism-Removed owls. Statistical tests (Mann-Whitney U-test) were performed on these datasets and separately on trimmed datasets containing multiply occupied branches only. Respectively, the p values were 0.1388 and <0.001 for the adaptive zone, 0.7037 and 0.009 for the normal zone, and <0.001 and <0.001 for the maladaptive zone. For data pooled across all zones, the p values were 0.1233 and <0.001. Because singly occupied branches do not yield an ICD value, the subset of multiply occupied branches represents the population subject to remodeling. The p values associated with this population were significant across all zones. B, Normal Juveniles (grey) vs Normal Adults (black). Because the L and R flanks are functionally equivalent throughout life, they were pooled together. Upper histograms: The ICD distributions had not changed in the normal zone (p=0.621) but had in the flanks (p<0.0001), again through a loss of ICDs > 10 μms. And again, in all zones there was a trend towards decreased contact density in the Normal Adults. The p values were 0.2003 and 0.018 for the left space zone, 0.2896 and 0.012 for the normal zone, and 0.1509 and 0.020 for the maladaptive zone. For data pooled across all zones, the p values were 0.0259 and <0.001. Thus, the p values associated with both the multiply occupied branch population and the entire population (including singly occupied branches) were significant.
The ICD distributions for normal juveniles (NJ) represent the clustering patterns prior to adult maturation. Comparison of the flanking zones (right and left space combined) of NJ vs NA owls also revealed that long-range contacts had been eliminated (Fig. 9B, upper panels). This change in clustering does not reflect a functional change from juveniles to adults, as auditory tuning is not known to broaden during maturation.
Changes in clustering could result from contact formation, contact elimination, or both. To determine which process accounts for the data we analyzed the number of contacts per branch receiving contacts. Across all functional zones, this value decreased from PA to PR owls (Fig. 9A, lower panels) and from NJ to NA owls (Fig. 9B, lower panels). This net decrease in contacts per branch suggests the absence of large ICDs is a result of selective elimination of distant contacts.
3.7. Age-related changes in the prevalence of isolated contacts
To investigate whether age, rather than experience, is a determinative factor for the expression of clusters, the prevalence of long-range ICDs for each owl was examined. There was a clear trend for younger owls to harbor more ICDs >20 μms (Fig. 10). Two of the younger owls - one normal, one prism-adapted - exhibited an unusually high prevalence. When these data were removed based on outlier criterion, the age-dependence was even more striking and highly significant (the direction of the removed outliers support the trend). The prevalence in all 10 younger animals was higher than all but one of the older animals, and 5 of 11 older animals exhibited virtually no long-range contacts (<2% prevalence).
Figure 10. Prevalence of long-range contacts across experimental groups.
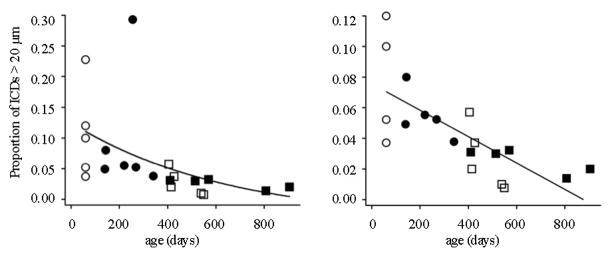
Left panel, For each owl the proportion of ICDs >20 μm to all ICDs was collapsed across all functional zones and plotted vs age at sacrifice: open circles = NJ (n=5), filled circles = PA (n=6), open squares = NA (n=6), filled squares = PR (n=5). Data were slightly better fit with a power function (shown) or exponential than linear regression (Pearson R = −0.48, p <0.027) and best fit with Spearman rank correlation (R = −0.78, p < 0.00003), which is more resistant to outliers. Right panel, Same data with the two outlier data points removed (one NJ and one PA which exceeded the mean +/− 2 SD = 0.208). These data were best fit with linear regression (Pearson R = −0.73, p < 0.00058).
3.8. Relationship between clustering and number of contacts per branch
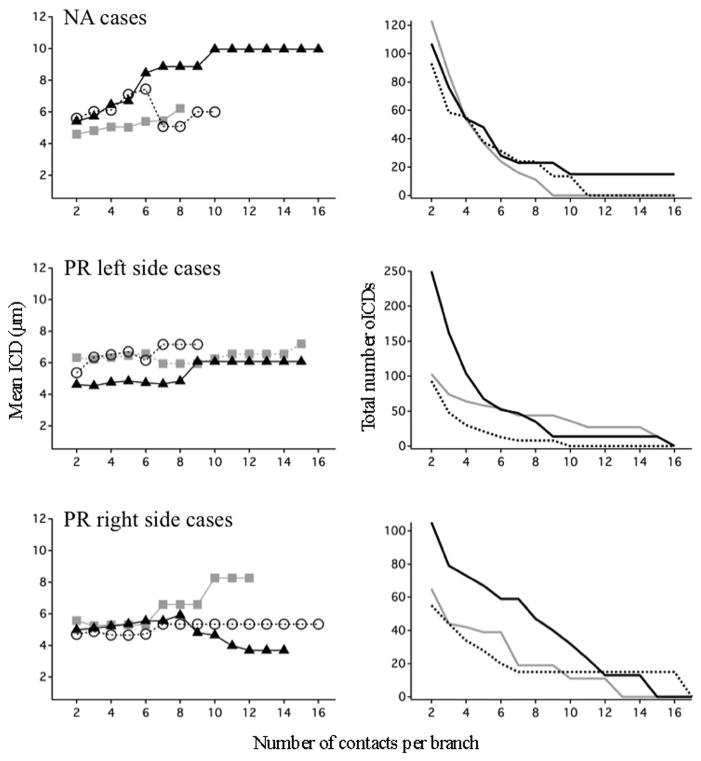
Dendritic summation rules can depend on the number and strengths of co-active inputs, with larger numbers of inputs more likely to trigger supralinearity. Therefore we investigated whether the degree of clustering depended on the number of contacts per branch. While mean ICDs varied with increasing contact densities, there was no systematic pattern across experimental groups (Fig. 11). In addition, few branches harbored more than 8–10 contacts and therefore the sporadic differences across zones that were sometimes observed in this input regime cannot be interpreted due to low statistical power.
Figure 11. Relationship between clustering and number of contacts per branch.
Left panels, Mean ICD calculated for all branches receiving at least n number of contacts, from 2 to 16. NA cases, PR left side cases, and PR right side cases are shown separately. Normal zone = grey fill; left space zone = open circles; right space zone = filled triangles. Right panels, Total number of contacts in each dataset as a function of the increasing threshold. Few branches received more than ~8–10 contacts per branch, thus, mean ICDs above that threshold were often derived from a single branch.
3.9. Bouton volume
What mechanism(s) account for differential circuit strength? Boutons that contacted CaMKII+ neurons in the strong functional (normal) zones were on average larger than their counterparts in weak functional (flanking) zones. This effect was significant in data pooled across all adults, and also in PR owls alone (Fig. 12). The magnitude of the effect in NA owls alone was similar though statistically insignificant. In all groups, boutons that contacted CaMKII+ neurons were significantly larger than boutons with unlabeled targets. Volumes of boutons with CaMKII- targets were indistinguishable across zones, indicating that this connection, possibly to local inhibitory neurons, is not regulated by prism experience.
Figure 12. Bouton volume.
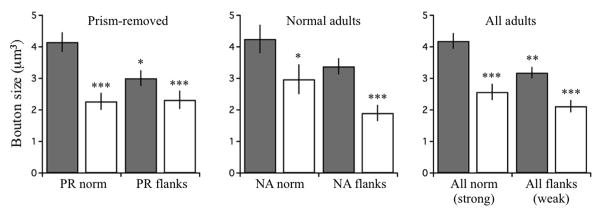
Bouton volumes for PR owls, NA owls and all adults. Grey bars represent boutons that contacted CaMKII+ dendrites (“C+”). Open bars represent boutons that did not (“C−”). Data were binned according to functional strength at time of analysis: PR norm are functionally strong; PR flanks, weak; NA norm, strong; NA flanks, weak. Mann-Whitney U test: PR norm C+ (n=232) vs PR norm C− (n=81), p=0.0004; PR norm C+ vs PR flank C+ (n=218), p=0.0147; PR norm C+ vs PR flank C− (n=84), p=0.0007; NA norm C+ (n=132) vs NA norm C− (n=60), p=0.0280; NA norm C+ vs NA flank C+ (n=182), p=0.1757; NA norm C+ vs NA flank C− (n=79), p<0.00001; All norm C+ (n=364) vs All norm C− (n=141), p=0.00006; All norm C+ vs All flank C+ (n=400), p=0.0068; All norm C+ vs All flank C− (n=163), p=0.000002. One asterisk = P<0.05, two asterisks = p<0.01, 3 asterisks = p<0.001.
4. DISCUSSION
We investigated the role of input clustering in adult learning. There are four findings: (1) the distribution of inter-contact distances (ICDs) was similar across all zones with a mean of ~5 μm. Isolated contacts (ICDs >10–20 μms) were rarely observed (Figs. 6–8, 11 and 12). (2) Boutons contacting CaMKII neurons were on average larger in the functionally strong vs functionally weak zones (Fig. 12). (3) Marked deviations in clustering from that expected from a random distribution occurred in zones that had been functionally strong during the sensitive period (Fig. 8). (4) Changes in contact density indicated that cluster formation in functionally weak zones during the transition from juvenile to adult could have occurred by synapse elimination only. These data, their implications for differential circuit strength, ongoing synapse formation and elimination in adults, the functional significance of clustered inputs, and comparison to recent studies are discussed below.
4.1. Mechanisms underlying differential circuit strength
The functional output of each zone depends on bulk synapse number, strength of individual synapses, and the hypothesized supra-linearity conferred by clustering (for alternative assumptions, see “Functional Significance of Input Clusters”).
Clustering (most ICDs <10 μms) occurred in all functionally weak zones in both experimental groups. In the flanking zones of normal adults and maladaptive zone of prism-adapted adults, synapse number is significantly lower than in the normal zone, and this alone could explain differential circuit strength. In contrast, the number of synaptic boutons in the adaptive vs normal zones of prism-adapted owls is similar (DeBello et al., 2001), and adaptive boutons persist for at least two months following prism removal (Linkenhoker et al., 2005). Thus, bulk synapse number cannot explain differential circuit strength, at least not in the two prism-removed owls (PR1 and PR2) analyzed within this time frame (Fig. 3).
Volumes of boutons that contacted CaMKII+ neurons were larger in the functionally strong vs. weak zones (Fig. 12). Because bouton volume scales with synaptic strength (Pierce and Lewin, 1994), strengthening/weakening of pre-existing synapses appears to be the major mechanism for functional activation in adults. This is consistent with results documenting weak adaptive responses in prism-removed owls with GABA signaling blocked (Zheng and Knudsen, 1999) and up-regulation of AMPA receptors in the adaptive circuit of prism-adapting owls (Feldman and Knudsen, 1998). In addition, boutons that do not contact CaMKII+ neurons were consistently smaller in volume (Fig. 12). The cellular targets of these boutons are unknown.
The difference in bouton volumes between strong and weak zones was ~25% (Fig. 12), whereas the difference in circuit strengths was typically greater (Fig. 4). This discrepancy could be explained by supralinear summation only triggered at higher synaptic strengths. In vitro studies of location-dependent summation (Polsky et al., 2004), and computational models (Poirazi et al., 2003), support this possibility. Thus, clustering may contribute to differential activation of the normal vs adaptive circuit in prism-removed owls.
4.2. Elimination of long-range ICDs
Across all functional zones in both adult groups, long-range ICDs >20 μm were virtually absent. In contrast, in juveniles a small but significant fraction was between 20 and 60 μms. Due to improvements in reconstruction method, the image fields were four times larger for adults than juveniles i.e. more opportunities to find large ICDs. The heavily compressed range of ICDs is conspicuous.
Age-related elimination of long-range ICDs could arise through formation of new synapses intercalated between distant contacts, the selective elimination of distant contacts, or both. These possibilities are distinguished by analysis of contact densities (Fig. 9). In adults there was a consistent tendency towards fewer contacts per branch. The statistical significance varied across zones, but data pooled from all animals revealed a robust difference. The simplest explanation is that remodeling in the adult, either during normal development or in response to prism-removal, occurs via selective elimination of isolated contacts. It is not necessary to invoke synapse formation to account for the observed patterns.
What process could select isolated contacts for elimination? One possibility is a roving removal mechanism that is blocked when it encounters a marked synapse. In this model, each synaptic input is at some point tested not for adaptive value but whether it participates in a spatiotemporal cohort. If so, the synapse receives a mark or synaptic tag (Frey and Morris, 1997); if not, it is left unprotected. To account for the data, this elimination process would begin in earnest at the time of sexual maturity, and not before.
4.3. Deviations from a random distribution
Deviations from a random distribution in adult owls were predicted not by the functional strengths at time of analysis but the history of instructive signals experienced during the sensitive period (Fig. 8). These could represent anatomical traces of juvenile experience.
One interpretation is that high rates of microstructural dynamics during the sensitive period permit the instructive signal to sculpt large deviations in zones receiving a positive instructive signal, PR adaptive and NA normal. As the synapses persist into adulthood those clusters are preserved, and circuit strength is adjusted via changes in synaptic strength and/or dendritic integration properties. As the rates of microstructural dynamics decline with age (Holtmaat et al., 2005, Yang et al., 2009), the capacity of the instructive signal to generate new large deviations from random - which requires new synapse formation - becomes limited. This would explain the data in the PR normal zone, despite their substantial experience with a positive instructive signal following prism removal (Fig. 8). Also consistent with this model, contacts in zones that never received a positive instructive signal, the PR maladaptive and NA flanks, did not deviate as markedly from a random distribution (Fig. 8).
That mean ICD values in adults were similar across zones (Fig. 7) while the magnitudes of deviation from random were not (Fig. 8) can be accounted for by subtle differences in shapes of the distributions: for example, the maladaptive zone of PR owls contained a slightly higher proportion of both short (<4 microns) and long (>10 microns) ICDs than did the adaptive zone, an effective wash in the calculation of mean. Branch-to-branch variations in dendritic lengths and/or contact densities could, in principle, contribute to these differences.
4.4. Functional significance of input clusters
The large majority of ICDs were less than 10 μms. The functional implications of contacts spaced so closely are unclear. We consider three possibilities: supralinear, sublinear and linear summation.
Supralinear summation of nearby synaptic inputs enhances postsynaptic response. But this rule is not fixed; it depends on the number and strength of synapses within the cluster (Poirazi et al., 2003, Polsky et al., 2004). If the strengths of individual synapses in the adaptive zone decreased following prism removal (e.g. via removal of AMPA receptors), the postsynaptic potentials could fall below threshold for triggering dendritic nonlinearity. In this view, preservation of clusters in the adaptive zone of prism-removed adults is a hedge against the chance that circuit might need to be reactivated. Should that arise, a modest increase in the strength of each synapse (e.g. via insertion of AMPA receptors) could drive a large increase in postsynaptic response. This is a mechanism for minimizing metabolic cost while maintaining both stability and long-term flexibility of circuit function.
Sublinear summation of nearby inputs can occur as a result of EPSC-related transient decreases in local input resistance and driving force. However, this cannot account for the circuit strengths measured in prism-adapted owls, and therefore if sub-linearities predominate, they are an unlikely mechanism for encoding.
Linear or near-linear summation of nearby inputs has also been observed (Cash and Yuste, 1999, Araya et al., 2006). In this case, input clusters would have no direct functional role but merely reflect the spatial limits of biochemical signaling pathways involved in the priming of nearby synapses (within 10 μms) for LTP following potentiation of a nearby one (Harvey and Svoboda, 2007, Harvey et al., 2008). Our data do not rule out this possibility.
4.5. Comparison to other studies
Since 2008, at least ten independent groups have directly tested the microanatomical predictions of input clustering. Eight groups found evidence consistent with the predictions (McBride et al., 2008, Kleindienst et al., Makino and Malinow, 2011, Chen et al., 2012, Fu et al., 2012, Takahashi et al., 2012, Rah et al., 2013, Druckmann et al., 2014), while two groups did not (Jia et al., 2010, Chen et al., 2011, da Costa and Martin, 2011, Varga et al., 2011). This issue is not resolved and multiple interpretations are still valid (reviewed in DeBello et al., 2014). In experiments where clusters were observed, one consistent finding is inter-synapse distances of ~10 microns or less. The current study adds to this body of evidence, provides only the second report of clustering in adult learning (Fu et al., 2012), and provides the first report we know of that clusters can be preserved well beyond their time of formation or functional expression. Preservation could represent a mechanism to store information with a minimum number of synapses by positioning them optimally while turning down their synaptic weights until and unless the need for recall.
Supplementary Material
Triple label for tracer axons (red), CaMKII protein (blue), and Homer1 protein (green) in A Juvenile ICX (reprint of Figure 11A in McBride et al., 2008) and B Adult ICX. C, Antibody to Homer1 applied to adult ICX using Array Tomography (Micheva and Smith, 2007, Micheva et al., 2010). These ultrathin sections (70nm) facilitate detection of synaptic proteins by reducing barriers to antibody access present in the thicker sections used for clustering analysis. D, Spatial density of Homer1 punctae observed in juveniles using conventional immunohistochemistry (IHC, open circles) and in adults using Array Tomography (AT, open triangles). Densities determined by AT were ~15 higher than those determined by IHC, and approached the maximum expected density of synapses in neuropil, ~1 synapse/μm3. Scale bars A–C, 5 μms.
Highlights.
We analyzed input clustering in normal adult and prism-removed owls.
In contrast to findings in juveniles, clustering did not mirror function.
Nearly all contacts in adults were positioned within clusters.
Synaptic bouton volumes were larger in functionally strong zones.
Data indicate that cluster dynamics are different between juvenile and adults.
Acknowledgments
We thank Douglas Totten for comments on the manuscript. This work was supported by a grant from the National Institute on Deafness and Other Communication Disorders, National Institutes of Health R01 DC05640 to WMD.
Footnotes
Publisher's Disclaimer: This is a PDF file of an unedited manuscript that has been accepted for publication. As a service to our customers we are providing this early version of the manuscript. The manuscript will undergo copyediting, typesetting, and review of the resulting proof before it is published in its final citable form. Please note that during the production process errors may be discovered which could affect the content, and all legal disclaimers that apply to the journal pertain.
References
- Araya R, Eisenthal KB, Yuste R. Dendritic spines linearize the summation of excitatory potentials. Proc Natl Acad Sci U S A. 2006;103:18799–18804. doi: 10.1073/pnas.0609225103. [DOI] [PMC free article] [PubMed] [Google Scholar]
- Brainard MS, Knudsen EI. Sensitive periods for visual calibration of the auditory space map in the barn owl optic tectum. J Neurosci. 1998;18:3929–3942. doi: 10.1523/JNEUROSCI.18-10-03929.1998. [DOI] [PMC free article] [PubMed] [Google Scholar]
- Branco T, Hausser M. The single dendritic branch as a fundamental functional unit in the nervous system. Curr Opin Neurobiol. 2010;20:494–502. doi: 10.1016/j.conb.2010.07.009. [DOI] [PubMed] [Google Scholar]
- Cash S, Yuste R. Linear summation of excitatory inputs by CA1 pyramidal neurons. Neuron. 1999;22:383–394. doi: 10.1016/s0896-6273(00)81098-3. [DOI] [PubMed] [Google Scholar]
- Chen JL, Villa KL, Cha JW, So PT, Kubota Y, Nedivi E. Clustered dynamics of inhibitory synapses and dendritic spines in the adult neocortex. Neuron. 2012;74:361–373. doi: 10.1016/j.neuron.2012.02.030. [DOI] [PMC free article] [PubMed] [Google Scholar]
- Chen X, Leischner U, Rochefort NL, Nelken I, Konnerth A. Functional mapping of single spines in cortical neurons in vivo. Nature. 2011;475:501–505. doi: 10.1038/nature10193. [DOI] [PubMed] [Google Scholar]
- da Costa NM, Martin KA. How thalamus connects to spiny stellate cells in the cat’s visual cortex. J Neurosci. 2011;31:2925–2937. doi: 10.1523/JNEUROSCI.5961-10.2011. [DOI] [PMC free article] [PubMed] [Google Scholar]
- DeBello WM. Micro-rewiring as a substrate for learning. Trends Neurosci. 2008;31:577–584. doi: 10.1016/j.tins.2008.08.006. [DOI] [PMC free article] [PubMed] [Google Scholar]
- DeBello WM, Feldman DE, Knudsen EI. Adaptive axonal remodeling in the midbrain auditory space map. J Neurosci. 2001;21:3161–3174. doi: 10.1523/JNEUROSCI.21-09-03161.2001. [DOI] [PMC free article] [PubMed] [Google Scholar]
- DeBello WM, McBride TJ, Nichols GS, Pannoni KE, Sanculi D, Totten DJ. Input clustering and the microscale structure of local circuits. Front Neural Circuits. 2014;8:112. doi: 10.3389/fncir.2014.00112. [DOI] [PMC free article] [PubMed] [Google Scholar]
- Druckmann S, Feng L, Lee B, Yook C, Zhao T, Magee JC, Kim J. Structured synaptic connectivity between hippocampal regions. Neuron. 2014;81:629–640. doi: 10.1016/j.neuron.2013.11.026. [DOI] [PubMed] [Google Scholar]
- Feldman DE, Knudsen EI. Experience-dependent plasticity and the maturation of glutamatergic synapses. Neuron. 1998;20:1067–1071. doi: 10.1016/s0896-6273(00)80488-2. [DOI] [PubMed] [Google Scholar]
- Frey U, Morris RG. Synaptic tagging and long-term potentiation. Nature. 1997;385:533–536. doi: 10.1038/385533a0. [DOI] [PubMed] [Google Scholar]
- Fu M, Yu X, Lu J, Zuo Y. Repetitive motor learning induces coordinated formation of clustered dendritic spines in vivo. Nature. 2012;483:92–95. doi: 10.1038/nature10844. [DOI] [PMC free article] [PubMed] [Google Scholar]
- Govindarajan A, Kelleher RJ, Tonegawa S. A clustered plasticity model of long-term memory engrams. Nat Rev Neurosci. 2006;7:575–583. doi: 10.1038/nrn1937. [DOI] [PubMed] [Google Scholar]
- Harvey CD, Svoboda K. Locally dynamic synaptic learning rules in pyramidal neuron dendrites. Nature. 2007;450:1195–1200. doi: 10.1038/nature06416. [DOI] [PMC free article] [PubMed] [Google Scholar]
- Harvey CD, Yasuda R, Zhong H, Svoboda K. The spread of Ras activity triggered by activation of a single dendritic spine. Science. 2008;321:136–140. doi: 10.1126/science.1159675. [DOI] [PMC free article] [PubMed] [Google Scholar]
- Holtmaat A, Svoboda K. Experience-dependent structural synaptic plasticity in the mammalian brain. Nat Rev Neurosci. 2009;10:647–658. doi: 10.1038/nrn2699. [DOI] [PubMed] [Google Scholar]
- Holtmaat AJ, Trachtenberg JT, Wilbrecht L, Shepherd GM, Zhang X, Knott GW, Svoboda K. Transient and persistent dendritic spines in the neocortex in vivo. Neuron. 2005;45:279–291. doi: 10.1016/j.neuron.2005.01.003. [DOI] [PubMed] [Google Scholar]
- Jia H, Rochefort NL, Chen X, Konnerth A. Dendritic organization of sensory input to cortical neurons in vivo. Nature. 2010;464:1307–1312. doi: 10.1038/nature08947. [DOI] [PubMed] [Google Scholar]
- Kleindienst T, Winnubst J, Roth-Alpermann C, Bonhoeffer T, Lohmann C. Activity-dependent clustering of functional synaptic inputs on developing hippocampal dendrites. Neuron. 2011;72:1012–1024. doi: 10.1016/j.neuron.2011.10.015. [DOI] [PubMed] [Google Scholar]
- Knudsen EI. Instructed learning in the auditory localization pathway of the barn owl. Nature. 2002;417:322–328. doi: 10.1038/417322a. [DOI] [PubMed] [Google Scholar]
- Knudsen EI, Brainard MS. Visual instruction of the neural map of auditory space in the developing optic tectum. Science. 1991;253:85–87. doi: 10.1126/science.2063209. [DOI] [PubMed] [Google Scholar]
- Larkum ME, Nevian T. Synaptic clustering by dendritic signalling mechanisms. Curr Opin Neurobiol. 2008;18:321–331. doi: 10.1016/j.conb.2008.08.013. [DOI] [PubMed] [Google Scholar]
- Linkenhoker BA, von der Ohe CG, Knudsen EI. Anatomical traces of juvenile learning in the auditory system of adult barn owls. Nat Neurosci. 2005;8:93–98. doi: 10.1038/nn1367. [DOI] [PubMed] [Google Scholar]
- Losonczy A, Makara JK, Magee JC. Compartmentalized dendritic plasticity and input feature storage in neurons. Nature. 2008;452:436–441. doi: 10.1038/nature06725. [DOI] [PubMed] [Google Scholar]
- Magee JC. Observations on clustered synaptic plasticity and highly structured input patterns. Neuron. 2011;72:887–888. doi: 10.1016/j.neuron.2011.12.009. [DOI] [PubMed] [Google Scholar]
- Makara JK, Losonczy A, Wen Q, Magee JC. Experience-dependent compartmentalized dendritic plasticity in rat hippocampal CA1 pyramidal neurons. Nat Neurosci. 2009;12:1485–1487. doi: 10.1038/nn.2428. [DOI] [PubMed] [Google Scholar]
- Makino H, Malinow R. Compartmentalized versus global synaptic plasticity on dendrites controlled by experience. Neuron. 2011;72:1001–1011. doi: 10.1016/j.neuron.2011.09.036. [DOI] [PMC free article] [PubMed] [Google Scholar]
- McBride TJ, Rodriguez-Contreras A, Trinh A, Bailey R, Debello WM. Learning drives differential clustering of axodendritic contacts in the barn owl auditory system. J Neurosci. 2008;28:6960–6973. doi: 10.1523/JNEUROSCI.1352-08.2008. [DOI] [PMC free article] [PubMed] [Google Scholar]
- Mel BW. The clusteron: toward a simple abstraction for a complex neuron. In: Moody J, et al., editors. Advances in Neural Information Processing Systems. Vol. 4. San Mateo, CA: Morgan Kaufmann; 1992. pp. 35–42. [Google Scholar]
- Micheva KD, Busse B, Weiler NC, O’Rourke NA, Smith SJ. Single synapse analysis of a diverse synapse population: proteomic imaging methods and markers. Neuron. 2010 doi: 10.1016/j.neuron.2010.09.024. in press. [DOI] [PMC free article] [PubMed] [Google Scholar]
- Micheva KD, Smith SJ. Array tomography: a new tool for imaging the molecular architecture and ultrastructure of neural circuits. Neuron. 2007;55:25–36. doi: 10.1016/j.neuron.2007.06.014. [DOI] [PMC free article] [PubMed] [Google Scholar]
- Pierce JP, Lewin GR. An ultrastructural size principle. Neuroscience. 1994;58:441–446. doi: 10.1016/0306-4522(94)90071-x. [DOI] [PubMed] [Google Scholar]
- Poirazi P, Brannon T, Mel BW. Arithmetic of subthreshold synaptic summation in a model CA1 pyramidal cell. Neuron. 2003;37:977–987. doi: 10.1016/s0896-6273(03)00148-x. [DOI] [PubMed] [Google Scholar]
- Poirazi P, Mel BW. Impact of active dendrites and structural plasticity on the memory capacity of neural tissue. Neuron. 2001;29:779–796. doi: 10.1016/s0896-6273(01)00252-5. [DOI] [PubMed] [Google Scholar]
- Polsky A, Mel BW, Schiller J. Computational subunits in thin dendrites of pyramidal cells. Nat Neurosci. 2004;7:621–627. doi: 10.1038/nn1253. [DOI] [PubMed] [Google Scholar]
- Rah JC, Bas E, Colonell J, Mishchenko Y, Karsh B, Fetter RD, Myers EW, Chklovskii DB, Svoboda K, Harris TD, Isaac JT. Thalamocortical input onto layer 5 pyramidal neurons measured using quantitative large-scale array tomography. Front Neural Circuits. 2013;7:177. doi: 10.3389/fncir.2013.00177. [DOI] [PMC free article] [PubMed] [Google Scholar]
- Rodriguez-Contreras A, Liu XB, DeBello WM. Axodendritic contacts onto calcium/calmodulin-dependent protein kinase type II-expressing neurons in the barn owl auditory space map. J Neurosci. 2005;25:5611–5622. doi: 10.1523/JNEUROSCI.3972-04.2005. [DOI] [PMC free article] [PubMed] [Google Scholar]
- Swofford JA, DeBello WM. Transcriptome changes associated with instructed learning in the barn owl auditory localization pathway. Developmental neurobiology. 2007;67:1457–1477. doi: 10.1002/dneu.20458. [DOI] [PubMed] [Google Scholar]
- Takahashi N, Kitamura K, Matsuo N, Mayford M, Kano M, Matsuki N, Ikegaya Y. Locally synchronized synaptic inputs. Science. 2012;335:353–356. doi: 10.1126/science.1210362. [DOI] [PubMed] [Google Scholar]
- Varga Z, Jia H, Sakmann B, Konnerth A. Dendritic coding of multiple sensory inputs in single cortical neurons in vivo. Proc Natl Acad Sci U S A. 2011;108:15420–15425. doi: 10.1073/pnas.1112355108. [DOI] [PMC free article] [PubMed] [Google Scholar]
- Winnubst J, Lohmann C. Synaptic clustering during development and learning: the why, when, and how. Frontiers in molecular neuroscience. 2012;5:70. doi: 10.3389/fnmol.2012.00070. [DOI] [PMC free article] [PubMed] [Google Scholar]
- Yang G, Pan F, Gan WB. Stably maintained dendritic spines are associated with lifelong memories. Nature. 2009;462:920–924. doi: 10.1038/nature08577. [DOI] [PMC free article] [PubMed] [Google Scholar]
- Zheng W, Knudsen EI. Functional selection of adaptive auditory space map by GABAA-mediated inhibition. Science. 1999;284:962–965. doi: 10.1126/science.284.5416.962. [DOI] [PubMed] [Google Scholar]
Associated Data
This section collects any data citations, data availability statements, or supplementary materials included in this article.
Supplementary Materials
Triple label for tracer axons (red), CaMKII protein (blue), and Homer1 protein (green) in A Juvenile ICX (reprint of Figure 11A in McBride et al., 2008) and B Adult ICX. C, Antibody to Homer1 applied to adult ICX using Array Tomography (Micheva and Smith, 2007, Micheva et al., 2010). These ultrathin sections (70nm) facilitate detection of synaptic proteins by reducing barriers to antibody access present in the thicker sections used for clustering analysis. D, Spatial density of Homer1 punctae observed in juveniles using conventional immunohistochemistry (IHC, open circles) and in adults using Array Tomography (AT, open triangles). Densities determined by AT were ~15 higher than those determined by IHC, and approached the maximum expected density of synapses in neuropil, ~1 synapse/μm3. Scale bars A–C, 5 μms.


