

Abstract
Gene expression studies identified the interleukin-1 receptor type I (IL-1R1) as part of a pathway associated with a genetic predisposition to high alcohol consumption, and lack of the endogenous IL-1 receptor antagonist (IL-1ra) strongly reduced ethanol intake in mice. Here, we compared ethanol-mediated behaviors in mice lacking Il1rn or Il1r1. Deletion of Il1rn (the gene encoding IL-1ra) increases sensitivity to the sedative/hypnotic effects of ethanol and flurazepam and reduces severity of acute ethanol withdrawal. Conversely, deletion of Il1r1 (the gene encoding the IL-1 receptor type I, IL-1R1) reduces sensitivity to the sedative effects of ethanol and flurazepam and increases the severity of acute ethanol withdrawal. The sedative effects of ketamine and pentobarbital were not altered in the knockout (KO) strains. Ethanol intake and preference were not changed in mice lacking Il1r1 in three different tests of ethanol consumption. Recovery from ethanol-induced motor incoordination was only altered in female mice lacking Il1r1. Mice lacking Il1rn (but not Il1r1) showed increased ethanol clearance and decreased ethanol-induced conditioned taste aversion. The increased ethanol- and flurazepam-induced sedation in Il1rn KO mice was decreased by administration of IL-1ra (Kineret), and pre-treatment with Kineret also restored the severity of acute ethanol withdrawal. Ethanol-induced sedation and withdrawal severity were changed in opposite directions in the null mutants, indicating that these responses are likely regulated by IL-1R1 signaling, whereas ethanol intake and preference do not appear to be solely regulated by this pathway.
Keywords: flurazepam, two-bottle choice, drinking in the dark, Il1rn, Il1r1, knockout mice, Kineret, anakinra, loss of righting reflex, alcohol withdrawal, conditioned taste aversion, IL-1ra, IL-1R1
1. Introduction
There is substantial evidence that alcohol exposure activates neuroimmune signaling and that these pathways participate in many acute and chronic actions of alcohol (Crews et al., 2011, Mayfield et al., 2013). Much of the initial interest in neuroimmune molecules came from gene expression studies in human alcoholics or from rodents with a genetic predisposition for high alcohol consumption, showing an unexpected differential expression of immune genes in the brain (Liu et al., 2004, Mulligan et al., 2006). Subsequent studies investigated the role of these genes in alcohol actions. For example, ethanol consumption in null mutant mice lacking specific immune-related genes [beta-2-microglobulin (B2m), cathepsin S (Ctss), cathepsin F (Ctsf), interleukin-1 receptor antagonist (IL-1ra) (Il1rn), CD14 molecule (Cd14), interleukin-6 (Il6)] showed that deletion of any one of these genes decreased ethanol intake and preference (Blednov et al., 2012).
Other studies also demonstrated a role for IL-1 receptor type I (IL-1R1) signaling in alcohol responses. The human recombinant IL-1R1 antagonist (IL-1ra, Kineret) reduced alcohol sedation and motor impairment (Wu et al., 2011), and Kineret reduced alcoholic steatohepatitis in mice (Petrasek et al., 2012). Chronic alcohol consumption increased IL-1β in brain (Lippai et al., 2013), and genetic polymorphisms in IL1B and IL1RN were associated with risk for alcohol dependence in humans (Liu et al., 2009, Pastor et al., 2005).
The IL-1R1 signaling system (consisting of the cytokines IL-1α or IL-1β, IL-1R1, and the endogenous antagonist IL-1ra) is activated peripherally by infection and inflammation and is also important in brain function (Arend and Guthridge, 2000). IL-1β enhances GABAergic and glycinergic function in brain (Brambilla et al., 2007, Chirila et al., 2014, Serantes et al., 2006), and allelic variants of genes for IL-1β are associated with depression (Bufalino et al., 2013). Although activation of immune function is proposed to increase ethanol consumption (Blednov et al., 2011), mice lacking Il1rn (i.e., deficient in IL-1ra) showed markedly decreased ethanol consumption in three different tests (Blednov et al., 2012). These results prompted us to employ a combination of genetic and pharmacological approaches to define the role of IL-1R1 signaling in the behavioral actions of ethanol, benzodiazepines, and other sedative drugs. We used mice lacking Il1r1 (the gene encoding the IL-1 receptor type I, IL-1R1) or mice lacking Il1rn (the gene encoding the receptor antagonist, IL-1ra) to inhibit and enhance IL-1R1 signaling, respectively, and Kineret, an injectable form of IL-1ra, as a pharmacological manipulation.
2. Materials and Methods
2.1. Animals
Il1r1 [B6.129S7-Il1r1tm1Imx/J (Stock #003245)] or Il1rn [B6.129S-Il1rntm1Dih/J (Stock #004754)] KO mice were purchased from Jackson Laboratories (Bar Harbor, ME). Il1rn KO heterozygous mice were purchased, and the colony was maintained by heterozygous breeding. Il1r1 KO homozygous mice were purchased and bred with C57BL/6J to produce heterozygous mice, and the colony was maintained by heterozygous breeding. Wild type (WT) mice from the same colonies were used as controls. Il1r1 KO mice are referred to as Il1r in the figures and figure legends. Two different 129 sub-strains were used in the generation of the KO mice and Il1r1 KO mice were then bred on a C57BL/6J background (a high alcohol drinking strain), which may account for the different ethanol responses that we observed in WT mice from the two colonies. However, all KO mice were analyzed with their WT counterparts, thus controlling for differences in genetic background between WT and corresponding KO mice. After weaning, mice were housed in the Animal Resources Center at The University of Texas at Austin in rooms with 12-hour light/dark cycles (lights on at 7:00 a.m.) with ad libitum access to rodent chow and water. Male and female mice 8 to 12 weeks of age were used. In some experiments, data from males and females were combined if there were no gender differences, and in other experiments, only male mice were tested (see Results and Figure legends). Each mouse was used for only one experiment, and all mice were ethanol naive at the start of each test. Experiments were approved by the Institutional Animal Care and Use Committee at The University of Texas (#AUP 2013-00061) and were conducted in accordance with the National Institutes of Health guidelines with regard to the care and use of animals in research. Recent studies demonstrate that behavioral results are strongly influenced by the experimenter (Bohlen et al., 2014, Sorge et al., 2014). To minimize potential “investigator” effects, experiments were carried out by the same three investigators, with each investigator being responsible for two or three different experiments.
2.2. Ethanol drinking- 24-hour access
A two-bottle choice protocol was carried out as previously described (Blednov et al., 2003). Mice were allowed to acclimate for 1 week to individual housing. Two drinking bottles were continuously available to each mouse, and bottles were weighed daily. One bottle always contained water. Food was available ad libitum, and mice were weighed every 4 days. After 4 days of water consumption (both bottles), mice were offered 3% ethanol (v/v) versus water for 4 days. Bottle positions were changed daily to control for position preferences. Quantity of ethanol consumed (g/kg body weight/24 hours) was calculated for each mouse, and these values were averaged for every concentration of ethanol. Immediately following 3% ethanol, a choice between 6% (v/v) ethanol and water was offered for 4 days, followed by 9, 12, 15, and finally 18% (v/v) ethanol (each concentration was offered for 4 days). Throughout the experiment, evaporation/spillage estimates were calculated daily from 2 bottles placed in an empty cage; one bottle contained water, and the other contained the appropriate ethanol solution.
When measuring the effects of Kineret on ethanol intake, baseline drinking was first established. WT and Il1rn KO male mice consumed 10% ethanol for at least 3 weeks. After this period, ethanol consumption was measured for at least 4 days to ensure stable consumption. The criterion for stable consumption was similar values for days 1–2 and days 3–4. For the 24-hour two-bottle choice test, ethanol intake was then measured after saline injection for 2 days, and mice were grouped to provide similar levels of ethanol intake and preference. Ethanol and total fluid intake were presented as g/kg/24 hours. Saline or Kineret (100 mg/kg) was administered i.p. 30 minutes before placement of the bottles.
2.3. Ethanol drinking- limited access drinking in the dark (one-bottle DID)
Consumption of ethanol (20% solution) under conditions of limited access achieves pharmacologically significant levels of ethanol drinking (Rhodes et al., 2005). Starting 3 hours after lights off, the water bottles were replaced with bottles containing a 20% ethanol solution. The ethanol bottles remained in place for either 2 (days 1–3) or 4 hours (day 4) and then were replaced with water bottles. Other than these short periods of ethanol drinking, mice had unlimited access to water. The ethanol bottles were weighed before placement and after removal from the experimental cages.
2.4. Ethanol drinking- limited access drinking in the dark (two-bottle choice DID)
This was similar to the one-bottle DID test described above except that 2 bottles containing 20% ethanol vs. water were used. The ethanol and water bottles remained in place for 3 hours. After their removal, mice had unlimited access to 1 bottle of water. The positions of bottles during 3-hour access were changed daily to avoid potential side preferences. The ethanol and water bottles were weighed before placement and after removal from the experimental cages.
2.5. Conditioned taste aversion (CTA)
Mice were adapted to a water-restriction schedule (2 hours of water per day) over a 7-day period. At 48-hour intervals over the next 10 days (days 1, 3, 5, 7, 9 and 11), all mice received 1-hour access to a solution of saccharin (0.15% w/v sodium saccharin in tap water). Immediately after 1-hour access to saccharin, mice received injections of saline or 2.5 g/kg ethanol (days 1, 3, 5, 7 and 9). Mice also received 30-minute access to water 5 hours after each saccharin-access period to prevent dehydration (days 1, 3, 5, 7 and 9). On intervening days, mice had 2-hour continuous access to water at standard times in the morning (days 2, 4, 6, 8 and 10). Reduced consumption of the saccharin solution is used as a measure of CTA.
2.6. Ethanol-induced acute withdrawal
Mice were scored for handling-induced convulsion (HIC) severity 30 minutes before and immediately before i.p. ethanol administration. These two pre-drug baseline scores were averaged. A dose of 4.0 g/kg of ethanol in saline was injected i.p., and the HIC score was tested every hour until the HIC level reached baseline. Acute withdrawal was quantified as the area under the curve that was above the pre-drug level (Crabbe et al., 1991). Each mouse is picked up gently by the tail and, if necessary, gently rotated 180°, and the HIC is scored as follows: 5, tonic-clonic convulsion when lifted; 4, tonic convulsion when lifted; 3, tonic-clonic convulsion after a gentle spin; 2, no convulsion when lifted, but tonic convulsion elicited by a gentle spin; 1, facial grimace only after a gentle spin; 0, no convulsion.
2.7. Loss of righting reflex (LORR)
Sensitivity to the depressant effects of ethanol (3.4 and 3.6 g/kg), flurazepam (225 mg/kg), pentobarbital (50 mg/kg), and ketamine (175 mg/kg) were measured using the standard duration of LORR (sleep time) test in mice. When mice became ataxic, they were placed in the supine position in V-shaped plastic troughs until they were able to right themselves 3 times within 30 seconds. Sleep time was defined as the time from being placed in the supine position until they regained their righting reflex. An ethanol dose of 3.4 g/kg was used when measuring the effects of Kineret on the duration of LORR.
2.8. Rotarod
Mice were trained on a fixed speed rotarod (Economex; Columbus Instruments, Columbus, OH) at 5 rpm, and training was complete when mice were able to remain on the rotarod for 60 seconds. Every 15 minutes after injection of ethanol (2.0 g/kg i.p.), each mouse was placed on the rotarod and latency to fall was measured until the mouse was able to stay on the rotarod for 60 seconds.
2.9. Elevated plus maze
Mice were evaluated for basal anxiety as well as ethanol-induced anxiolysis using the elevated plus maze as described previously (Blednov et al., 2001). Mice were transported to the testing room 1 day before testing and were tested between 10:00 and 12:00 a.m. under ambient room light. Mice were weighed and injected with ethanol (1.25 g/kg, i.p.) or saline 10 minutes before testing. Each mouse was placed on the central platform of the maze facing an open arm. Mice were allowed to freely explore the maze for 5 minutes during which the following measurements were manually recorded: number of open arm entries, number of closed arm entries, total number of entries, time spent in open arms, and time spent in closed arms. The mouse was considered to be on the central platform or any arm when all four paws were within its perimeter.
2.10. Ethanol clearance
Animals were given a single dose of ethanol (4.0 g/kg, i.p.), and blood samples were taken from the retro-orbital sinus 30, 60, 120, 180, and 240 minutes after injection. Blood ethanol concentration (BEC) values were determined spectrophotometrically by an enzymatic assay (Lundquist, 1959).
2.11. Rationale for the behavioral tests
Two-bottle choice (continuous, 24-hour access) is the most widely used test of ethanol preference and voluntary consumption and is related to other measures of ethanol reward (Green and Grahame, 2008). Other tests of ethanol intake (one- and two-bottle DID) produce high levels of ethanol consumption by limiting access to ethanol. Conditioned taste aversion is used as the index of aversive properties to ethanol and is negatively correlated with voluntary ethanol intake (Green and Grahame, 2008). Duration of LORR measures the anesthetic or sedative activities of ethanol, and for some mutant mice it is negatively correlated with voluntary ethanol consumption (Crabbe et al., 2006). Acute ethanol withdrawal measures sensitivity to the development of ethanol physical dependence and is also negatively correlated with ethanol intake in the two-bottle choice test (Metten et al., 1998). The behavior in the elevated-plus maze indicates the level of anxiety and is regulated by GABAergic systems. Ethanol responses in most of these tests are changed after deletion of specific subunits of GABAA receptors (Blednov et al., 2013, Blednov et al., 2003, Boehm et al., 2004).
2.12. Drug injection
All injectable ethanol (Aaper Alcohol and Chemical, Shelbyville, KY) solutions were prepared in 0.9% saline (20%, v/v) and injected i.p. Flurazepam (Sigma-Aldrich, St. Louis, MO; 225 mg/kg, i.p.), ketamine (Sigma-Aldrich; 175 mg/kg, i.p.), and pentobarbital (Sigma/RBI, Natick, MA; 50 mg/kg, i.p.) were dissolved in 0.9% saline and injected at 0.01 ml/g of body weight. Human IL-1ra (Kineret or anakinra, Amgen Inc., Thousand Oaks, CA, USA) was purchased from The University of Texas at Austin Pharmacy (Austin, TX). For animal behavioral studies, Kineret was freshly diluted in 0.9% saline and injected i.p. at 100 mg/kg in a volume of 0.1 ml/10g of body weight 30 minutes before administration of ethanol in the following tests (LORR, acute ethanol withdrawal, two-bottle choice, and ethanol clearance).
2.13. Statistical analysis
Values are reported as mean ± SEM. The software program GraphPad Prism (GraphPad Software, Inc., La Jolla, CA) was used, and two-way ANOVA with repeated measures followed by Bonferroni post hoc tests and Student’s t-tests were carried out to evaluate differences between groups. For most of the experiments, no gender-dependent differences in the effects of ethanol or other drugs were found, and the data obtained for males and females were combined.
3. Results
3.1. Loss of righting reflex
Duration of LORR was measured in Il1rn and Il1r1 KO and WT mice following the injection of four different sedative agents (ethanol, flurazepam, pentobarbital, or ketamine). After ethanol injection, there was increased duration of LORR in Il1rn KO and decreased duration in Il1r1 KO mice (Figure 1A, E). Flurazepam also prolonged the duration of LORR in Il1rn KO and shortened the duration in Il1r1 KO mice (Figure 1B, F). There were no differences in the duration of LORR in KO and WT mice after administration of ketamine or pentobarbital (Figure 1C, D, G, H). Data from females and males were combined because there were no gender differences.
Figure 1. Duration of LORR induced by ethanol, flurazepam, pentobarbital, or ketamine in Il1r or Il1rn KO mice.

A, E. Ethanol (3.4 g/kg, n=13–14; 3.6 g/kg, n=9–10 for Il1r KO and WT) and (3.4 g/kg, n=14; 3.6 g/kg, n=5–9 for Il1rn KO and WT). F1,42 = 54.2, p < 0.001, main effect of genotype; F1,42 = 6.1, p < 0.05, main effect of dose; no genotype x concentration interaction in Il1r KO mice; F1,38 = 27.9, p < 0.001, main effect of genotype; F1,38 = 5.1, p < 0.05, main effect of dose; no genotype x concentration interaction in Il1rn KO mice. B, F. Flurazepam (n=10 for Il1r KO and WT; n=11–12 for Il1rn KO and WT). t(18)=9.0 for Il1r KO; t(21)=9.8 for Il1rn KO. C, G. Ketamine (n=11–12 for Il1r KO and WT; n=9–10 for Il1rn KO and WT). D, H. Pentobarbital (n=11 for Il1r KO and WT; n=9 for Il1rn KO and WT). Data from females and males were combined because there were no gender differences. Values represent mean ± SEM. Data were analyzed by two-way ANOVA with Bonferroni post hoc test or by Student’s t-test (**p < 0.01, ***p < 0.001 vs. WT). EtOH=ethanol; LORR=loss of righting reflex; WT=wild type.
3.2. Ethanol-induced motor incoordination
Acute administration of ethanol (2.0 g/kg) produced motor incoordination in all genotypes, and Il1rn KO mice (both genders) showed a rate of recovery similar to WT (Figure 2C, D). Il1r1 KO female mice recovered faster than WT (Figure 2B), while the recovery in males was similar for WT and KO mice (Figure 2A).
Figure 2. Recovery from ethanol-induced motor incoordination in Il1r or Il1rn KO mice.

Data represent time in seconds (sec) on the rotarod after injection of ethanol (2.0 g/kg). A. Il1r KO male vs. WT mice (n=6 per genotype; F8,80 = 81.5, p < 0.001, dependence on time; no dependence on genotype or genotype x time interaction were found). B. Il1r KO female mice vs. WT (n=6 per genotype; F1,10 = 18.3, p < 0.01, dependence on genotype; F7,70 = 98.7, p < 0.001, dependence on time; F7,70 = 3.7, p < 0.01, genotype x time interaction). C. Il1rn KO male vs. WT mice (n=6 per genotype; F8,80 = 117, p < 0.001, dependence on time; no dependence on genotype or genotype x time interaction). D. Il1rn KO female vs. WT mice (n=5 per genotype; F7,56 = 78.3, p < 0.001, dependence on time; no dependence on genotype or genotype x time interaction). Data represent mean ± SEM. Data were analyzed by two-way repeated measures ANOVA followed by Bonferroni post hoc test (***p < 0.001 vs. WT for each time point). WT=wild type.
3.3. Acute ethanol withdrawal severity
A single 4.0 g/kg ethanol dose suppressed basal HIC in both KO strains and WT mice for about 5 hours, followed by increased HIC (Figure 3A, C). None of the groups differed in basal levels of HIC. Both mutants demonstrated signs of withdrawal (HIC scores higher than the basal level), and the severity of acute withdrawal (area above the basal level) was greater in Il1r1 KO compared to WT mice (Figure 3B). In contrast, Il1rn KO mice had lower withdrawal scores compared to WT (Figure 3D). Data from females and males were combined because there were no gender differences.
Figure 3. Severity of acute ethanol-induced withdrawal in Il1r or Il1rn KO mice.

A, B. Il1r KO vs. WT mice. A. HIC score (n=21 per genotype; F1,40 = 15.2, p < 0.001, dependence on genotype; F14,560 = 222, p < 0.001, dependence on time; F14,560 = 9.2, p < 0.001, genotype x time interaction). B. Area under the curve for the HIC score (above the basal level); t (40) = 4.5. C, D. Il1rn KO male mice vs. WT. C. HIC score (n=13 per genotype; F12,288 = 94.7, p < 0.001, dependence on time; F12,288 = 3.7, p < 0.001, genotype x time interaction; no dependence on genotype was found). D. Area under the curve for the HIC score (above the basal level); t(24)=3.8. Data from females and males were combined since there were no gender differences. The dotted and solid lines represent the average basal HIC scores for WT and KO mice, respectively, before administration of ethanol. Values represent mean ± SEM. Data were analyzed by two-way repeated measures ANOVA followed by Bonferroni post hoc test or Student’s t-test (***p < 0.001 vs. WT). HIC=handling induced convulsion; WT=wild type.
3.4. Ethanol consumption
Because we previously examined the effect of Il1rn deletion in three different drinking tests (Blednov et al., 2012), we studied the effect of Il1r1 deletion using these same tests. No differences in ethanol consumption or preference in the two-bottle choice test were found in Il1r1 KO mice of either sex compared to WT (Supplemental Figure 1; statistical analysis in Supplemental Table 1). There were also no differences in ethanol intake during limited access to 20% ethanol (two-bottle choice DID) (Supplemental Figure 2; statistical analysis in Supplemental Table 2). Moreover, all mice consumed similar amounts of ethanol during the first 3 days of 2-hour access and on day 4 with 4-hour access to ethanol during the limited access to 20% ethanol without choice (one-bottle DID) test (Supplemental Figure 3; statistical analysis in Supplemental Table 3). In contrast, Il1rn KO mice previously demonstrated reduced ethanol intake in these three drinking tests (Blednov et al., 2012).
3.5. Conditioned taste aversion (CTA)
In order to minimize initial fluctuations in saccharin intake and any differences between genders, intake was calculated as a percentage of the trial 0 consumption for each subject by dividing the amount of saccharin solution consumed on subsequent conditioning trials by the amount of saccharin consumed during trial 0 (before conditioning). Ethanol-saccharin pairings reduced saccharin intake across trials compared with saline-saccharin pairings, indicating the development of CTA in Il1r1 KO and WT mice (Figure 4A; statistical analysis in Supplemental Table 4). There were no differences in ethanol- or saline-treated groups of Il1r1 KO and WT mice. However, Il1rn KO mice did not develop CTA, and only WT showed a difference between saline- and ethanol-treated groups (Figure 4B; statistical analysis in Supplemental Table 5). Data from females and males were combined because there were no gender differences.
Figure 4. Decreased ethanol conditioned taste aversion in Il1rn but not Il1r KO mice.
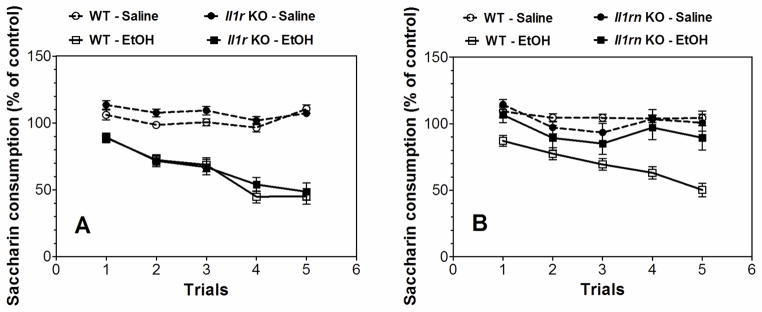
Data represent the changes in saccharin consumption produced by injection of saline or ethanol (2.5 g/kg) expressed as percent of control trial (Trial 0). A. Development of CTA in Il1r KO mice (n=15–17 for saline in both genotypes; n=20–21 for ethanol in both genotypes). Saline-Ethanol pairings for WT mice: (F1,35 = 81, p < 0.001, effect of treatment; F4,140 = 20.6, p < 0.001, dependence on trial; F4,140 = 20.1, p < 0.001, treatment x trial interaction). Saline-Ethanol pairings for Il1r KO mice: (F1,34 = 58.5, p < 0.001, effect of treatment; F4,136 = 24.1, p < 0.001, dependence on trial; F4,136 = 10.4, p < 0.001, treatment x trial interaction). Genotype-Saline pairings: (F4,120 = 6.1, p < 0.001, effect of trial; no dependence on genotype or genotype-trial interaction). Genotype-Ethanol pairings: (F4,156 = 60.4, p < 0.001, effect of trial; no dependence on genotype or genotype-trial interaction). B. Development of CTA in Il1rn KO mice (n=7–13 for saline in both genotypes; n=13–18 for ethanol in both genotypes). Saline-Ethanol pairings for WT mice: (F1,29 = 58.3, p < 0.001, effect of treatment; F4,116 = 11.6, p < 0.001, dependence on trial; F4,116 = 7.3, p < 0.001, treatment x trial interaction). Saline-Ethanol pairings for Il1rn KO mice: (F4,72 = 6.2, p < 0.001, dependence on trial; no effect of treatment or treatment x trial interaction). Genotype-Saline pairings: (F4,72 = 3.5, p < 0.05, effect of trial; no dependence on genotype or genotype-trial interaction). Genotype-Ethanol pairings: (F1,29 = 10.2, p < 0.01, effect of genotype, F4,116 = 14.7, p < 0.001, dependence on trial, F4,116 = 5.3, p < 0.001, genotype x trial interaction). Data from females and males were combined because there were no gender differences. Values represent mean ± SEM. Data were analyzed by two-way repeated measures ANOVA. WT=wild type; EtOH=2.5 g/kg ethanol.
3.6. Anxiety-related behavior
In the plus-maze, locomotor activity was assessed by the number of entries into the closed arms, whereas anxiety-related behavior was measured by the percentage of time spent in open arm entries after injection of saline or ethanol. For both mutants, ethanol treatment increased the percentage of time spent in open arms (Supplemental Figure 4A, D) and the percentage of open arm entries (Supplemental Figure 4B, E). There were no differences between KO and WT groups for either parameter. The number of closed arm entries was not dependent on genotype or ethanol treatment in Il1r1 KO mice (Supplemental Figure 4C). However, in Il1rn KO mice, ethanol increased the number of entries into the closed arms, but there was no dependence on genotype (Supplemental Figure 4F).
3.7. Blood ethanol concentration (BEC)
There were no differences in the rate of ethanol (4.0 g/kg) clearance in WT and Il1r1 KO mice of either sex (Figure 5A, B), but Il1rn KO mice showed faster clearance of ethanol compared to WT (Figure 5C, D). To determine if the faster blood ethanol clearance in Il1rn KO mice could impact other behavioral phenotypes and potentially interfere with expected results, we measured the BEC in WT and Il1rn KO mice at the time of their recovery from ethanol-induced motor incoordination on the rotarod. Consistent with previous results (Figure 2), no differences in ethanol recovery time were found between WT and Il1rn KO mice of either sex (Table 1). However, the BEC at the time of recovery was significantly lower in KO compared with WT mice (Table 1).
Figure 5. Clearance of ethanol in Il1r or Il1rn KO mice.

A, B. Il1r KO vs. WT mice (n=7–8 per genotype). C, D. Il1rn KO vs. WT mice (n=8 per genotype). A, C. BEC (mg/dl). B, D. Slope t(14)=6.1 for Il1rn KO mice, ***p < 0.001 vs. WT. Data from females and males were combined because there were no gender differences. Data were analyzed by Student’s t-test. BEC=blood ethanol concentration; WT=wild type.
Table 1.
Blood ethanol concentration in Il1rn KO and WT mice at the time of recovery from ethanol-induced motor incoordination on the rotarod.
| Males | Females | |||
|---|---|---|---|---|
| WT | KO | WT | KO | |
| Time for recovery (min) | 97.1 ± 5.4 (7) | 101 ± 5.4 (10) | 88.9 ± 4.4 (12) | 91.9 ± 3.1 (9) |
| BEC (mg/dl) at time of recovery | 215 ± 3.7 (7) | 202 ± 4.9* (10) | 222 ± 5.8 (12) | 171 ± 18* (9) |
Values (mean ± SEM) represent the recovery time in minutes (min) after injection of ethanol (2.0 g/kg) and the blood ethanol concentration (BEC, mg/dl) at the time of recovery on the rotarod. Data were analyzed by Student’s t-tests (*p<0.05 vs. WT of corresponding genotype). The number of mice tested is shown in parenthesis.
3.8. Kineret and ethanol effects in Il1rn KO mice
Reduced duration of ethanol-induced LORR after administration of Kineret has been reported in WT mice (Wu et al., 2011), consistent with our findings that mice lacking Il1r1 show reduced duration of ethanol-induced LORR while mice lacking Il1rn show increased duration. These two mutants also showed opposite changes in flurazepam-induced LORR and in severity of acute ethanol withdrawal. We then determined if administration of Kineret in WT mice would reproduce the phenotype observed in Il1r1 KO mice and if it would reverse the phenotype in Il1rn KO mice. As noted above, Il1rn KO mice demonstrated longer duration of LORR after ethanol and flurazepam (Figure 1). Administration of Kineret altered this phenotype as shown by the reduced duration of LORR after ethanol and flurazepam in male mice lacking Il1rn (Figure 6A, B). Il1r1 KO mice demonstrated shorter duration of LORR after flurazepam (Figure 1). Kineret mimicked this phenotype in C57BL/6J male mice and reduced the duration of flurazepam-induced LORR (Figure 6C). The increased severity of acute ethanol withdrawal in Il1r1 KO mice (Figure 3A, B) was also reproduced by administration of Kineret in WT mice (Figure 7A, B). Il1rn KO mice showed reduced acute ethanol withdrawal (Figure 3C, D), and Kineret increased the withdrawal (Figure 7C, D). Only male mice were tested here and in the remaining figures.
Figure 6. Kineret reduces the duration of drug-induced LORR in Il1rn KO and C57BL/6J mice.

A. 3.4 g/kg ethanol in Il1rn KO mice (n=6 per group; t(10)=12.9). B. 225 mg/kg flurazepam in Il1rn KO (n=6 per group; t(10)=10.4). C. 225 mg/kg flurazepam in C57BL/6J (n=8; t(14)=12.4). Only male mice were tested. Values represent mean ± SEM. Data were analyzed by Student’s t-test (***p < 0.001 Kineret- vs. saline-treated groups). LORR=loss of righting reflex; EtOH=ethanol.
Figure 7. Kineret increases the severity of acute ethanol withdrawal in WT and Il1rn KO mice.

A. HIC score in WT. (n=12–15 per group; F1,25 = 12, p < 0.01, dependence on treatment; F13,325 = 181, p < 0.001, dependence on time; F13,325 = 3.1, p < 0.001, treatment x time interaction). B. Area under the curve for the HIC score (above the basal level) in WT. t(24)=2.3, *p < 0.05 saline vs. Kineret group. C. HIC score in Il1rn KO mice. (n=11–12 per group; F1,21 = 5.0, p < 0.05, dependence on treatment; F13,273 = 73.4, p < 0.001, dependence on time; F13,273 = 3.6, p < 0.001, treatment x time interaction). D. Area under the curve for the HIC score (above the basal level) in Il1rn KO mice. t(21)=2.5, *p < 0.05 saline vs. Kineret group. Only male mice were tested. Values represent mean ± SEM. Data were analyzed by two-way repeated measures ANOVA followed by Bonferroni post hoc test or Student’s t-test. HIC=handling induced convulsion; WT=wild type.
Some of the ethanol responses were changed in only one of the mutant strains. For example, reduction of intake and faster clearance of ethanol were observed in mice lacking Il1rn but not in mice lacking Il1r1. We used Kineret to determine if deleting Il1rn influences IL-1R1 signaling for these ethanol effects. Kineret did not change ethanol consumption, preference, or total fluid intake (Figure 8D–F) and did not prevent faster ethanol clearance in the blood of Il1rn KO mice (Figure 9). In WT, Kineret only slightly increased ethanol intake after 4 days but did not change preference or total fluid intake (Figure 8A–C).
Figure 8. Effect of Kineret on ethanol consumption in the two-bottle choice test in WT and Il1rn KO mice.

A–C. Il1rn WT (n=7 per group). D–F. Il1rn KO mice (n=5–6 per group). A, D. Ethanol consumption (g/kg/24 hours). B, E. Preference. C, F. Total fluid intake (g/kg/24 hours). Only male mice were tested. Values represent mean ± SEM. Data obtained after 2 days of saline or Kineret injections (day 4 in all panels) were analyzed by Student’s t-test (*p < 0.05 saline vs Kineret). EtOH=ethanol; WT=wild type.
Figure 9. Kineret did not affect the faster clearance of ethanol observed in Il1rn KO mice.

A. BEC (mg/dl; n = 7–8 per group). B. Slope. Values represent mean ± SEM. Data were analyzed by Student’s t-test; t(13)=1.27, p > 0.05 vs. saline. Only male mice were tested. BEC=blood ethanol concentration.
3.9 Kineret and ethanol effects in Il1r1 KO mice
Consistent with results by Wu et al. (2011), Kineret reduced the duration of ethanol-induced LORR in WT mice (Figure 10A). However, it did not affect LORR duration in mice lacking Il1r1 (Figure 10A), indicating that the IL-1R1 receptor is required for Kineret action. We then studied the effect of Kineret on motor incoordination to determine if Kineret might produce sedative effects in WT mice. Kineret was administered at 100 mg/kg (i.p.) 30 min before saline injection, and time on the rotarod was measured every 15 min after saline injection. Kineret produced no sedative activity (Figure 10B).
Figure 10. Kineret did not affect the duration of ethanol-induced LORR in Il1r KO mice and did not have sedative activity in Il1rn WT mice.
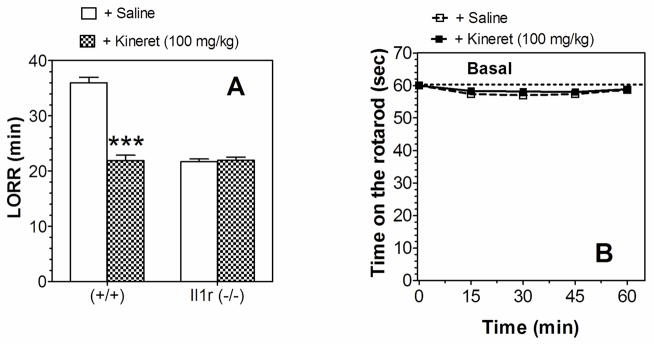
A. LORR using 3.4 g/kg ethanol in Il1r KO (n=5–7 per group) and WT mice (n=5–7 per group); (F1,20 = 90.7, effect of treatment; F1,20 = 96.2, effect of genotype; F1,20 = 97.4, genotype x treatment interaction). Data were analyzed by two-way ANOVA with Bonferroni post hoc test (***p < 0.001 Kineret- vs. saline-treated groups). B. Time on the rotarod in Il1rn WT mice (n=6 per group). Kineret (100 mg/kg) was administered 30 min before saline injection. After saline injection, the time on the rotarod was measured every 15 min for 60 min. Values represent mean ± SEM. Data were analyzed by two-way repeated measures ANOVA. Only male mice were tested. LORR=loss of righting reflex.
4. Discussion
IL-1 signaling is lost in mice lacking Il1r1 and inflammatory responses decrease while susceptibility to certain infectious agents increases (Labow et al., 1997). These mice fail to respond to i) IL-1-induced increases in serum IL-6 levels, ii) IL-1-induced fever, and iii) IL-1-induced B cell proliferation in vitro (Glaccum et al., 1997; Labow et al., 1997). Because IL-1ra inhibits IL-1-induced cytokine production, elevated cytokine levels would be expected in mice lacking Il1rn. Levels of IL-1α and IL-1β are increased in lipopolysaccharide-exposed peritoneal macrophages obtained from mice lacking Il1rn (Mizutani et al., 2013). Also, IL-1β (but not IL-1α) mRNA levels in whole brain increase following turpentine injection in Il1rn KO mice (Horai et al., 1998). However, IL-1α and IL-1β serum levels following endotoxemia are lower in mice lacking Il1rn, while IL-6 levels (inducible by IL-1) are higher (Hirsch et al., 1996). Decreased circulating levels of IL-1 cytokines in mice lacking the receptor antagonist could serve as a compensatory control mechanism to shift levels toward baseline. The complexity of cytokine regulatory systems in vivo, the different stimulatory conditions and genetic backgrounds, and the presence of other physiological regulators of IL-1 may account for the different findings.
Our results show that deletion of Il1r1 or Il1rn or administration of Kineret alters several alcohol-induced behaviors (for summaries, see Tables 2,3). We used both genetic and pharmacological approaches to determine which behaviors are most consistent with changes in IL-1R1 signaling. Evidence for a role of the IL-1R1 system in the sedative effects of ethanol and flurazepam and the severity of acute ethanol withdrawal was based on the following: (1) opposite effects in mice lacking Il1r1 vs. Il1rn, (2) similar effects in mice lacking Il1r1 and administration of Kineret to WT mice, and (3) reversal of the Il1rn null phenotype by Kineret. All three criteria were fulfilled for the sedative effects of ethanol and flurazepam and acute ethanol withdrawal severity, but none of the criteria were met for other behaviors. It is interesting that behaviors that failed to meet the genetic criterion (1 above) also failed to meet pharmacological criteria (2 and 3 above), providing consistent evidence that some responses were not regulated by IL-1R1 function. While informative and compelling, these criteria do not prove specificity for the IL-1R1 system, and additional mechanistic studies will be required.
Table 2.
Summary of the behavioral effects of ethanol and other drugs in Il1r1 and Il1rn KO mice.
| Il1rn KO | Il1r1 KO | ||
|---|---|---|---|
| Test | Treatment | ||
| LORR | Ethanol | ↑ | ↓ |
| LORR | Flurazepam | ↑ | ↓ |
| LORR | Ketamine | = | = |
| LORR | Pentobarbital | = | = |
| Acute withdrawal | Ethanol | ↓ | ↑ |
| Two-bottle choice (Ethanol 3–18%) | Ethanol intake (g/kg/24 hours) | ↓ (a) | = |
| Preference | ↓ (a) | = | |
| Fluid intake (g/kg/24 hours) | = (a) | = | |
| Two-bottle choice (Saccharin) | Preference | = (a) | = |
| Fluid intake (g/kg/24 hours) | ↓ (a) | = | |
| Two-bottle choice (Quinine) | Preference | = (a) | = |
| Fluid intake (g/kg/24 hours) | = (a) | = | |
| Two-bottle DID (Ethanol-20%) | Ethanol (g/kg/3 hours) | ↓ (a) | = |
| Preference | ↓ (a) | = | |
| Fluid intake (g/kg/3 hours) | ↑ (a) | = | |
| One-bottle DID (Ethanol-20%) | Ethanol (g/kg/2–4 hours) | ↓ (a) | = |
| Rotarod (recovery) | Ethanol | = | ← (females) |
| Anxiety (elevated plus-maze) | Ethanol | = | = |
| CTA (Saccharin) | Ethanol | ↓ | = |
| Clearance | Ethanol | ↑ | = |
Results from Blednov et al. (2012).
CTA, conditioned taste aversion; LORR, loss of righting reflex; DID, drinking in the dark; (↓) decreased response in null mutant compared with corresponding WT; (↑) increased response in null mutant compared with corresponding WT; (=) no difference between null mutant and WT; (←) left shift in null mutant compared with corresponding WT.
Enhancement of IL-1R1 signaling appears to be important in increasing the sedative actions of ethanol and flurazepam and reducing ethanol withdrawal severity. This is generally consistent with the finding that IL-1β enhances GABAergic function in brain (Serantes et al., 2006; Brambilla et al., 2007) and that many ethanol-mediated behaviors are influenced by GABAergic function (Boehm et al., 2006, Kumar et al., 2009). The reduction in alcohol withdrawal by increased IL-1R1 function may seem inconsistent with data showing that IL-1β is proconvulsant and is elevated in experimental epilepsy (Vezzani et al., 2008), but the HIC observed during alcohol withdrawal would be expected to have neurochemical and brain regional determinants that are distinct from epileptic seizures (Becker et al., 1998, Chen and Buck, 2010). Ketamine-induced LORR was not altered in either of the null mutants, indicating that glutamatergic sedative responses were not regulated by IL-1R1 function, in contrast to the GABAergic signaling of flurazepam responses. It is interesting that pentobarbital-induced LORR was not altered even though its sedative and immobilizing actions are due to enhancement of GABAergic function. However, these behaviors are critically dependent upon actions of pentobarbital on GABAA receptors containing the β3 subunit (Zeller et al., 2007), whereas the sedative actions of benzodiazepines require the α1 subunit (Rudolph et al., 1999). Thus, IL-1R1 signaling may selectively augment synaptic GABAA receptors (which contain α1 subunits) rather than extrasynaptic receptors (which are more likely to contain β3 subunits) (Sigel and Steinmann, 2012). IL-1β increases a tonic inhibitory current generated by α5-containing GABAA receptors in hippocampal neurons (Wang et al., 2012); overall, the subunit composition, brain region, and cellular localization are all likely critical determinants of GABAA receptor regulation by IL-1R1.
We recently reported that baseline evoked GABAA-inhibitory postsynaptic potentials and the frequency of spontaneous GABAA-inhibitory postsynaptic currents were significantly increased in central amygdala slices from mice lacking IL-1ra, indicating enhanced presynaptic action potential-dependent GABA release in these KO mice (Bajo et al., 2014). Also, ethanol-induced facilitation of evoked and spontaneous GABA release was lost in most of the neurons from KO compared to WT mice, and this effect was reversed by pretreatment with Kineret. Furthermore, a cell-type specific switch occurred in the tonic GABAA receptor conductance such that the conductance in low threshold bursting neurons was lost and a tonic conductance in late spiking neurons appeared. Increases in basal spontaneous action potential-mediated GABA release and changes in the tonic GABA conductance of specific neurons in Il1rn KO mice could impact overall activity in the central amygdala and its GABAergic projection afferents, thus altering alcohol-related behaviors as shown in the current study. The electrophysiological analysis, together with our behavioral characterization, provide corroborating evidence that changes mediated by the IL-1R1 system are involved in alcohol responses at both the neuronal and in vivo levels in mice.
Deleting broad acting genes like Il1rn or Il1r1 might be expected to produce compensatory changes during development that affect diverse signaling systems in the adult (Crabbe et al., 2006, Ponomarev et al., 2006). Mice lacking the receptor antagonist exhibit abnormal development (Hirsch et al., 1996), whereas mice lacking the receptor do not show overt phenotypic changes (Glaccum et al., 1997; Labow et al., 1997). It is interesting that more ethanol-induced responses were altered following deletion of Il1rn compared to Il1r1 (Table 2). Deleting Il1rn could produce pleiotropic effects that are not confined to augmentation of IL-1R1 function. These global changes would not necessarily be reversed by a simple ‘replacement therapy’ with Kineret, underscoring the importance of using this as a pharmacological validation in both WT and KO groups. One example of the pleiotropic effects in Il1rn KO mice is increased clearance of ethanol, which may be a confounding factor in evaluating behavioral sensitivity to ethanol. Based on the effects of Kineret reported in Wu et al. (2011), we expected that deletion of Il1rn would slow recovery from ethanol-induced motor incoordination; however, we did not observe any change. It is possible that faster ethanol clearance in Il1rn KO mice could obscure a slower recovery. In fact, we found lower BECs in both male and female KO mice at the time of recovery from ethanol-induced motor incoordination, indicating that this could explain why a longer recovery time was not observed in these mutants. We also note that mice on a C57BL/6J genetic background are characterized by high levels of ethanol intake, which may account for the lack of effect on ethanol intake in mice lacking Il1r1. Overall, our combined genetic and pharmacological analyses provide evidence for a role of IL-1 signaling in ethanol sedation and severity of acute withdrawal, though compensatory effects and genetic background of the mutants may contribute to some of the observed behaviors.
Our interest in IL-1ra arose, in part, from the observation that Il1r1, Il1rap, and Il1rn gene expression was altered in mice with a genetic predisposition for high alcohol consumption (Mulligan et al., 2006). In addition, we found that deletion of Il1rn markedly reduced alcohol consumption in three different drinking tests (Blednov et al., 2012). However, the present results do not support the IL-1R1 system as a key regulator of alcohol consumption, and suggest that the marked effects of deleting Il1rn on ethanol drinking may be due to compensatory changes following deletion of this key immune modulator. For example, the loss of CTA acquisition seen in mice lacking Il1rn could be partly responsible for the reduced ethanol consumption observed in these mice. CTA produced by ethanol or drugs such as lithium chloride has been generally accepted as indicating negative hedonic effects (Garcia et al. 1974), and alcohol consumption is sometimes negatively correlated with development of CTA (Green and Grahame, 2008). This is the opposite of the relationship found for Il1rn KO mice. At least two alternative theories have been offered to explain CTA produced by self-administered drugs. Both are based on the notion that the rewarding effects of drugs underlie the production of CTA. Hunt and Amit (1987) proposed that self-administered drugs produce conditioned “taste shyness,” whereby a novel drug stimulus paired with a novel taste elicits avoidance of the flavor. These same drug stimulus properties are also thought to subserve reinforcement in self-administration procedures. Another view is based on a process termed “reward comparison” (Grigson 1997). This interpretation is related to anticipatory contrast, in which consumption of a preferred solution (e.g., saccharin) is reduced in situations where it predicts availability of a more preferred sucrose solution (Flaherty and Checke, 1982). Thus, in the CTA paradigm, reduction in intake of a preferred flavor could represent greater preference for the drug. Alternately, lack of change in intake of a preferred flavor may represent weaker preference for the drug and might explain the reduction of ethanol intake and preference in mice lacking Il1rn. It should also be noted that CTA is used to study the formation of long-term non-declarative memory in the mammalian brain (Rosenblum et al., 1997), and loss of ethanol-induced CTA in mice lacking Il1rn may reflect overall cognitive dysfunction. In fact, central inflammation and cognitive impairment evoked by fat transplantation in mice are correlated with levels of Il-1β, and intra-hippocampal administration of IL-1ra reverses cognitive and synaptic deficits (Erion et al., 2014).
Although changes in IL-1R1 related genes were reported in mice with a genetic predisposition to consume high amounts of ethanol (Mulligan et al. 2006), these genes were not identified in brain tissue from mice exposed to ethanol or in human alcoholics. Thus, genetic associations do not necessarily reflect the same genes that show changes in expression in response to alcohol exposure.
A caveat of the present study is that the genetic manipulations affect peripheral as well as central IL-1R1 signaling. It is possible that a brain-specific (regional or cell type) analysis would reveal a targeted role of IL-1R1 that is obscured by the global effects of the null mutants. For example, the ability of Kineret to reverse or restore some, but not all, of the alcohol effects indicates that the mutations may induce compensatory changes that are brain region- and/or cell type-specific.
5. Conclusion
We propose that the IL-1R1/IL-1ra complex regulates specific ethanol behaviors, and our work provides strong support for IL-1R1 signaling in alcohol sedation and withdrawal severity. This system also affects the sensitivity to flurazepam sedation, suggesting that at least some of the behaviors may be due to enhancement of GABAergic neurotransmission (also see Bajo et al., 2014). Although deletion of IL-1ra markedly decreased ethanol consumption and preference (Blednov et al., 2012), our current comprehensive study comparing different null mutants and different drugs, does not provide evidence for a predominant role of the IL-1R1 pathway in alcohol consumption. The powerful approach of combining genetic and pharmacological evaluations with comparison of different drugs allows for a more rigorous assessment of knockout mutations and their impact on drug-related behaviors.
Supplementary Material
A–C. Males (n=16 per genotype). D–F. Females (n=14–17 per genotype). A, D. Ethanol consumption (g/kg/24 hours); no main effects of genotype, concentration, or genotype x concentration interaction were found for either sex. B, E. Preference for ethanol; no main effects of genotype, concentration, or genotype x concentration interaction were found for either sex. C, F. Total fluid intake (g/kg/24 hours); no main effects of genotype, concentration, or genotype x concentration interaction were found for either sex. Data were analyzed by two-way repeated measures ANOVA. EtOH=ethanol; KO=knockout; WT=wild type.
A–C. Males (n=6 for each genotype). D–F. Females (n=6–7 per genotype). A, D. Ethanol consumption (g/kg/3 hours); no main effects of genotype, concentration, or genotype x concentration interaction were found for either sex. B, E. Preference for ethanol; no main effects of genotype, concentration, or genotype x concentration interaction were found for either sex. C, F. Total fluid intake (g/kg/3 hours); no main effects of genotype, concentration, or genotype x concentration interaction were found for either sex. Data were analyzed by two-way repeated measures ANOVA. EtOH=ethanol; KO=knockout; WT= wild type.
A. Males (n=6 for each genotype). Ethanol consumption for days 1–3 (g/kg/2 hours) and day 4 (g/kg/4 hours); no differences between WT and KO mice were found for any time periods. B. Females (n=6 for each genotype). Ethanol consumption for days 1–3 (g/kg/2 hours) and day 4 (g/kg/4 hours); no differences between WT and KO mice were found for any time periods. Data were analyzed by two-way repeated measures ANOVA (days 1–3) or Student’s t-test (day 4). EtOH=ethanol; KO=knockout; WT=wild type.
A–C. Il1r KO (n=14–17) vs. WT (n=12) mice. D–F. Il1rn KO (n=11–12) vs. WT (n=10) mice. A, D. Ethanol affects the percent of time in the open arms. (F1,53 = 42, p < 0.001 for Il1r KO; F1,39 = 27, p < 0.001 for Il1rn KO). B, E. Ethanol affects the percent of entries into the open arms (F1,53 = 96, p < 0.001 for Il1r KO; F1,39 = 27, p < 0.001 for Il1rn KO). C, F. Ethanol increased the number of entries into the closed arms in Il1rn KO mice (F1,39 = 18.9, p < 0.001, effect of treatment). Data from females and males were combined because there were no gender differences. Values represent mean ± SEM. Data were analyzed by two-way ANOVA followed by Bonferroni post hoc test. *p < 0.05, ** p < 0.01, ***p < 0.001 vs. saline group (n=13–19 per group). EtOH=ethanol; KO=knockout; WT=wild type.
Supplemental Table 1. Statistical analyses of ethanol intake, preference, and total fluid intake in the two-bottle choice test in Il1r1 knockout mice.
Supplemental Table 2. Statistical analyses of ethanol intake, preference, and total fluid intake in the limited access to ethanol with free choice (two-bottle drinking in the dark) test in Il1r1 knockout mice.
Supplemental Table 3. Statistical analyses of ethanol intake in the limited access to ethanol without free choice (one-bottle drinking in the dark) test in Il1r1 knockout mice.
Supplemental Table 4. Statistical analyses of the ethanol-induced conditioned taste aversion in Il1r1 knockout mice.
Supplemental Table 5. Statistical analyses of the ethanol-induced conditioned taste aversion in Il1rn knockout mice.
Table 3.
Summary of the effects of Kineret on ethanol- and flurazepam-induced behavioral phenotypes in Il1r1 and Il1rn KO and WT mice.
| Il1rn | Il1r1 | ||||
|---|---|---|---|---|---|
| Test | Treatment | WT | KO | WT | KO |
| LORR | Ethanol + Kineret | ↓ | ↓(b) | ||
| LORR | Flurazepam + Kineret | ↓ | ↓ | ||
| Acute withdrawal | Ethanol + Kineret | ↑ | ↑ | ||
| Clearance | Ethanol + Kineret | = | =(b) | ||
| Two-bottle choice (Ethanol 10%) + Kineret | Ethanol intake (g/kg/24 hours) | ↑ | = | ||
| Preference | = | = | |||
| Fluid intake (g/kg/24 hours) | = | = | |||
Results from Wu et al. (2011).
LORR, loss of righting reflex; (↓) decreased response after administration of Kineret; (↑) increased response after administration of Kineret; (=) no difference between effect of Kineret vs. saline injection.
Deleting Il1rn or Il1r1 has opposite effects on ethanol and flurazepam sedation
Deleting Il1rn or Il1r1 has opposite effects on acute ethanol withdrawal
Kineret alters the effects observed in Il1rn knockout mice
In wild type mice Kineret reproduces the effects observed in Il1r1 knockout mice
Some ethanol and benzodiazepine behaviors are regulated by IL-1R1/IL-1ra
Acknowledgments
Supported by NIH/NIAAA grants AA013520 (INIA West Consortium) to Y.A.B. and R.A.H. and AA006399 to R.A.H.
Footnotes
Author Contributions: Y.A.B. designed and performed experiments, analyzed data, prepared figures, and wrote the manuscript; J.M.B and M.B. performed experiments, J.M. critically reviewed, wrote, and edited the manuscript; R.A.H. designed experiments and edited the manuscript.
Publisher's Disclaimer: This is a PDF file of an unedited manuscript that has been accepted for publication. As a service to our customers we are providing this early version of the manuscript. The manuscript will undergo copyediting, typesetting, and review of the resulting proof before it is published in its final citable form. Please note that during the production process errors may be discovered which could affect the content, and all legal disclaimers that apply to the journal pertain.
References
- Arend WP, Guthridge CJ. Biological role of interleukin 1 receptor antagonist isoforms. Ann Rheum Dis. 2000;59(Suppl 1):i60–64. doi: 10.1136/ard.59.suppl_1.i60. [DOI] [PMC free article] [PubMed] [Google Scholar]
- Bajo M, Herman MA, Varodayan FP, Oleata CS, Madamba SG, Harris RA, Blednov YA, Roberto M. Role of the IL-1 receptor antagonist in ethanol-induced regulation of GABAergic transmission in the central amygdala. Brain Behav Immun. 2014 Dec 3; doi: 10.1016/j.bbi.2014.11.011. pii: S0889–1591(14)00555-8. [Epub ahead of print] [DOI] [PMC free article] [PubMed] [Google Scholar]
- Becker HC, Veatch LM, Diaz-Granados JL. Repeated ethanol withdrawal experience selectively alters sensitivity to different chemoconvulsant drugs in mice. Psychopharmacology. 1998;139:145–153. doi: 10.1007/s002130050699. [DOI] [PubMed] [Google Scholar]
- Blednov YA, Benavidez JM, Black M, Chandra D, Homanics GE, Rudolph U, Harris RA. Linking GABA(A) receptor subunits to alcohol-induced conditioned taste aversion and recovery from acute alcohol intoxication. Neuropharmacology. 2013;67:46–56. doi: 10.1016/j.neuropharm.2012.10.016. [DOI] [PMC free article] [PubMed] [Google Scholar]
- Blednov YA, Benavidez JM, Geil C, Perra S, Morikawa H, Harris RA. Activation of inflammatory signaling by lipopolysaccharide produces a prolonged increase of voluntary alcohol intake in mice. Brain Behav Immun. 2011;25(Suppl 1):S92–S105. doi: 10.1016/j.bbi.2011.01.008. [DOI] [PMC free article] [PubMed] [Google Scholar]
- Blednov YA, Ponomarev I, Geil C, Bergeson S, Koob GF, Harris RA. Neuroimmune regulation of alcohol consumption: behavioral validation of genes obtained from genomic studies. Addict Biol. 2012;17:108–120. doi: 10.1111/j.1369-1600.2010.00284.x. [DOI] [PMC free article] [PubMed] [Google Scholar]
- Blednov YA, Stoffel M, Chang SR, Harris RA. GIRK2 deficient mice. Evidence for hyperactivity and reduced anxiety. Physiol Behav. 2001;74:109–117. doi: 10.1016/s0031-9384(01)00555-8. [DOI] [PubMed] [Google Scholar]
- Blednov YA, Walker D, Alva H, Creech K, Findlay G, Harris RA. GABAA receptor alpha 1 and beta 2 subunit null mutant mice: behavioral responses to ethanol. J Pharmacol Exp Ther. 2003;305:854–863. doi: 10.1124/jpet.103.049478. [DOI] [PubMed] [Google Scholar]
- Boehm SL, 2nd, Ponomarev I, Blednov YA, Harris RA. From gene to behavior and back again: new perspectives on GABAA receptor subunit selectivity of alcohol actions. Adv Pharmacol. 2006;54:171–203. doi: 10.1016/s1054-3589(06)54008-6. [DOI] [PubMed] [Google Scholar]
- Boehm SL, 2nd, Ponomarev I, Jennings AW, Whiting PJ, Rosahl TW, Garrett EM, Blednov YA, Harris RA. gamma-Aminobutyric acid A receptor subunit mutant mice: new perspectives on alcohol actions. Biochem Pharmacol. 2004;68:1581–1602. doi: 10.1016/j.bcp.2004.07.023. [DOI] [PubMed] [Google Scholar]
- Bohlen M, Hayes ER, Bohlen B, Bailoo J, Crabbe JC, Wahlsten D. Experimenter effects on behavioral test scores of eight inbred mouse strains under the influence of ethanol. Behav Brain Res. 2014;272:46–54. doi: 10.1016/j.bbr.2014.06.017. [DOI] [PMC free article] [PubMed] [Google Scholar]
- Brambilla D, Franciosi S, Opp MR, Imeri L. Interleukin-1 inhibits firing of serotonergic neurons in the dorsal raphe nucleus and enhances GABAergic inhibitory post-synaptic potentials. Eur J Neurosci. 2007;26:1862–1869. doi: 10.1111/j.1460-9568.2007.05796.x. [DOI] [PubMed] [Google Scholar]
- Bufalino C, Hepgul N, Aguglia E, Pariante CM. The role of immune genes in the association between depression and inflammation: a review of recent clinical studies. Brain Behav Immun. 2013;31:31–47. doi: 10.1016/j.bbi.2012.04.009. [DOI] [PubMed] [Google Scholar]
- Chen G, Buck KJ. Rostroventral caudate putamen involvement in ethanol withdrawal is influenced by a chromosome 4 locus. Genes Brain Behav. 2010;9:768–776. doi: 10.1111/j.1601-183X.2010.00611.x. [DOI] [PMC free article] [PubMed] [Google Scholar]
- Chirila AM, Brown TE, Bishop RA, Bellono NW, Pucci FG, Kauer JA. Long-term potentiation of glycinergic synapses triggered by interleukin 1beta. Proc Natl Acad Sci. 2014;111:8263–8268. doi: 10.1073/pnas.1401013111. [DOI] [PMC free article] [PubMed] [Google Scholar]
- Crabbe JC, Merrill C, Belknap JK. Acute dependence on depressant drugs is determined by common genes in mice. J Pharmacol Exp Ther. 1991;257:663–667. [PubMed] [Google Scholar]
- Crabbe JC, Phillips TJ, Harris RA, Arends MA, Koob GF. Alcohol-related genes: contributions from studies with genetically engineered mice. Addict Biol. 2006;11:195–269. doi: 10.1111/j.1369-1600.2006.00038.x. [DOI] [PubMed] [Google Scholar]
- Crews FT, Zou J, Qin L. Induction of innate immune genes in brain create the neurobiology of addiction. Brain Behav Immun. 2011;25(Suppl 1):S4–S12. doi: 10.1016/j.bbi.2011.03.003. [DOI] [PMC free article] [PubMed] [Google Scholar]
- Erion JR, Wosiski-Kuhn M, Dey A, Hao S, Davis CL, Pollock NK, Stranahan AM. Obesity elicits interleukin 1-mediated deficits in hippocampal synaptic plasticity. J Neurosci. 2014;34:2618–2631. doi: 10.1523/JNEUROSCI.4200-13.2014. [DOI] [PMC free article] [PubMed] [Google Scholar]
- Flaherty CF, Checke S. Anticipation of incentive gain. Animal Learning Behav. 1982;10:177–182. [Google Scholar]
- Garcia J, Hankins WG, Rusiniak KW. Regulation of the millieu interne in man and rat. Science. 1974;185:823–831. doi: 10.1126/science.185.4154.824. [DOI] [PubMed] [Google Scholar]
- Glaccum MB, Stocking KL, Charrier K, Smith JL, Willis CR, Maliszewski C, Livingston DJ, Peschon JJ, Morrissey PJ. Phenotypic and functional characterization of mice that lack the type I receptor for IL-1. J Immunol. 1997;159:3364–3371. [PubMed] [Google Scholar]
- Green AS, Grahame NJ. Ethanol drinking in rodents: is free-choice drinking related to the reinforcing effects of ethanol? Alcohol. 2008;42:1–11. doi: 10.1016/j.alcohol.2007.10.005. [DOI] [PMC free article] [PubMed] [Google Scholar]
- Grigson PS. Conditioned taste aversions and drugs of abuse: A reinterpretation. Behav Neurosci. 1997;111:129–136. [PubMed] [Google Scholar]
- Hirsch E, Irikura VM, Paul SM, Hirsh D. Functions of interleukin 1 receptor antagonist in gene knockout and overproducing mice. Proc Natl Acad Sci U S A. 1996;93:11088–1113. doi: 10.1073/pnas.93.20.11008. [DOI] [PMC free article] [PubMed] [Google Scholar]
- Horai R, Asano M, Sudo K, Kanuka H, Suzuki M, Nishihara M, Takahashi M, Iwakura Y. Production of mice deficient in genes for interleukin (IL)-1alpha, IL-1beta, IL-1alpha/beta, and IL-1 receptor antagonist shows that IL-1beta is crucial in turpentine-induced fever development and glucocorticoid secretion. J Exp Med. 1998;187:1463–1475. doi: 10.1084/jem.187.9.1463. [DOI] [PMC free article] [PubMed] [Google Scholar]
- Hunt T, Amit Z. Conditioned taste aversion induced by self-administered drugs: Paradox revisited. Neurosci Biobehav Rev. 1987;11:107–130. doi: 10.1016/s0149-7634(87)80005-2. [DOI] [PubMed] [Google Scholar]
- Kumar S, Porcu P, Werner DF, Matthews DB, Diaz-Granados JL, Helfand RS, Morrow AL. The role of GABA(A) receptors in the acute and chronic effects of ethanol: a decade of progress. Psychopharmacology. 2009;205:529–564. doi: 10.1007/s00213-009-1562-z. [DOI] [PMC free article] [PubMed] [Google Scholar]
- Labow M, Shuster D, Zetterstrom M, Nunes P, Terry R, Cullinan EB, Bartfai T, Solorzano C, Moldawer LL, Chizzonite R, McIntyre KW. Absence of IL-1 signaling and reduced inflammatory response in IL-1 type I receptor-deficient mice. J Immunol. 1997;159:2452–2461. [PubMed] [Google Scholar]
- Lippai D, Bala S, Csak T, Kurt-Jones EA, Szabo G. Chronic alcohol-induced microRNA-155 contributes to neuroinflammation in a TLR4-dependent manner in mice. PloS One. 2013;8:e70945. doi: 10.1371/journal.pone.0070945. [DOI] [PMC free article] [PubMed] [Google Scholar]
- Liu J, Lewohl JM, Dodd PR, Randall PK, Harris RA, Mayfield RD. Gene expression profiling of individual cases reveals consistent transcriptional changes in alcoholic human brain. J Neurochem. 2004;90:1050–1058. doi: 10.1111/j.1471-4159.2004.02570.x. [DOI] [PubMed] [Google Scholar]
- Liu L, Hutchinson MR, White JM, Somogyi AA, Coller JK. Association of IL-1B genetic polymorphisms with an increased risk of opioid and alcohol dependence. Pharmacogenet Genomics. 2009;19:869–876. doi: 10.1097/FPC.0b013e328331e68f. [DOI] [PubMed] [Google Scholar]
- Lundquist F. The determination of ethyl aclohol in blood and tissue. Methods Biochem Anal. 1959;7:217–251. [Google Scholar]
- Mayfield J, Ferguson L, Harris RA. Neuroimmune signaling: a key component of alcohol abuse. Curr Opin Neurobiol. 2013;23:513–520. doi: 10.1016/j.conb.2013.01.024. [DOI] [PMC free article] [PubMed] [Google Scholar]
- Metten P, Phillips TJ, Crabbe JC, Tarantino LM, McClearn GE, Plomin R, Erwin VG, Belknap JK. High genetic susceptibility to ethanol withdrawal predicts low ethanol consumption. Mamm Genome. 1998;9:983–990. doi: 10.1007/s003359900911. [DOI] [PubMed] [Google Scholar]
- Mizutani H, Ishihara Y, Izawa A, Fujihara Y, Kobayashi S, Gotou H, Okabe E, Takeda H, Ozawa Y, Kamiya Y, Kamei H, Kikuchi T, Yamamoto G, Mitani A, Nishihara T, Noguchi T. Lipopolysaccharide of Aggregatibacter actinomycetemcomitans up-regulates inflammatory cytokines, prostaglandin E2 synthesis and osteoclast formation in interleukin-1 receptor antagonist-deficient mice. J Periodontal Res. 2013;48:748–756. doi: 10.1111/jre.12065. [DOI] [PubMed] [Google Scholar]
- Mulligan MK, Ponomarev I, Hitzemann RJ, Belknap JK, Tabakoff B, Harris RA, Crabbe JC, Blednov YA, Grahame NJ, Phillips TJ, Finn DA, Hoffman PL, Iyer VR, Koob GF, Bergeson SE. Toward understanding the genetics of alcohol drinking through transcriptome meta-analysis. Proc Natl Acad Sci. 2006;103:6368–6373. doi: 10.1073/pnas.0510188103. [DOI] [PMC free article] [PubMed] [Google Scholar]
- Pastor IJ, Laso FJ, Romero A, Gonzalez-Sarmiento R. Interleukin-1 gene cluster polymorphisms and alcoholism in Spanish men. Alcohol Alcohol. 2005;40:181–186. doi: 10.1093/alcalc/agh153. [DOI] [PubMed] [Google Scholar]
- Petrasek J, Bala S, Csak T, Lippai D, Kodys K, Menashy V, Barrieau M, Min SY, Kurt-Jones EA, Szabo G. IL-1 receptor antagonist ameliorates inflammasome-dependent alcoholic steatohepatitis in mice. J Clin Invest. 2012;122:3476–3489. doi: 10.1172/JCI60777. [DOI] [PMC free article] [PubMed] [Google Scholar]
- Ponomarev I, Maiya R, Harnett MT, Schafer GL, Ryabinin AE, Blednov YA, Morikawa H, Boehm SL, 2nd, Homanics GE, Berman AE, Lodowski KH, Bergeson SE, Harris RA. Transcriptional signatures of cellular plasticity in mice lacking the alpha1 subunit of GABAA receptors. J Neurosci. 2006;26:5673–5683. doi: 10.1523/JNEUROSCI.0860-06.2006. [DOI] [PMC free article] [PubMed] [Google Scholar]
- Rhodes JS, Best K, Belknap JK, Finn DA, Crabbe JC. Evaluation of a simple model of ethanol drinking to intoxication in C57BL/6J mice. Physiol Behav. 2005;84:53–63. doi: 10.1016/j.physbeh.2004.10.007. [DOI] [PubMed] [Google Scholar]
- Rosenblum K, Berman DE, Hazvi S, Lamprecht R, Dudai Y. NMDA receptor and the tyrosine phosphorylation of its 2B subunit in taste learning in the rat insular cortex. J Neurosci. 1997;17:5129–5135. doi: 10.1523/JNEUROSCI.17-13-05129.1997. [DOI] [PMC free article] [PubMed] [Google Scholar]
- Rudolph U, Crestani F, Benke D, Brunig I, Benson JA, Fritschy JM, Martin JR, Bluethmann H, Mohler H. Benzodiazepine actions mediated by specific gamma-aminobutyric acid(A) receptor subtypes. Nature. 1999;401:796–800. doi: 10.1038/44579. [DOI] [PubMed] [Google Scholar]
- Serantes R, Arnalich F, Figueroa M, Salinas M, Andres-Mateos E, Codoceo R, Renart J, Matute C, Cavada C, Cuadrado A, Montiel C. Interleukin-1beta enhances GABAA receptor cell-surface expression by a phosphatidylinositol 3-kinase/Akt pathway: relevance to sepsis-associated encephalopathy. J Biol Chem. 2006;281:14632–14643. doi: 10.1074/jbc.M512489200. [DOI] [PubMed] [Google Scholar]
- Sigel E, Steinmann ME. Structure, function, and modulation of GABA(A) receptors. J Biol Chem. 2012;287:40224–40231. doi: 10.1074/jbc.R112.386664. [DOI] [PMC free article] [PubMed] [Google Scholar]
- Sorge RE, Martin LJ, Isbester KA, Sotocinal SG, Rosen S, Tuttle AH, Wieskopf JS, Acland EL, Dokova A, Kadoura B, Leger P, Mapplebeck JC, McPhail M, Delaney A, Wigerblad G, Schumann AP, Quinn T, Frasnelli J, Svensson CI, Sternberg WF, Mogil JS. Olfactory exposure to males, including men, causes stress and related analgesia in rodents. Nat Methods. 2014;11:629–632. doi: 10.1038/nmeth.2935. [DOI] [PubMed] [Google Scholar]
- Vezzani A, Balosso S, Ravizza T. The role of cytokines in the pathophysiology of epilepsy. Brain Behav Immun. 2008;22:797–803. doi: 10.1016/j.bbi.2008.03.009. [DOI] [PubMed] [Google Scholar]
- Wang DS, Zurek AA, Lecker I, Yu J, Abramian AM, Avramescu S, Davies PA, Moss SJ, Lu WY, Orser BA. Memory deficits induced by inflammation are regulated by alpha5-subunit-containing GABAA receptors. Cell Rep. 2012;2:488–496. doi: 10.1016/j.celrep.2012.08.022. [DOI] [PMC free article] [PubMed] [Google Scholar]
- Wu Y, Lousberg EL, Moldenhauer LM, Hayball JD, Robertson SA, Coller JK, Watkins LR, Somogyi AA, Hutchinson MR. Attenuation of microglial and IL-1 signaling protects mice from acute alcohol-induced sedation and/or motor impairment. Brain Behav Immun. 2011;25(Suppl 1):S155–164. doi: 10.1016/j.bbi.2011.01.012. [DOI] [PubMed] [Google Scholar]
- Zeller A, Arras M, Jurd R, Rudolph U. Identification of a molecular target mediating the general anesthetic actions of pentobarbital. Mol Pharmacol. 2007;71:852–859. doi: 10.1124/mol.106.030049. [DOI] [PubMed] [Google Scholar]
Associated Data
This section collects any data citations, data availability statements, or supplementary materials included in this article.
Supplementary Materials
A–C. Males (n=16 per genotype). D–F. Females (n=14–17 per genotype). A, D. Ethanol consumption (g/kg/24 hours); no main effects of genotype, concentration, or genotype x concentration interaction were found for either sex. B, E. Preference for ethanol; no main effects of genotype, concentration, or genotype x concentration interaction were found for either sex. C, F. Total fluid intake (g/kg/24 hours); no main effects of genotype, concentration, or genotype x concentration interaction were found for either sex. Data were analyzed by two-way repeated measures ANOVA. EtOH=ethanol; KO=knockout; WT=wild type.
A–C. Males (n=6 for each genotype). D–F. Females (n=6–7 per genotype). A, D. Ethanol consumption (g/kg/3 hours); no main effects of genotype, concentration, or genotype x concentration interaction were found for either sex. B, E. Preference for ethanol; no main effects of genotype, concentration, or genotype x concentration interaction were found for either sex. C, F. Total fluid intake (g/kg/3 hours); no main effects of genotype, concentration, or genotype x concentration interaction were found for either sex. Data were analyzed by two-way repeated measures ANOVA. EtOH=ethanol; KO=knockout; WT= wild type.
A. Males (n=6 for each genotype). Ethanol consumption for days 1–3 (g/kg/2 hours) and day 4 (g/kg/4 hours); no differences between WT and KO mice were found for any time periods. B. Females (n=6 for each genotype). Ethanol consumption for days 1–3 (g/kg/2 hours) and day 4 (g/kg/4 hours); no differences between WT and KO mice were found for any time periods. Data were analyzed by two-way repeated measures ANOVA (days 1–3) or Student’s t-test (day 4). EtOH=ethanol; KO=knockout; WT=wild type.
A–C. Il1r KO (n=14–17) vs. WT (n=12) mice. D–F. Il1rn KO (n=11–12) vs. WT (n=10) mice. A, D. Ethanol affects the percent of time in the open arms. (F1,53 = 42, p < 0.001 for Il1r KO; F1,39 = 27, p < 0.001 for Il1rn KO). B, E. Ethanol affects the percent of entries into the open arms (F1,53 = 96, p < 0.001 for Il1r KO; F1,39 = 27, p < 0.001 for Il1rn KO). C, F. Ethanol increased the number of entries into the closed arms in Il1rn KO mice (F1,39 = 18.9, p < 0.001, effect of treatment). Data from females and males were combined because there were no gender differences. Values represent mean ± SEM. Data were analyzed by two-way ANOVA followed by Bonferroni post hoc test. *p < 0.05, ** p < 0.01, ***p < 0.001 vs. saline group (n=13–19 per group). EtOH=ethanol; KO=knockout; WT=wild type.
Supplemental Table 1. Statistical analyses of ethanol intake, preference, and total fluid intake in the two-bottle choice test in Il1r1 knockout mice.
Supplemental Table 2. Statistical analyses of ethanol intake, preference, and total fluid intake in the limited access to ethanol with free choice (two-bottle drinking in the dark) test in Il1r1 knockout mice.
Supplemental Table 3. Statistical analyses of ethanol intake in the limited access to ethanol without free choice (one-bottle drinking in the dark) test in Il1r1 knockout mice.
Supplemental Table 4. Statistical analyses of the ethanol-induced conditioned taste aversion in Il1r1 knockout mice.
Supplemental Table 5. Statistical analyses of the ethanol-induced conditioned taste aversion in Il1rn knockout mice.