Abstract
Accurate pharmacokinetic (PK) modeling of Dynamic Contrast Enhanced MRI (DCE-MRI) in prostate cancer requires knowledge of the concentration time course of the contrast agent in the feeding vasculature, the so-called arterial input function (AIF). The purpose of this study was to compare AIF choice in differentiating peripheral zone prostate cancer (PCa) from non-neoplastic prostatic tissue (NNPT), using PK analysis of high temporal resolution prostate DCE-MRI data and whole-mount pathology (WMP) validation.
This prospective study was performed in 30 patients who underwent multiparametric endorectal prostate MRI at 3.0T and WMP validation. PCa foci were annotated on WMP slides and MR images using 3D Slicer. Foci ≥0.5cm3 were contoured as tumor regions of interest (TROIs) on subtraction DCE (early-arterial - pre-contrast) images. PK analyses of TROI and NNPT data were performed using automatic AIF (aAIF) and model AIF (mAIF) methods. A paired t-test compared mean and 90th percentile (p90) PK parameters obtained with the two AIF approaches. ROC analysis determined diagnostic accuracy (DA) of PK parameters. Logistic regression determined correlation between PK parameters and histopathology.
Mean TROI and NNPT PK parameters were higher using aAIF vs. mAIF (p<0.05). There was no significant difference in DA between AIF methods: highest for p90 Ktrans (aAIF differences in the area under the ROC curve (Az) =0.827; mAIF Az=0.93). Tumor cell density correlated with aAIF Ktrans (p=0.03).
Our results indicate that DCE-MRI using both AIF methods is excellent in discriminating PCa from NNPT. If quantitative DCE-MRI is to be used as a biomarker in PCa, the same AIF method should be used consistently throughout the study.
Keywords: prostate cancer, dynamic contrast enhancement, arterial input function, pharmacokinetic analysis
1. INTRODUCTION
It has been suggested that in prostate carcinoma (PCa), a poorer prognosis is associated with a greater number of abnormal vessels [1], and microvessel density has been shown to correlate with higher Gleason score and predict disease progression [2–4]. This has prompted interest in quantitative dynamic contrast-enhanced magnetic resonance imaging (DCE-MRI) as a non-invasive tool in assessing the aggressiveness of PCa, and as an indicator of response to therapy.
Accurate pharmacokinetic (PK) modeling of DCE-MRI requires knowledge of pre-contrast tissue T1 values [5], and knowledge of the concentration time course of the contrast agent in the feeding vasculature, the so-called arterial input function (AIF). Manual estimation of AIF, based on the signal intensity changes in voxels in an adjacent major feeding vessel for each patient, yields patient specific PK parameters [6,7]. A number of approaches have been proposed for practical automatic determination of individual AIFs (aAIF) [8–10], as manual methods are time consuming and suffer from inter- and intra-observer variability [11,12]. In-flow effects and B1 inhomogeneity-induced image intensity variation also hamper individual estimation of AIF [7]. A popular alternative way of estimating AIF is to use a model-based population averaged AIF (mAIF), which assumes an a priori known AIF obtained from population studies [13,14]. At limited temporal resolution, this approach has been successfully applied in predicting prostate biopsy results [15]. One concern, however, is that mAIF may not allow for capturing AIF features from a selected patient cohort, which are specific to the acquisition parameters, organ of interest and patient characteristics.
AIF choice has been shown to have a significant influence on PK parameters obtained in simulation and in some tumor studies [9,16,17], although determination of accuracy is challenging due to difficulty in obtaining accurate pathological validation. It is unknown whether AIF choice has an impact on differentiating PCa from normal tissue, and little is known about the effect of AIF choice on PCa detection and characterization in the prostate. Such comparisons are critical prior to evaluating a role for PK parameters as a PCa biomarker.
The purpose of this study is to compare the diagnostic performance of DCE-MRI using mAIF and aAIF in differentiating peripheral zone (PZ) PCa from non-neoplastic prostatic tissue (NNPT), using an optimized high temporal resolution prostate protocol [18] and whole mount pathology (WMP) as a reference standard.
2. METHODS
Our institutional review board approved this HIPAA-compliant prospective study. Written informed consent was obtained.
2.1 Patients
From February 2010 to May 2013, 30 consecutive male patients (median age 63 years; range 45–69 years) with known PCa, who had pre-operative multiparametric MR imaging (mpMRI) at 3T and gave consent for WMP processing of their prostate were enrolled in this study. Inclusion criteria were patient ability to undergo endorectal coil prostate MR and radical prostatectomy as a treatment plan. Exclusion criteria included contraindication to MR imaging, and non-consent to WMP analysis.
2.2 MR Imaging
All MR imaging exams were performed on a GE Signa HDx 3.0T magnet (GE Healthcare, Waukesha, WI) using a combination of 8-channel abdominal array and endorectal coil (Medrad, Pittsburgh, PA). The multiparametric protocol [18] included T1- and T2-weighted imaging, diffusion weighted imaging (b=500,1400), and DCE MRI. DCE-MRI utilized a 3D SPGR sequence with TR/TE/α = 3.6 ms/1.3 ms/15°, FOV = 26×26 cm2, with full gland coverage and an interpolated voxel size of 1×1×6 mm3. Axial frames were acquired at approximately 5-second intervals to achieve a clinically appropriate compromise between spatial and temporal resolution. Gadopentetate dimeglumine (Magnevist, Berlex Laboratories, Wayne, New Jersey) was injected intravenously into an antecubital vein using a syringe pump (0.15 mmol/kg; rate 3ml/sec), followed by 20ml saline flush. The protocol included ~5 baseline scans prior to contrast injection for estimation of baseline signal intensities.
2.3 Histopathology Acquisition and Analysis
After radical prostatectomy, the intact specimens were inked for laterality and fixed in formalin overnight at room temperature. The first 26 consecutive patients were sectioned manually from apex to base at 4–5 mm intervals. In the most recent 4 patients a customized individual 3D mold was used to process the specimens [19], which were sliced at a consistent section thickness of 3 mm. In all cases, each slice was annotated by slice number, fixed and paraffin-imbedded. Subsequently, 5-micron WM tissue sections were cut, glass-mounted, and stained with hematoxylin and eosin.
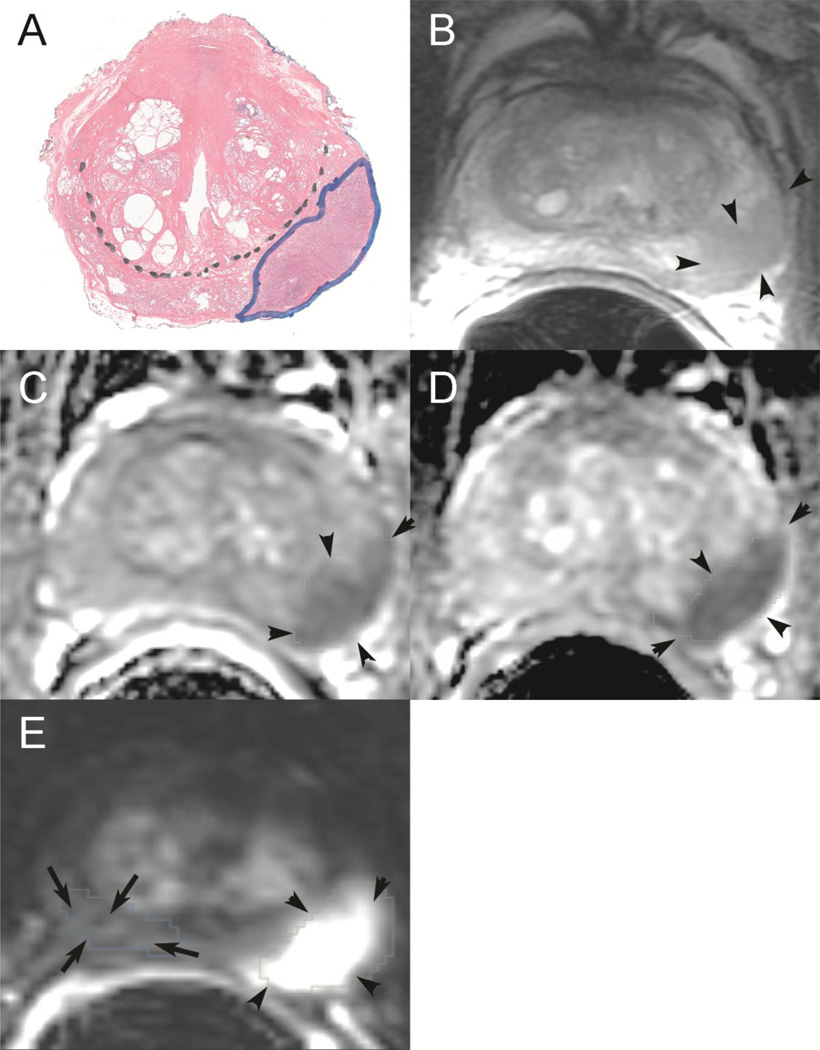
The central gland/PZ border and all areas of PCa on each WMP section were outlined on glass slides by a genitourinary pathologist with 10 years experience (Figure 1). All PCa foci were assigned a Gleason score. Percent Gleason pattern 3, 4 and 5 and average tumor cell density were documented. The annotated WMP slides were digitally scanned and loaded into 3D Slicer (http://slicer.org), an open source software for medical image visualization and analysis [20]. 3D Slicer allowed for simultaneous visualization and fusion of the different mpMRI sequences, and for manual contouring of the ROIs for tumor and normal areas. To obtain tumor volume measurements we assumed 5mm thickness for routine WMP processing, and 3mm thickness for processing using the customized mold. Volumes were then scaled by a factor of 1.15 to account for tissue shrinkage [21].
Figure 1.
Whole mount histopathologic correlation with prostate multiparametric MRI. (A): Histopathologic whole mount outlining a left peripheral zone tumor with a Gleason score 4+3=7 (outlined in blue ink). Black dotted line differentiates peripheral zone from central gland. Corresponding tumor is seen as an area of low signal intensity on the T2-weighted image (B), as an area of restricted diffusion on ADC maps derived from DWI (b0–500) (C) and (b0–1400) (D), and as an area of high signal intensity on DCE subtraction map (E). The tumor is outlined by black arrowheads on mpMRI, and comparison volume of right peripheral zone which did not contain tumor is outlined on subtraction DCE (E) by arrows.
2.4 Correlation of MR data to Histopathology
Correlation analysis was restricted to PZ PCa foci of ≥0.50 cm3 [22,23]. For patients with multiple tumors ≥0.50 cm3, an index lesion was chosen to correlate with mpMRI, defined as the largest lesion with the highest assigned Gleason score.
Digitized WMP and mpMRI images were viewed side-by-side using 3D Slicer. The corresponding ROIs were contoured manually on the digital pathology and MRI datasets separately. Using anatomical landmarks (urethra, verumontanum, calcifications or benign prostatic hyperplastic nodules) index lesions outlined on WMP slides were identified on mpMRI as foci of enhancement on subtraction DCE images, confirmed by both focal low signal intensity on T2-weighted images and restricted diffusion on ADC maps. All mpMRI sequences (T2WI, DCE, ADC (b=500,1400) were used to confirm lesion location. Images were reviewed in consensus by 2 radiologists with over 10 years and 2 years of experience respectively in interpretation of prostate MRI. Tumor regions of interest (TROIs) were then drawn on subtraction images (Figure 1). ROIs corresponding to NNPT identified on WMP slides were also contoured in the corresponding locations on subtraction DCE images. Whenever possible, NNPT was contoured on the same slice as tumor, or in the closest adjacent slice. For comparative purposes, TROIs and areas of NNPT were also contoured on ADC (b0–500) maps. Registration of DCE to ADC was not performed. Instead, corresponding ROIs were identified visually on all series of interest and contoured by the radiologist.
2.5 Image quantification
Both an aAIF and a mAIF were used for PK analysis of the TROIs and NNPT.
aAIF
The aAIF estimation method incorporated a priori knowledge of anatomy and the characteristics of a typical AIF uptake curve, as previously described [10]. This 4-step method works by: (i) excluding slices based on artifacts and selecting the best slices based on intrinsic anatomic landmarks and enhancement characteristics, (ii) identifying search regions for potential AIF voxels within selected slices, (iii) prostate anatomy specific mask refinement which excludes regions close to the endorectal coil while retaining vascular regions near the prostate, and (iv) selecting the best ranked voxels that meet enhancement characteristics and mutual correlation. The signal intensity curves of top 5 ranking voxels (or fewer if correlation metric is not met by 5 voxels) are averaged to determine the final AIF signal, which is then converted into AIF concentration curve using the SPGR sequence signal intensity equation and nominal blood T1 value (1600 msec) (ref 26).
mAIF
The mAIF method used a previously computed, fixed AIF curve, numerically constructed from published first-pass data [24] and concatenated with the Weinmann curve for late wash-out [14]. This methodology has been previously reported [25] and was chosen because our imaging and injection protocol closely match this reported study. Although our AIF is numerically constructed, we have utilized the parametric form of the population AIF from Parker et al. [13] to approximate our AIF. The equation of the functional form of the Parker AIF is as follows:
Table 1 lists the parametric values from the Parker AIF functional form, used to generate our mAIF function. These parameters were obtained by performing a non-linear least squares fitting of our numerical population averaged AIF to the above function using Levenberg-Marquardt optimization.
Table 1.
Model AIF parameters
| A1 | A2 | T1 | T2 | σ1 | σ2 | α | β | s | τ |
|---|---|---|---|---|---|---|---|---|---|
| mmol/sec | mmol/sec | sec | sec | sec | sec | mmol | /sec | /sec | sec |
| 41.53 | 56.26 | 13.48 | 21135.7 | 6.80 | 101474 | 0.94 | 0.0015 | 0.63 | 23.94 |
This table lists the set of numerical values for the parametrization of the commonly used Parker et al (11) AIF to realize the model AIF used in our work. The explanation of terms and the functional form of the Parker AIF can be found in (11).
PK analysis using both aAIF and mAIF
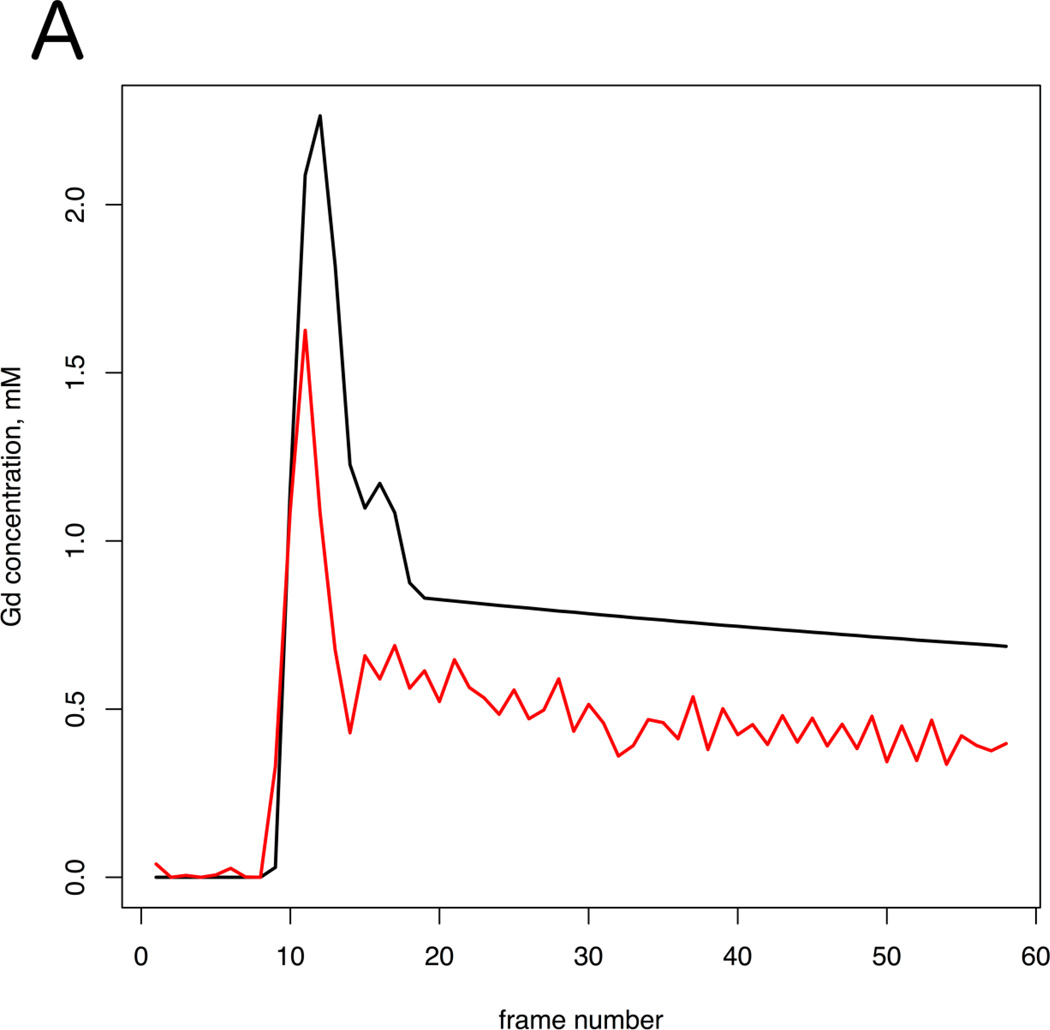
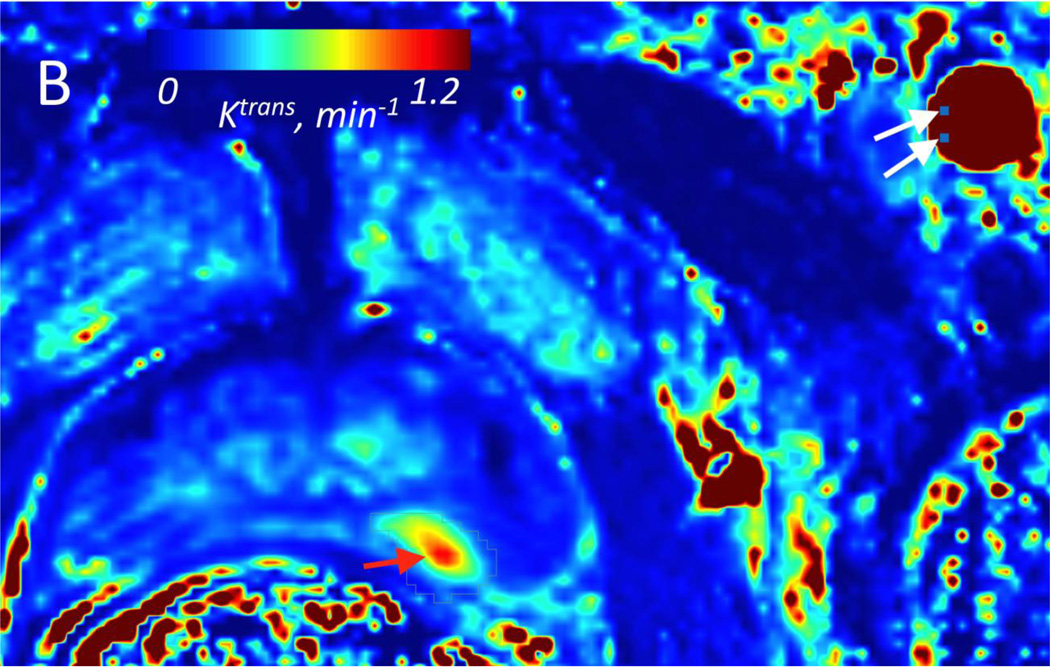
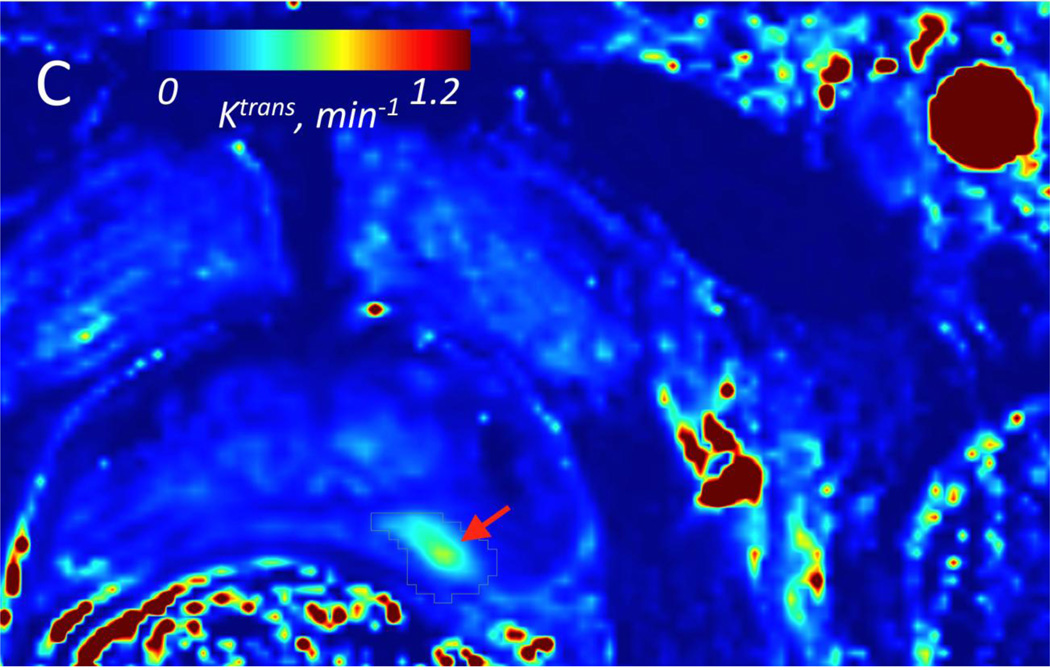
PK analyses based on the Generalized Kinetic Model [26] was performed using OncoQuant research prototype (GE Global Research, Niskayuna, NY, USA). The 2-parameter model without a plasma volume fraction term was chosen because of the limited temporal resolution of the prostate DCE-MRI data (~5 sec). All voxels within the ROIs from multi-slice dynamic time series curves were estimated using relative signal enhancement. The initial pre-contrast T1 value of the prostate was set at 1597 msec [27] and at 1600 msec for blood [28], used for signal intensity to gadolinium concentration conversion. Relaxivity value of Gd-DTPA used was 4.9 mM−1 s−1. Prior to fitting pixel-wise concentration curves to the PK model, we accounted for transit time delays by automatically estimating the bolus arrival time (onset time) for each voxel, and shifting curves to match the bolus arrival time of the AIF, to ensure there are no model fit failures due to differences in onset time. PK modeling was performed via iterative curve fitting using forward convolution. Both aAIF and mAIF methods were applied for each dataset (Figure 2), resulting in two sets of PK analysis results, each containing maps of forward volume transfer constant (Ktrans, min−1) and the fractional volume of extravascular and extracellular space per unit volume of tissue (νe). Quality of the model fits was assessed using the coefficient of determination (R2). Voxels showing poor fit of the model to the data (R2<0.75) were not included in the analysis (~3% for mAIF and <1% for aAIF).
Figure 2.
A: Two arterial input functions (Red curve =aAIF; Black curve = mAIF) from a 64 year-old patient with Gleason grade 7 in the left PZ at prostatectomy. This case exemplifies the typical difference in AIF curves seen in our PCa population. B: Volume transfer constant (Ktrans) parametric map calculated using aAIF, and (C) using mAIF, demonstrating increased Ktrans values in the left PZ. For aAIF, up to 5 pixels are selected within the AIF (from left femoral artery in this case); 2 of these pixels in one slice are shown in (B), denoted as white arrows. Red arrows correspond to tumor on Ktrans maps. Tumor Ktrans decreased when using mAIF, which had greater peak amplitude than aAIF.
2.6 Statistical Analysis
To incorporate tumor heterogeneity, in addition to the mean value we also determined the 90th percentile (p90) for Ktrans and νe within TROIs. A paired t-test compared mean and p90 Ktrans and νe values of TROI and NNPT using both AIF methods. Coefficients of variation of these PK parameters were compared between methods using Levene’s test.
To adjust for the variability in PK parameters between patients, we performed an analysis of covariance to estimate within-subject correlation between PK parameters obtained with both AIF methods [29]. Agreement between PK parameters obtained with both AIF methods was assessed using the Bland-Altman plot [30] to calculate the mean difference, standard deviation of the difference, and the 95% limits of agreement.
Logistic regression models evaluated the correlation of PK parameters with pathological descriptors of TROI: average tumor cell density, tumor volume, and percent of Gleason 3 and 4 involvement as linear predictors, and averaged TROI Ktrans and νe as model response.
To determine the accuracy of the PK parameters for diagnosis of PCa, Receiver Operating Characteristic (ROC) analysis [31] was performed using mean ROI values. The differences in the area under the ROC curve (Az) of PK parameters using aAIF and mAIF were assessed with the univariate Z-score test. Az values were also obtained to determine the diagnostic accuracy of ADC (b 0–500) maps.
Computer software packages (SPSS, version 17.0 for Windows, SPSS, Chicago, IL (USA); Medcalc, Medcalc Software, Mariakerke, Belgium; R version 3.0.1, R Foundation for Statistical Computing, Vienna, Austria) were used for the statistical analyses. P value < .05 was considered to indicate statistical significance.
3. RESULTS
3.1 Study population
The median serum PSA was 5.19 ng/dl (range, 2.20 to 25.95 ng/dl). The mean number of days between positive prostate biopsy and prostate MR was 73 days (median 42, range 1 to 687), and the mean interval between prostate MR and prostatectomy was 58 days (median 47, range 10 to 217 days).
A total of 85 TROIs were identified in 30 patients, and contoured on WMP slides. Of these, 44 had a Gleason Grade ≥7, 35 had a Gleason grade 6, and in 6 lesions (from 3 patients) no Gleason grade was reported due to prior neoadjuvant chemotherapy. A total of 14 patients were excluded from the analysis because they had TROIs below the 0.5cc tumor volume threshold (n=8), TROI in central gland only (n=3), had extensive hemorrhage on MRI limiting visualization of the tumor (n=2), or did not have all mpMRI sequences available for correlation with WMP (n=1). In the remaining 16 patients, only the index lesion was selected for inclusion in the analysis.
The mean interval between prostate MR and prostatectomy in these 16 patients was 51 days (median 38, range 10 to 217 days). The Gleason score for all 16 TROIs was 7 (i.e., derived from either Gleason 3+4, or 4+3), except for two patients: one had prior therapy and an un-assigned Gleason score and the other had a Gleason score of 6 (i.e. 3+3). As outlined in Table 2, a small number of patients also had a tertiary component of Gleason 5. The average tumor cell density of these 16 TROIs was 68.5% (median 70%, range 10–90%). The percent of each Gleason pattern is described in Table 2.
Table 2.
TROI Histopathological Characteristics
| % Gleason Grade 3 |
% Gleason Grade 4 |
% Gleason Grade 5 |
|
|---|---|---|---|
| Mean | 53.75 | 43.75 | 2.5 |
| Max % | 100 | 80 | 15 |
| Min % | 10 | 0 | 0 |
Abbreviations: TROI= Tumor Region of Interest; Max=maximum % Gleason grade within an ROI; Min= Minimum % Gleason grade within an ROI. TROI histopathological characteristics are from 16 index tumors. The Gleason score is the sum of the two most common Gleason grades seen in the prostatectomy specimen".
3.2 PK parameters of DCE-MRI
Mean Comparison
Mean and p90 PK values of the TROI, and mean PK values of NNPT using aAIF and mAIF are summarized in Table 3. Mean TROI and NNPT Ktrans and νe were higher when calculated using aAIF compared to mAIF (p<0.05, paired t-test). The p90 νe was also higher with aAIF (p<0.001). The p90 Ktrans was not different between aAIF and mAIF. In general, the coefficient of variation of Ktrans and νe values calculated using mAIF were smaller than those calculated using aAIF, although statistical significance was only reached in νe of TROI.
Table 3.
Comparison of PK parameter values obtained using aAIF and mAIF functions in prostate PZ
| NNPT | TROI | P90 | |||||||
|---|---|---|---|---|---|---|---|---|---|
| aAIF | mAIF | p-value | aAIF | mAIF | p-value | aAIF | mAIF | p-value | |
| Ktrans | |||||||||
| Mean | 0.276 | 0.191 | 0.009* | 0.464 | 0.340 | 0.027* | 0.801 | 0.606 | 0.062* |
| SD | 0.146 | 0.087 | 0.219 | 0.131 | 0.415 | 0.284 | |||
| CoV | 0.531 | 0.454 | 0.250 | 0.472 | 0.384 | 0.209 | 0.527 | 0.409 | 0.384 |
| νe | |||||||||
| Mean | 0.397 | 0.184 | <0.001* | 0.443 | 0.221 | <0.001* | 0.644 | 0.318 | <0.001* |
| SD | 0.207 | 0.059 | 0.161 | 0.043 | 0.203 | 0.074 | |||
| CoV | 0.519 | 0.321 | 0.068 | 0.364 | 0.197 | <.008 | 0.425 | 0.336 | 0.150 |
Abbreviations: NNPT=non-neoplastic prostate tissue; TROI= Tumor region of interest; p90= 90th percentile for parameter value within TROI; PZ= peripheral zone of prostate; SD = standard deviation; CoV = coefficient of variation.
P-value for comparison of mean values between aAIF and mAIF using paired t-test.
P-value for comparison of coefficient of variation between aAIF and mAIF using Levene’s test.
Bland-Altman Analysis
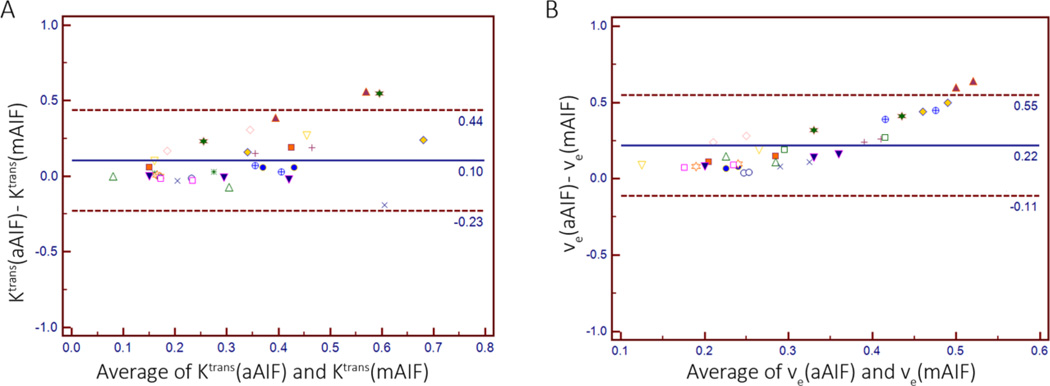
The Bland-Altman plot comparing PK values obtained using aAIF and mAIF-based analysis demonstrated a difference of 0.10 ± 0.17 [mean ± SD] and 0.22 ± 0.17, for Ktrans and νe respectively. The Bland-Altman limits of agreement, i.e. the region in which 95% of the differences in Ktrans and νe values were located, ranged from −0.23 to 0.44, and −0.11 to 0.55, respectively. Graphically represented in Figure 3, these results indicate that Ktrans and νe values obtained using aAIF methodology are generally higher than those obtained using mAIF methodology.
Figure 3.
Bland-Altman Plots comparing mean Ktrans values (A) and mean νe values (B) within the TROI and NNPT ROIs, obtained with an aAIF and mAIF setting.
(A) Mean difference between aAIF and mAIF is 0.10 and Bland-Altman 95% limits of agreement are −0.23 to 0.44.
(B) Mean difference between aAIF and mAIF is 0.22 and Bland-Altman 95% limits of agreement are −0.11 to 0.55.
Correlation Analysis
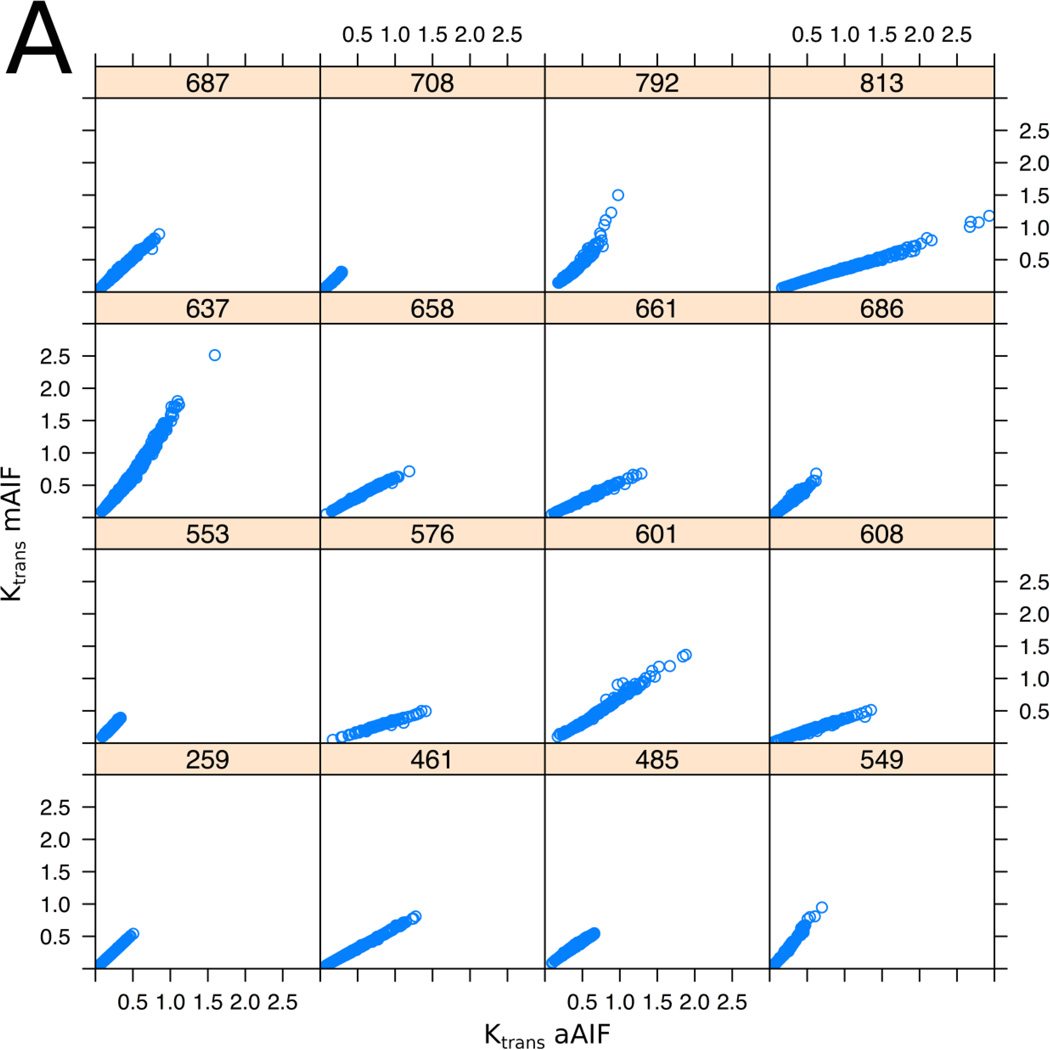
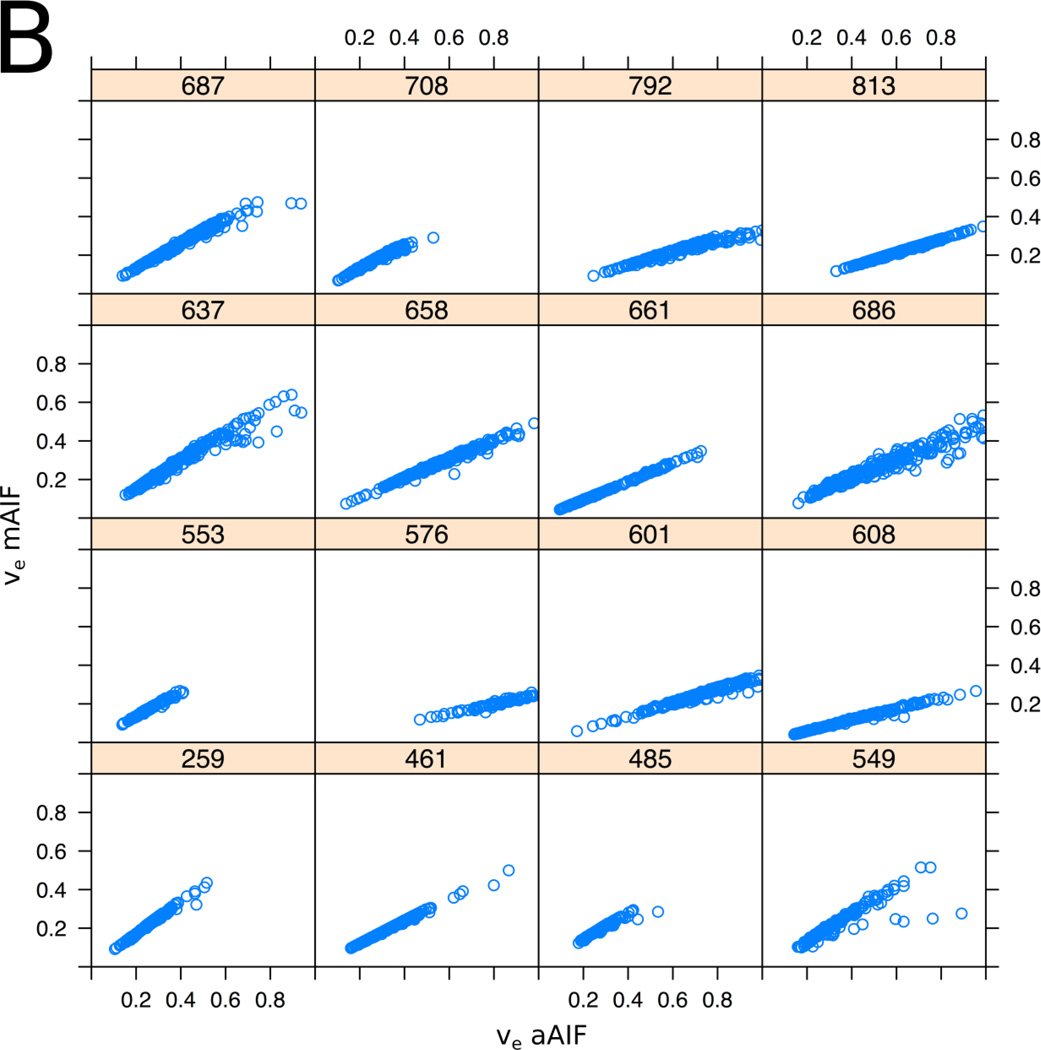
Pixel-based correlation analysis of TROI and NNPT demonstrated a very strong correlation for Ktrans and νe values between the AIF methods (within-subject correlation coefficient between methods was r = 0.91 for Ktrans, p < 0.001; r = 0.97 for νe, p < 0.001), graphically represented in Figure 4. Evaluated at the ROI level, within-subject correlation coefficients were 0.91 (p<0.001) and 0.98 (P<0.001) for Ktrans and νe respectively, using average PK values from TROIs and NNPTs.
Figure 4.
Scatter plots showing the relation between the aAIF (x-axis) and the mAIF (y-axis) derived PK parameters, Ktrans (A) and ve (B) for all 16 patients who met inclusion criteria. Each of the 16 plots represents an individual patient, the 3-digit number referring to assigned case numbers. Each plot represents voxel values from multi-slice data from the entire TROI or NNPT. The plots illustrate the observation that in general the measurement obtained using different AIF choices are related by a subject-specific scaling factor. Within-subject pixel-based correlation was 0.91 for Ktrans (p < 0.001) and 0.97 for νe (p < 0.001).
Logistic Regression Analysis
Based on a linear regression model, tumor cell density was a statistically significant predictor of aAIF Ktrans (p=0.03). Correlation of tumor cell density with mAIF Ktrans approached significance at p=0.08. Tumor volume and % Gleason patterns 3 and 4 were not statistically significant predictors of either "response variable (aAIF or mAIF Ktrans)".
3.3 Diagnostic Accuracy of PK parameters
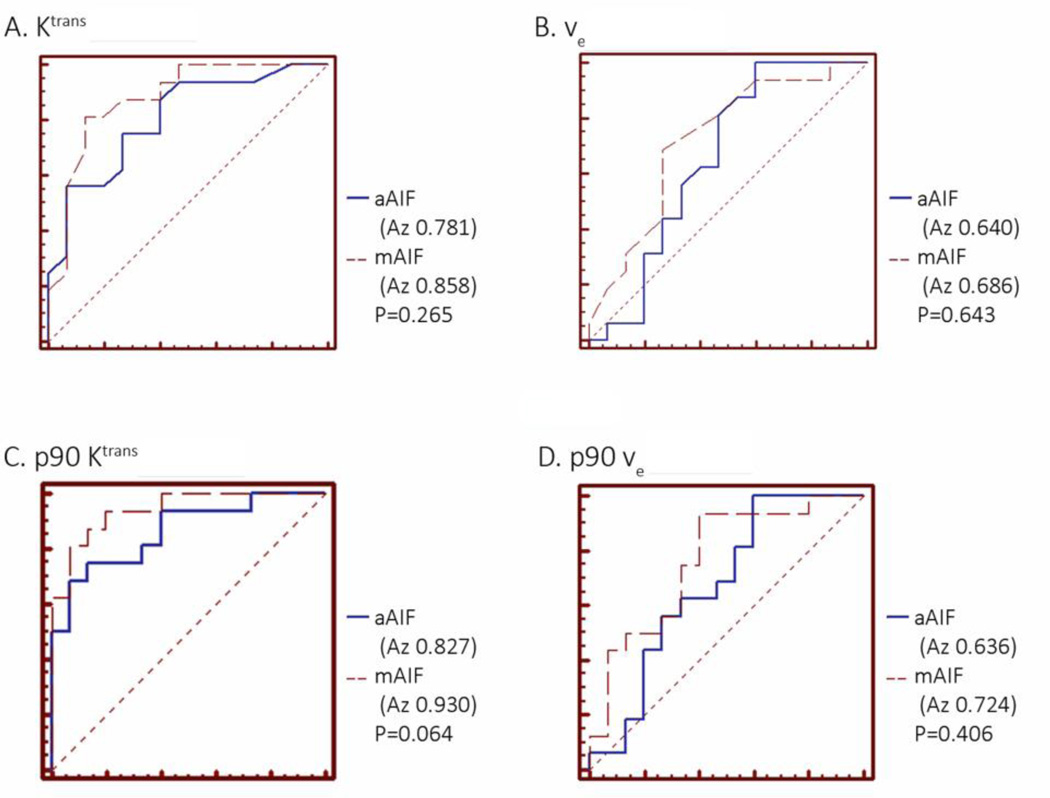
Using ROC analysis, there was no significant difference between AIF methods in diagnostic accuracy for differentiating TROI from NNPT using mean or p90 Ktrans and νe (Figure 5). The diagnostic accuracy was highest when using p90 of Ktrans (Az values, 0.827 for aAIF method and 0.930 for mAIF analysis, respectively), followed by mean Ktrans value (Az values, 0.781 for aAIF and 0.858 for mAIF methods, respectively).
Figure 5.
Receiver Operating Characteristic (ROC) curves illustrating performance of mean and p90 PK parameters calculated from the ROIs in separating tumor from normal tissue, for the two choices of the AIF: (A) mean Ktrans; (B) mean νe; (C) p90 Ktrans; (D) p90 νe. In all cases, no significant difference between the two AIF methods was observed in the cancer discriminating ability of the individual measures.
4. DISCUSSION
DCE-MRI detection of true change in tumor perfusion, as measured by PK indices, requires accurate and reproducible methodology before it can be proposed as a reliable biomarker. This study compared the diagnostic performance of two AIF options, mAIF and aAIF, for PK analysis of PCa, using WMP correlation. We found that PK analyses with either AIF method proved excellent tools to discriminate PCA from NNPT in prostate PZ. However, the PK values obtained differ significantly between the 2 methodologies, indicating that the choice of AIF should always be the same when assessing interval change in serial studies. The diagnostic accuracy was highest when the p90 of PK values were evaluated, although the difference in Az values obtained between mAIF and aAIF were not significant.
The Az values from ROC analyses are higher than previously reported [15], with the highest value of 0.93 for p90 Ktrans using the model AIF. There are several potential explanations for this. Firstly, we used a higher temporal resolution DCE-MRI study compared to others [15]. This should allow for more accurate capturing of fast-changing dynamics and more accurate AIF measurement in data driven AIF methods, although this is speculative and cannot be proven in our study. Secondly, we used digitized WMP from radical prostatectomy specimens for direct imaging correlation, whereas others [15] correlated findings with prostate biopsy results. Thirdly, we limited our study to tumors ≥0.50 cm3 in PZ to perform a comparison of DCE-MRI results in significant volume PZ tumors. With the exception of one, all tumors ≥0.50 cm3 also had a Gleason score of ≥7 or higher, and therefore were a more homogenous population of intermediate-high grade PCa patients compared to the biopsy population [15].
Diagnostic accuracy of ADC (b 0–500) was 0.988.This is not surprising considering that selection of TROI and areas of NNPT on ADC maps was based on the suspicious appearance on ADC, and confirmed on WMP. Direct comparison of diagnostic accuracy of ADC and PK indices obtained using both AIF methods is outside the scope of this study, as the radiologists were blinded to PK maps but not to ADC maps when drawing ROIs.
Our results demonstrate that mean Ktrans and νe values obtained in TROI and NNPT were significantly higher when an aAIF method was used, consistent with known simulations which have demonstrated the effect of AIF shape on DCE-MRI parameters [32]. Using p90, νe values were also significantly higher with aAIF. While no significant difference was found with Ktrans, possibly due to absolute high values of Ktrans being compared using p90, it should be noted that the difference between the two AIF methods was approaching significance at p=0.062. The overall higher PK values obtained with aAIF may be explained by the fact that scaling of the mAIF is not specific for the PCa population being evaluated, and results obtained from mAIF analyses do not relate to results from data-driven AIF analysis in absolute terms. The aAIF scale, however, is specific to individual enhancement characteristics and is scaled explicitly by the data. Furthermore, there is known to be considerable variability in the magnitude of the AIF peak across patients when individualized analysis is used [33]. We could speculate that these differences could be due to the patient-specific conditions such as cardiac output, or due to the imaging-specific issues related to orientation of the artery at the location of AIF ROI relative to the scan plane, flow artifacts, partial volume effects or motion.
The absolute values of the PK parameters in the TROI and NNPT are both similar [34] and dissimilar [35] to those reported elsewhere. This is consistent with quantitative PK studies of uterine fibroids [36] and breast cancer [37] that demonstrated absolute values to differ, depending on the details of the PK analysis applied to the data, even when performed in the same cohort of patients. However, assuming the absolute value of quantitative metrics is an essential component to MR evaluation of response to therapy in a single-institution, single-analysis platform study, our results suggest that aAIF may be a preferable option. This is supported by our finding that average tumor cell density was found to be a significant predictor of Ktrans in TROI, as previously demonstrated [38], but only for the aAIF option. However, further studies are warranted to determine the optimal AIF method in treatment response evaluation. The percentages of Gleason pattern 3 or 4 were not predictors of PK values, possibly due to the fact that this is a relatively homogenous clinical cohort, unlike other studies where less and highly aggressive tumors were compared [39].
Considering that PK analysis using mAIF and aAIF resulted in significantly different Ktrans and νe values, it is of interest that within individual subjects, the correlation was very high. While the aAIF method used provides an AIF that is specific for each patient based upon enhancing areas within the image, the mAIF used in this study includes a first-pass component to improve the quality and reproducibility of kinetic model fitting [40]. The high within-subject correlation that we found underscores that differences in PK values likely reflect differences in AIF scaling of the peak amplitude between aAIF and mAIF.
We found high AUC Az values for mean and p90 Ktrans, and to a lesser extent for νe. While Ktrans is established as being elevated in tumors [15,34,35,39,41], this cannot be said for νe. Physiologically, one may expect the extravascular extracellular space to have an inverse relationship with cell density, although this has been difficult to prove in other tumors [42,43], underscoring the fact that conceptual understanding of νe is somewhat incomplete.
An important issue to consider in AIF choice is that aAIF detection methods can suffer from errors due to vessel motion, or difficulties in finding the a priori feeding vessel, and in-flow effects. In our study, we did not observe any obvious failures of the aAIF detection algorithm.
Our study has potential limitations. We elected to measure only 2 PK parameters (Ktrans and νe) to assess the diagnostic performance of the two AIF choices in differentiating TROI from NNPT. As it has been demonstrated that Ktrans is one of the most variable parameters amongst all of the semi-quantitative and quantitative PK parameters for a variety of tumors [44], we feel this choice to be justified. It is also of interest that we found the same conclusions with νe analysis as found with Ktrans. Another potential limitation is that we did not include a comparison with true individual AIFs. While this would provide a gold standard, it does however require measurement of the plasma contrast agent concentration, and is not practical in the clinical setting of DCE MRI acquisition. We believe that automatic determination of an image derived AIF on a patient-specific basis is a more practical way to evaluate individual enhancement characteristics. Another limitation of this study is the final number of evaluable patients, as we limited our study to significant volume PZ tumors without hemorrhagic artifacts.
5. CONCLUSION
In conclusion, AIF choice in DCE-MRI significantly affects PK parameters obtained in a cohort of men with PZ intermediate- to high-grade PCa, although both mAIF and aAIF methods evaluated perform extremely well in differentiating PZ PCa from NNPT. PK analyses that use aAIF provide Ktrans values that correlate with tumor cell density, and higher and more variable PK values in general, compared to those obtained using an mAIF method. If quantitative DCE-MRI is to be used as a biomarker in PCa, the same AIF method should be used consistently throughout the study.
Acknowledgements
The authors would like to thank Louise Greenberg, M.Ed. and Sebastian Valentin.
Funding Acknowledgements: U01CA151261, P41EB015898, R01CA111288
Footnotes
Publisher's Disclaimer: This is a PDF file of an unedited manuscript that has been accepted for publication. As a service to our customers we are providing this early version of the manuscript. The manuscript will undergo copyediting, typesetting, and review of the resulting proof before it is published in its final citable form. Please note that during the production process errors may be discovered which could affect the content, and all legal disclaimers that apply to the journal pertain.
References
- 1.Brawer MK, Deering RE, Brown M, Preston SD, Ph D, Bigler SA. Predictors of Pathologic Stage in Prostatic Carcinoma The Role of Neovascularity. Cancer. 1994;73:678–687. doi: 10.1002/1097-0142(19940201)73:3<678::aid-cncr2820730329>3.0.co;2-6. [DOI] [PubMed] [Google Scholar]
- 2.Gettman MT, Pacelli A, Slezak J, Bergstralh EJ, Blute M, Zincke H, Bostwick DG. Role of microvessel density in predicting recurrence in pathologic Stage T3 prostatic adenocarcinoma. Urology. 1999 Sep;54(3):479–485. doi: 10.1016/s0090-4295(99)00202-2. [DOI] [PubMed] [Google Scholar]
- 3.Weidner N, Carroll PR, Flax J, Blumenfeld W, Folkman J. Tumor angiogenesis correlates with metastasis in invasive prostate carcinoma. The American journal of pathology. 1993 Aug;143(2):401–409. [PMC free article] [PubMed] [Google Scholar]
- 4.Mucci La, Powolny A, Giovannucci E, Liao Z, Kenfield Sa, Shen R, Stampfer MJ, Clinton SK. Prospective study of prostate tumor angiogenesis and cancer-specific mortality in the health professionals follow-up study. Journal of clinical oncology : official journal of the American Society of Clinical Oncology. 2009 Nov;27(33):5627–5633. doi: 10.1200/JCO.2008.20.8876. [DOI] [PMC free article] [PubMed] [Google Scholar]
- 5.Fennessy FM, Fedorov A, Gupta SN, Schmidt EJ, Tempany CM, Mulkern RV. Practical considerations in T1 mapping of prostate for dynamic contrast enhancement pharmacokinetic analyses. Magn Reson Imaging. 2012 Nov;30(9):1224–1233. doi: 10.1016/j.mri.2012.06.011. [DOI] [PMC free article] [PubMed] [Google Scholar]
- 6.Ahearn TS, Staff RT, Redpath TW, Semple SIK. The effects of renal variation upon measurements of perfusion and leakage volume in breast tumours. Physics in Medicine and Biology. 2004 May 21;49(10):2041–2051. doi: 10.1088/0031-9155/49/10/014. [DOI] [PubMed] [Google Scholar]
- 7.Ashton E, Raunig D, Ng C, Kelcz F, McShane T, Evelhoch J. Scan-rescan variability in perfusion assessment of tumors in MRI using both model and data-derived arterial input functions. Journal of magnetic resonance imaging : JMRI. 2008 Sep;28(3):791–796. doi: 10.1002/jmri.21472. [DOI] [PubMed] [Google Scholar]
- 8.Chen J, Yao J, Thomasson D. Automatic determination of arterial input function for dynamic contrast enhanced MRI in tumor assessment. Medical image computing and computer-assisted intervention : MICCAI … International Conference on Medical Image Computing and Computer- Assisted Intervention. 2008 Jan;11(Pt 1):594–601. doi: 10.1007/978-3-540-85988-8_71. [DOI] [PMC free article] [PubMed] [Google Scholar]
- 9.Li X, Welch EB, Arlinghaus LR, Chakravarthy aB, Xu L, Farley J, Loveless ME, Mayer Ia, Kelley MC, Meszoely IM, et al. A novel AIF tracking method and comparison of DCE-MRI parameters using individual and population-based AIFs in human breast cancer. Physics in medicine and biology. 2011 Sep 7;56(17):5753–5769. doi: 10.1088/0031-9155/56/17/018. [DOI] [PMC free article] [PubMed] [Google Scholar]
- 10.Shanbhag D, Gupta SN, Rajamani K, Zhu Y, Mullick R. A generalized methodology for detection of vascular input function with dynamic contrast enhanced perfusion data. ISMRM’12. 2012;10:13004. [Google Scholar]
- 11.Murase K, Kikuchi K, Miki H, Shimizu T, Ikezoe J. Determination of arterial input function using fuzzy clustering for quantification of cerebral blood flow with dynamic susceptibility contrast-enhanced MR imaging. Journal of magnetic resonance imaging : JMRI. 2001 May;13(5):797–806. doi: 10.1002/jmri.1111. [DOI] [PubMed] [Google Scholar]
- 12.Rijpkema M, Kaanders JH, Joosten FB, van der Kogel AJ, Heerschap A. Method for quantitative mapping of dynamic MRI contrast agent uptake in human tumors. Journal of magnetic resonance imaging : JMRI. 2001 Oct;14(4):457–463. doi: 10.1002/jmri.1207. [DOI] [PubMed] [Google Scholar]
- 13.Parker GJM, Roberts C, Macdonald A, Buonaccorsi GA, Cheung S, Buckley DL, Jackson A, Watson Y, Davies K, Jayson GC. Experimentally-derived functional form for a population-averaged high-temporal-resolution arterial input function for dynamic contrast-enhanced MRI. Magnetic resonance in medicine : official journal of the Society of Magnetic Resonance in Medicine / Society of Magnetic Resonance in Medicine. 2006 Nov;56(5):993–1000. doi: 10.1002/mrm.21066. [DOI] [PubMed] [Google Scholar]
- 14.Weinmann HJ, Laniado M, Mützel W. Pharmacokinetics of GdDTPA/dimeglumine after intravenous injection into healthy volunteers. Physiological chemistry and physics and medical NMR. 1984 Jan;16(2):167–172. [PubMed] [Google Scholar]
- 15.Meng R, Chang SD, Jones EC, Goldenberg SL, Kozlowski P. Comparison between population average and experimentally measured arterial input function in predicting biopsy results in prostate cancer. Academic radiology. 2010 Apr;17(4):520–525. doi: 10.1016/j.acra.2009.11.006. [DOI] [PMC free article] [PubMed] [Google Scholar]
- 16.Cheng H-LM. Investigation and optimization of parameter accuracy in dynamic contrast-enhanced MRI. Journal of magnetic resonance imaging : JMRI. 2008 Sep;28(3):736–743. doi: 10.1002/jmri.21489. [DOI] [PubMed] [Google Scholar]
- 17.Hylton N. Dynamic contrast-enhanced magnetic resonance imaging as an imaging biomarker. Journal of clinical oncology : official journal of the American Society of Clinical Oncology. 2006 Jul 10;24(20):3293–3298. doi: 10.1200/JCO.2006.06.8080. [DOI] [PubMed] [Google Scholar]
- 18.Hegde JV, Mulkern RV, Panych LP, Fennessy FM, Fedorov A, Maier SE, Tempany CMC. Multiparametric MRI of prostate cancer: An update on state-of-the-art techniques and their performance in detecting and localizing prostate cancer. Journal of magnetic resonance imaging : JMRI. 2013 May;37(5):1035–1054. doi: 10.1002/jmri.23860. [DOI] [PMC free article] [PubMed] [Google Scholar]
- 19.Trivedi H, Turkbey B, Rastinehad AR, Benjamin CJ, Bernardo M, Pohida T, Shah V, Merino MJ, Wood BJ, Linehan WM, et al. Use of patient-specific MRI-based prostate mold for validation of multiparametric MRI in localization of prostate cancer. Urology. 2012 Jan;79(1):233–239. doi: 10.1016/j.urology.2011.10.002. [DOI] [PMC free article] [PubMed] [Google Scholar]
- 20.Fedorov A, Beichel R, Kalpathy-Cramer J, Finet J, Fillion-Robin J-CC, Pujol S, Bauer C, Jennings D, Fennessy F, Sonka M, et al. 3D Slicer as an image computing platform for the Quantitative Imaging Network. Magnetic resonance imaging. 2012 Jul 6;30(9):1323–1341. doi: 10.1016/j.mri.2012.05.001. [DOI] [PMC free article] [PubMed] [Google Scholar]
- 21.Jonmarker S, Valdman A, Lindberg A, Hellström M, Egevad L. Tissue shrinkage after fixation with formalin injection of prostatectomy specimens. Virchows Archiv : an international journal of pathology. 2006 Sep;449(3):297–301. doi: 10.1007/s00428-006-0259-5. [DOI] [PubMed] [Google Scholar]
- 22.Wolters T, Roobol MJ, van Leeuwen PJ, van den Bergh RCN, Hoedemaeker RF, van Leenders GJLH, Schröder FH, van der Kwast TH. A critical analysis of the tumor volume threshold for clinically insignificant prostate cancer using a data set of a randomized screening trial. The Journal of urology. 2011 Jan;185(1):121–125. doi: 10.1016/j.juro.2010.08.082. [DOI] [PubMed] [Google Scholar]
- 23.Stamey TA, Freiha FS, McNeal JE, Redwine EA, Whittemore AS, Schmid HP. Localized prostate cancer. Relationship of tumor volume to clinical significance for treatment of prostate cancer. Cancer. 1993 Feb 1;71(3 Suppl):933–938. doi: 10.1002/1097-0142(19930201)71:3+<933::aid-cncr2820711408>3.0.co;2-l. [DOI] [PubMed] [Google Scholar]
- 24.Fritz-Hansen T, Rostrup E, Larsson HB, Søndergaard L, Ring P, Henriksen O. Measurement of the arterial concentration of Gd-DTPA using MRI: a step toward quantitative perfusion imaging. Magnetic resonance in medicine : official journal of the Society of Magnetic Resonance in Medicine / Society of Magnetic Resonance in Medicine. 1996 Aug;36(2):225–231. doi: 10.1002/mrm.1910360209. [DOI] [PubMed] [Google Scholar]
- 25.Priest AN, Gill AB, Kataoka M, McLean Ma, Joubert I, Graves MJ, Griffiths JR, Crawford RaF, Earl H, Brenton JD, et al. Dynamic contrast-enhanced MRI in ovarian cancer: Initial experience at 3 tesla in primary and metastatic disease. Magnetic resonance in medicine : official journal of the Society of Magnetic Resonance in Medicine / Society of Magnetic Resonance in Medicine. 2010 Apr;63(4):1044–1049. doi: 10.1002/mrm.22291. [DOI] [PubMed] [Google Scholar]
- 26.Tofts PS, Brix G, Buckley DL, Evelhoch JL, Henderson E, Knopp MV, Larsson HBW, Lee T, Mayr NA, Parker GJM, et al. Estimating kinetic parameters from Contrast-Enhanced T 1 - Weighted MRI of a Diffusable Tracer : Standardized Quantities and Symbols. J Magn Reson Imaging. 1999;10(3):223–232. doi: 10.1002/(sici)1522-2586(199909)10:3<223::aid-jmri2>3.0.co;2-s. [DOI] [PubMed] [Google Scholar]
- 27.De Bazelaire CMJ, Duhamel GD, Rofsky NM, Alsop DC. MR imaging relaxation times of abdominal and pelvic tissues measured in vivo at 3.0 T: preliminary results. Radiology. 2004 Mar;230(3):652–659. doi: 10.1148/radiol.2303021331. [DOI] [PubMed] [Google Scholar]
- 28.Carr JC, Carroll TJ, editors. Magnetic Resonance Angiography. New York, NY: Springer New York; 2012. [Google Scholar]
- 29.Bland JM, Altman DG. Statistics Notes Calculating correlation coefficients with repeated observations : Part 1-correlation within subjects. 1995 Feb;310:1995. doi: 10.1136/bmj.310.6980.633. [DOI] [PMC free article] [PubMed] [Google Scholar]
- 30.Bland JM, Altman D. Statistical methods for assessing agreement between two methods of clinical measurement. The lancet. 1986;327(8476):307–310. [PubMed] [Google Scholar]
- 31.Hanley J, Mcneil B. The meaning and use of the area under a receiver operating characteristic (ROC) curve. Radiology. 1982;143(1):29–36. doi: 10.1148/radiology.143.1.7063747. [DOI] [PubMed] [Google Scholar]
- 32.Koh TS, Shi W, Thng CH, Kwek JW, Bisdas S, Khoo JBK. Interpretation and applicability of empirical tissue enhancement metrics in dynamic contrast-enhanced MRI based on a multiple pathway model. Physics in medicine and biology. 2012 Aug;57(15):N279–N294. doi: 10.1088/0031-9155/57/15/N279. [DOI] [PubMed] [Google Scholar]
- 33.Fedorov A, Fluckiger J, Ayers GD, Li X, Gupta SN, Tempany C, Mulkern R, Yankeelov TE, Fennessy FM. A comparison of two methods for estimating DCE-MRI parameters via individual and cohort based AIFs in prostate cancer: A step towards practical implementation. Magnetic resonance imaging. 2014 May;32(4):321–329. doi: 10.1016/j.mri.2014.01.004. [DOI] [PMC free article] [PubMed] [Google Scholar]
- 34.Ocak I, Bernardo M, Metzger G, Barrett T, Pinto P, Albert PS, Choyke PL. Dynamic contrast-enhanced MRI of prostate cancer at 3 T: a study of pharmacokinetic parameters. AJR. American journal of roentgenology. 2007 Oct;189(4):849. doi: 10.2214/AJR.06.1329. [DOI] [PubMed] [Google Scholar]
- 35.Kozlowski P, Chang SD, Jones EC, Berean KW, Chen H, Goldenberg SL. Combined diffusion-weighted and dynamic contrast-enhanced MRI for prostate cancer diagnosis-- correlation with biopsy and histopathology. Journal of magnetic resonance imaging : JMRI. 2006 Jul;24(1):108–113. doi: 10.1002/jmri.20626. [DOI] [PubMed] [Google Scholar]
- 36.Heye T, Davenport MS, Horvath JJ, Feuerlein S, Breault SR, Bashir MR, Merkle EM, Boll DT. Reproducibility of dynamic contrast-enhanced MR imaging. Part I. Perfusion characteristics in the female pelvis by using multiple computer-aided diagnosis perfusion analysis solutions. Radiology. 2013 Mar;266(3):801–811. doi: 10.1148/radiol.12120278. [DOI] [PubMed] [Google Scholar]
- 37.Huang W, Li X, Chen Y, Li X, Chang M-C, Oborski MJ, Malyarenko DI, Muzi M, Jajamovich GH, Fedorov A, et al. Variations of dynamic contrast-enhanced magnetic resonance imaging in evaluation of breast cancer therapy response: a multicenter data analysis challenge. Translational oncology. 2014 Feb;7(1):153–166. doi: 10.1593/tlo.13838. [DOI] [PMC free article] [PubMed] [Google Scholar]
- 38.Langer DL, van der Kwast TH, Evans AJ, Plotkin A, Trachtenberg J, Wilson BC, Haider MA. Prostate tissue composition and MR measurements: investigating the relationships between ADC, T2, K(trans), v(e), and corresponding histologic features. Radiology. 2010 May;255(2):485–494. doi: 10.1148/radiol.10091343. [DOI] [PubMed] [Google Scholar]
- 39.Vos EK, Litjens GJS, Kobus T, Hambrock T, Kaa CaHDe, Barentsz JO, Huisman HJ, Scheenen TWJ. Assessment of Prostate Cancer Aggressiveness Using Dynamic Contrast-enhanced Magnetic Resonance Imaging at 3 T. European urology. 2013 Sep;64(3):448–455. doi: 10.1016/j.eururo.2013.05.045. [DOI] [PubMed] [Google Scholar]
- 40.Tunariu N, Taylor J, Stirling J, d’Arcy J, Collins DJ, Walker-Samuel S PAC. Comparing the effects of different pooled arterial input functions on DCE-MRI measurement error analysis across ana- tomical locations. Proceedings of the 16th Annual Meeting of ISMRM. 2008:2782. [Google Scholar]
- 41.Verma S, Rajesh A, Morales H, Lemen L, Bills G, Delworth M, Gaitonde K, Ying J, Samartunga R, Lamba M. Assessment of aggressiveness of prostate cancer: correlation of apparent diffusion coefficient with histologic grade after radical prostatectomy. AJR. American journal of roentgenology. 2011 Feb;196(2):374–381. doi: 10.2214/AJR.10.4441. [DOI] [PubMed] [Google Scholar]
- 42.Mills SJ, Soh C, Rose CJ, Cheung S, Zhao S, Parker GJM, Jackson a. Candidate biomarkers of extravascular extracellular space: a direct comparison of apparent diffusion coefficient and dynamic contrast-enhanced MR imaging--derived measurement of the volume of the extravascular extracellular space in glioblastoma multiform. AJNR. American journal of neuroradiology. 2010 Mar;31(3):549–553. doi: 10.3174/ajnr.A1844. [DOI] [PMC free article] [PubMed] [Google Scholar]
- 43.Yankeelov TE, Lepage M, Chakravarthy A, Broome EE, Niermann KJ, Kelley MC, Meszoely I, Mayer Ia, Herman CR, McManus K, et al. Integration of quantitative DCE-MRI and ADC mapping to monitor treatment response in human breast cancer: initial results. Magnetic resonance imaging. 2007 Jan;25(1):1–13. doi: 10.1016/j.mri.2006.09.006. [DOI] [PMC free article] [PubMed] [Google Scholar]
- 44.Galbraith SM, Lodge MA, Taylor NJ, Rustin GJS, Bentzen S, Stirling JJ, Padhani AR. Reproducibility of dynamic contrast-enhanced MRI in human muscle and tumours: comparison of quantitative and semi-quantitative analysis. NMR in biomedicine. 2002 Apr;15(2):132–142. doi: 10.1002/nbm.731. [DOI] [PubMed] [Google Scholar]


