

Abstract
Most animals produced by somatic cell nuclear transfer (SCNT) are heteroplasmic for mitochondrial DNA (mtDNA). Oxidative phosphorylation (OXPHOS) in clones therefore requires the coordinated expression of genes encoded by the nuclear DNA and the two sources of mitochondria. Such interaction is rarely studied because most clones are generated using slaughterhouse oocytes of unrecorded origin. Here we traced the maternal lineages of seven diseased and five one-month-old live cloned piglets by sequencing their mtDNA. Additionally by using a 13K oligonucleotide microarray, we compared the expression profiles of nuclear and mtDNA-encoded genes that are involved in mitochondrial functions and regulation between the cloned groups and their age-matched controls (n=5 per group). We found that the oocytes used to generate the cloned piglets were of either the Large White or Duroc background, and oocyte genetic background was not related to the clones’ survival. Expression profiles of mtDNA-encoded genes in clones and controls showed intermixed clustering patterns without treatment or maternal lineage-dependency. In contrast, clones and controls clustered separately for their global and nuclear DNA-encoded mitochondrial genes in the lungs for both the deceased and live groups. Functional annotation of differentially expressed genes encoded by both nuclear and mtDNA revealed abnormal gene expression in the mitochondrial OXPHOS pathway in deceased clones. Among the nine differentially expressed genes of the OXPHOS pathway, seven were down-regulated in deceased clones compared to controls, suggesting deficiencies in mitochondrial functions. Together, these data demonstrate that the coordination of expression of mitochondrial genes encoded by nuclear and mtDNA is disrupted in the lung of diseased clones.
Introduction
Since the first report of cloning success in mammals by SCNT [1], mammalian oocytes have been recognized as possessing all the necessary components for complete reprogramming [2]. The number of healthy births, however, is still low and most cloned animals suffer from a variety of abnormal phenotypes [1, 3, 4]. Nevertheless, SCNT is still more efficient in reprogramming capacity than the induced pluripotent stem cell technology, which reprograms in the range of 0.1%.
In the last decade, efforts have been made to compare cloned animals to those of conventional breeding in order to further improve cloning efficiency [5–7]. A major area of difference lies in mitochondria which are important in ATP generation and in programmed cell death [8]. Conventionally bred animals are homoplasmic for the maternal mitochondria, while most SCNT animals are heteroplasmic, containing mitochondria from both the recipient oocytes and the somatic donor cells [9–12].
The mitochondrial genome is composed of 37 genes encoding 13 subunits of the respiratory enzyme complexes in the OXPHOS pathway as well as 22 tRNAs and two rRNAs. The majority of the elements in the OXPHOS pathway as well as other proteins involved in mitochondrial regulation and biogenesis (approximately 1,500 proteins) is encoded by nuclear DNA [13, 14]. Therefore, the coordinated expression of the nuclear and mtDNA and the interaction of the protein products are critical in maintaining normal mitochondrial and host cell functions. Mitochondrial dysfunction also feeds back to the host cell by altering expression of numerous nuclear DNA-encoded genes to readjust its metabolic profile. For example, in yeast, retrograde response from mitochondria to the nucleus influences many cellular activities under both normal and pathophysiological conditions [15]. Likewise, mitochondrial OXPHOS is defective in cytoplasmic hybrids containing rat mtDNA in mouse cells due to impairment of coordinated assembly of nuclear- and mtDNA-encoded OXPHOS subunits [16]. In addition, mutations in mtDNA can induce genomic instability as well as tumorigenesis [17].
Oocytes used in cloning farm animals are usually obtained from slaughterhouses [18], and thus animals cloned from the same donor cell line may not be entirely identical due to the different mtDNA. Heteroplasmy may interfere with the development of the cloned embryos and thus cloning outcome due to improper interaction of the donor nuclear DNA and recipient oocyte’s mitochondria in both intra- and, more likely, inter-species nuclear transfer. Several indirect lines of evidence support such a possibility. For example, reconstructed cytoplasmic hybrid embryos from Bos Taurus (Brown Swiss) granulosa cells and oocytes that contained B. taurus A (Simmental), B. taurus B (Simmental), or Bos indicus (Dwarf Zebu) cytoplasm have different developmental potentials in bovine [19]. Additionally, inter-subspecies SCNT using cytoplasts from oocytes of crossbred goats (Saanen male symbol x Boer female symbol descendant) improves embryo-fetal development than cytoplasts from Saanen oocytes [20]. Furthermore, higher efficiencies were observed in homoplasmic cloning in both cattle and sheep [21, 22]. However, whether mtDNA-encoded genes are coordinately expressed with those encoded by the nucleus has not been studied in clones.
In this study, we used DNA sequencing to identify the maternal lineages of oocytes in cloned pigs and subsequently analyzed the expression profiles of global, nuclear DNA- and mtDNA-encoded genes involved in OXPHOS in deceased and live cloned pigs. We found that expression profiles of mtDNA-encoded genes of clones and controls clustered independently from treatment or maternal lineage. Clones and controls clustered separately for their global and nuclear DNA-encoded mitochondrial genes in the lungs for both deceased and live groups. Functional annotation analyses of differentially expressed genes encoded by the nuclear DNA and mtDNA genes revealed defects in the mitochondrial OXPHOS pathway in deceased clones.
Materials and Methods
RNA and DNA isolation
All animal experimentation was conducted at the University of Missouri. All procedures were approved by the University of Missouri Institutional Animal Care and Use Committee. Veterinary staff was consulted on a daily basis regarding the health and care of the cloned piglets, humane sacrifice, and tissue collection.
Frozen lung tissues of cloned piglets by SCNT and of age-matched controls by conventional breeding were provided by Dr. Randall Prather of the University of Missouri-Columbia [4, 23]. Seven clones that died shortly after birth were designated as the “deceased” group, and five one-month old clones as the “live” group. Each cloned group was age-matched with five controls from conventional reproduction. Total RNA was isolated using TRIzol (Invitrogen, Carlsbad, CA) and treated with DNase I (Invitrogen) to remove any possible genomic DNA contamination. Isolated RNA was stored at -80°C until utilization. Total DNA was isolated by back extraction using back extraction buffer (4 M guanidine thiocyanate, 50 mM sodium citrate, 1M Tris-base) from the inter- and organic phases of TRIzol extraction, followed by RNase A (Invitrogen) treatment to remove any possible contamination of RNA. Isolated DNA was stored at -20°C until further analysis.
Mitochondrial DNA (mtDNA) sequencing
A 595-bp fragment of the mitochondrial NADH dehydrogenase 1 (ND1, 957 bp in length) was amplified and sequenced to determine genetic background of oocytes (“maternal”) used for cloning. The following PCR primers were designed based on the Sus scrofa mt DNA (GenBank access number AF034253): forward 5’-CCT ACT GGC CGT AGC ATT-3’, reverse 5’- GAA TCG TGG GTA TGA TGC TC-3’. PCR was performed using the Taq PCR kit (New England Biolab, Ipswich, MA). Briefly, 5 ng of total DNA in a 50 μl reaction mixture (1X standard Taq reaction buffer, 0.2 mM dNTP mixture, 0.75 μM of each primer, and 2.5 U Taq DNA Polymerase) was subjected to an initial denaturation at 94°C for 3 min, followed by 30 cycles of denaturation at 94°C for 20 sec, annealing at 60°C for 20 sec, extension at 72°C for 30 sec, and last extension at 72°C for 5 min. After purification by using ExoSAP-IT (USB, Cleveland, OH), the PCR products were sequenced by using the BigDye Terminator v1.1 Cycle Sequencing kit with ABI PRISM Model 3700 (Applied Biosystems Inc., Foster City, CA). Briefly, 30 μM of purified PCR products in a 20 μl reaction mixture (1X Terminator Ready Reaction Mix, 1X BigDye Sequencing Buffer, and 0.75 μM forward or reverse primer) were subjected to an initial denaturation at 94°C for 5 min, followed by 25 cycles of denaturation at 96°C for 10 sec, annealing at 50°C for 15 sec, and extension at 60°C for 4 min. The reaction mixture was then purified with DyeEx 2.0 (Qiagen, Valencia, CA), and electrophoresis was performed at Biotechnology/Bioservice Center at the University of Connecticut. Sequence similarity was measured by Basic Local Alignment Search Tool (BLAST, http://blast.ncbi.nlm.nih.gov/Blast.cgi). Bit score from the in silico sequence BLAST was used to determine maternal lineage by ND1 sequence, and lineage-specific mtDNA polymorphisms were identified with Sequencher (version 4.1.4, Gene Codes, Ann Arbor, MI) by comparing with pig mtDNA reference sequences.
DNA Microarray
The porcine Array-Ready Oligo Set (version 1.1, Operon Technologies, Alameda, CA) [24] was used in this study. Out of the 13,310 total probes, 566 genes were involved in mitochondrial functions including 534 and 32 genes from nuclear and mitochondrial DNA, respectively. Reference RNA was isolated and pooled from brain, kidney, liver, and lung tissues of male and female pig fetuses [25, 26]. Aminoallyl-linked cDNA was generated from 10 μg of the reference and extracted total RNA by reverse transcription, followed by labeling with Cy3 or Cy5, and hybridized to microarray slides as described [25, 27]. A total of 44 microarrays were used by co-hybridizing reference and extracted RNA with dye-swap. After scanning, local background subtraction was performed in GenePix Pro 6.0 (Molecular Devices, Union City, CA), and probes were flagged as “present” if they had at least 70% of feature pixels with more than two standard deviations (SD) above the background in either the Cy3 or Cy5 channel. Signal intensities of the “present probes” were loaded into GeneSpring 6.1 (Agilent Technologies, Palo Alto, CA). All microarrays were normalized by the Lowess method [28]. Probes were assigned as “informative” when they were present in either the reference or sample in more than 90% of the microarrays with raw expression values > 100, and a SD < 1.4 [29]. Informative probes were used for further analysis. Hierarchical clustering was conducted with three different informative probe sets: 1) all informative probes (global); informative probes involved in mitochondrial functions and encoded by the 2) nuclear DNA and 3) mtDNA. Differentially expressed (DE) genes were defined as those with a fold change ≥ 1.5 and a p-value ≤ 0.05 (Welch t-test adjusted by using Benjamini and Hochberg false discovery rate). Functional annotation was followed with RefSeq IDs from human orthologs of the DE genes using the Database for Annotation, Visualization and Integrated Discovery (DAVID, http://david.abcc.ncifcrf.gov) [30].
Quantitative real-time RT-PCR (qPCR)
Nine genes involved in mitochondrial functions, of which 2 are encoded by mtDNA, were selected for qPCR validation. Using GenBank or Sus Scrofa Gene Index (SsGI) release 12.0, primers were designed to generate PCR products that harbored probe sequences of the microarray (Table 1). Tubulin beta-2 (TBB2) and the reference RNA were used as the internal control and as the calibrator, respectively. qPCR was performed with ABI 7500 Fast Real-Time PCR System (Applied Biosystems). Briefly, 2 ng of cDNA in a 20 μl reaction mixture [1X SYBR Green PCR master mix (Applied Biosystems), 0.3 μM of each primer] was subjected to an initial denaturation at 95°C for 10 min, followed by 40 cycles of denaturation at 95°C for 15 sec and annealing/extension at 60°C for 1 min. Data were analyzed using ABI prism SDS software (Applied Biosystems), and the relative expression levels of the target genes were calculated using the comparative CT method according to the manufacturer’s instruction. Parametric data were tested for equal variance by using an F-test, and when it was not significant, data were subject to one-sided t-test (p < 0.05).
Table 1. Primer sequences for qPCR.
| Gene | Type | Sequence | Tm | Amplicon (bp) | SsGI Release 12.0 accession number |
|---|---|---|---|---|---|
| ACSL1 | Forward Primer | AGTCTTCACCCTGAATTATTCTCCAT | 59 | 80 | TC240600 |
| Reverse Primer | TTCCGAAGCTCTGGCCTTTT | 60 | |||
| CEBPA | Forward Primer | GGACCACCAGTCTTGTCTGTACTG | 59 | 80 | TC292331 |
| Reverse Primer | TCCCTCTGGGATGGACTGATT | 59 | |||
| COX4I1 | Forward Primer | GCAGGATGTTGGCTACCAGAGT | 59 | 92 | TC275877 |
| Reverse Primer | CTTCACGACGCTTCCATGTG | 59 | |||
| COX7C | Forward Primer | GCGCAATGTTGGGACAGAGT | 60 | 79 | TC298342 |
| Reverse Primer | TTCCCTGGACCCTCCTCATAG | 59 | |||
| GLUL | Forward Primer | GGTGGGAAATGAGGTAGGAAAAT | 58 | 81 | TC162304 |
| Reverse Primer | CGAACATAATCAGGGCCTTTAGC | 60 | |||
| NDUFA4 | Forward Primer | GGAGGTACTGGAGCAGCACTGTAT | 60 | 74 | TC182398 |
| Reverse Primer | TTCTTCCTGTCCCAACAGACATC | 59 | |||
| NOTCH3 | Forward Primer | ACTTCACTGCATTCCAGATGGA | 58 | 111 | TC257056 |
| Reverse Primer | GCCAGTTCCCAAAGGGATTC | 59 | |||
| P38 | Forward Primer | GGGCCAAGGTGTCTCCATTT | 60 | 96 | TC287045 |
| Reverse Primer | CCTTCCTTCTCGCTCCAGTTG | 60 | |||
| TBB2 | Forward Primer | ACCCGAGGGACCTCTTTATTCA | 60 | 84 | TC279724 |
| Reverse Primer | AGACAGGAAGAAGAACAGATACACACA | 59 | |||
| UQCR | Forward Primer | ATCTTCCTTCTTAAACTTGCCATTG | 58 | 76 | TC182529 |
| Reverse Primer | GCTGGTATGGGCCACTGACT | 59 |
Results
Determination of the “maternal background” of the cloned piglets
All microarray data from this study have been submitted to NCBI under the accession number of GSE68877. All sequences of mtDNA obtained in the current study were of either the Large White or the Duroc breed. For convenience, the ND1 transcription start site was designated as Base #1 in the sequenced fragment. Seven breed-specific ND1 gene polymorphisms between the Large White and Duroc (Table 2; T342C, T369C, T420C, G438A, G459A, C489A, and C712T from the Large White to the Duroc) were found in the 371-bp fragment analyzed. Alignment with mtDNA reference sequences confirmed lineage-specific ND1 gene polymorphisms at the expected base positions as well. None of these are anticipated to cause translational variants.
Table 2. Mitochondrial ND1 gene sequence analysis.
| Group | Base comparison | BLAST hit | Matched strain | Bit score | |||||||||
|---|---|---|---|---|---|---|---|---|---|---|---|---|---|
| Deceased | Base position | 316 | 342 | 369 | 420 | 438 | 459 | 489 | 528 | 712 | |||
| Reference | C | T a | T a | T a | G a | G a | C a | T | C a | AF486874 | Large White | ||
| Control ID | |||||||||||||
| 263–1 | C | T | T | T | G | G | C | C b | C | AF486874 | Large White | 1172 | |
| 263–2 | C | T | T | T | G | G | C | C b | C | AF486874 | Large White | 1172 | |
| 263–3 | C | T | T | T | G | G | C | C b | C | AF486874 | Large White | 1172 | |
| 263–4 | C | T | T | T | G | G | C | C b | C | AF486874 | Large White | 1172 | |
| 263–5 | C | T | T | T | G | G | C | C b | C | AF486874 | Large White | 1172 | |
| Clone ID | |||||||||||||
| 628–1 | C | T | T | T | G | G | C | C b | C | AF486874 | Large White | 1179 | |
| 629–1 | C | T | T | T | G | G | C | C b | C | AF486874 | Large White | 1179 | |
| 635–1 | C | T | T | T | G | G | C | C b | C | AF486874 | Large White | 1179 | |
| 635–2 | C | C | C | C | A | A | A | T | T | AY337045 | Duroc | 1179 | |
| 637–1 | C | T | T | T | G | G | C | C b | C | AF486874 | Large White | 1179 | |
| 642–1 | C | C | C | C | A | A | A | T | T | AY337045 | Duroc | 1179 | |
| 671–5 | C | C | C | C | A | A | A | T | T | AY337045 | Duroc | 1179 | |
| Live | Base position | 316 | 342 | 369 | 420 | 438 | 459 | 489 | 528 | 712 | |||
| Reference | C | C a | C a | C a | A a | A a | A a | T | T a | AY337045 | Duroc | ||
| control ID | |||||||||||||
| 42–7 | C | C | C | C | A | A | A | T | T | AY337045 | Duroc | 1179 | |
| 42–8 | C | C | C | C | A | A | A | T | T | AY337045 | Duroc | 1179 | |
| 42–11 | C | C | C | C | A | A | A | T | T | AY337045 | Duroc | 1179 | |
| 42–12 | C | C | C | C | A | A | A | T | T | AY337045 | Duroc | 1179 | |
| 47–2 | C | C | C | C | A | A | A | T | T | AY337045 | Duroc | 1179 | |
| Clone ID | |||||||||||||
| 43–1 | C | T | T | T | G | G | C | T | C | AF486874 | Large White | 1179 | |
| 43–2 | C | T | T | T | G | G | C | T | C | AF486874 | Large White | 1179 | |
| 43–3 | C | T | T | T | G | G | C | T | C | AF486874 | Large White | 1179 | |
| 44–1 | T2 | C | C | C | A | A | A | T | T | AY337045 | Duroc | 1172 | |
| 45–1 | C | T | T | T | G | G | C | T | C | AF486874 | Large White | 1179 | |
aStrain-specific DNA polymorphism
bNonsense mutation
We then used the mtDNA sequences of the two breeds to determine the maternal background of the clones and their respective controls. The controls in the deceased and the live groups matched to the Large White (AF486874, bit score = 1,172), and Duroc (AY337045, bit score = 1,179), respectively. For the deceased clones, four gave the best match against the Large White (bit score = 1,179) and the other three against Duroc (bit score = 1,179). Four of the live clones matched to the Large White (bit score = 1,179) and the other to Duroc (bit score = 1,172).
Hierarchical clustering of expression profiles of global, nuclear DNA- and mtDNA-encoded genes involved in mitochondrial functions
Expression profiles of global, nuclear DNA- and mtDNA-encoded genes of mitochondrial functions of the clones were compared with those of their conventionally bred counterparts (Fig 1). In the deceased group, global expression of 9,297 informative probes (69.8%) was largely clustered by treatment (clone vs. control). The correlation coefficient (r) of the controls was 0.925 compared with that of the clones at r = 0.673, demonstrating more variability in the cloned group. Likewise, 534 (4%) nuclear DNA-encoded genes of mitochondrial functions from the informative probes revealed that samples were clustered by treatment with r = 0.924 and 0.638 for controls and clones, respectively. Neither the global nor the nuclear DNA-encoded genes clustered with the maternal background. In contrast, the 32 (0.2%) mtDNA-encoded genes did not cluster by treatment or breed with the lowest correlation at r = 0.473.
Fig 1. Hierarchical clustering of global, nuclear DNA (nDNA)- and mitochondrial DNA (mtDNA)-encoded genes of deceased (top panel) and live clones (bottom panel) vs. age-matched controls.
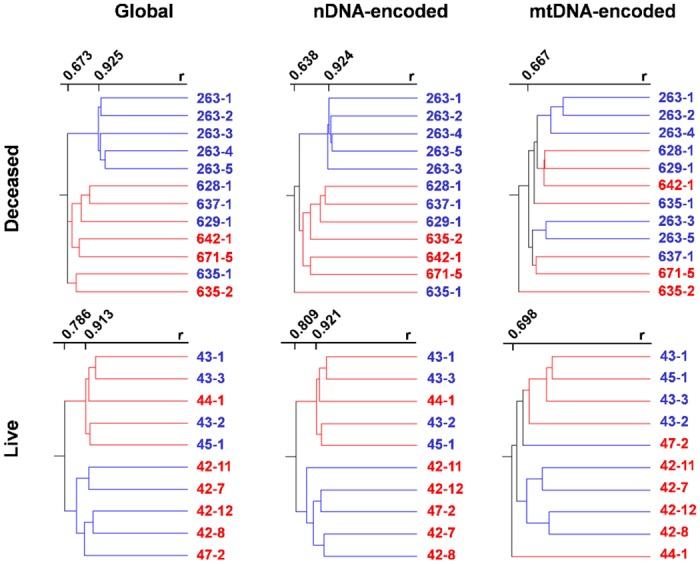
From left to right, clustering with all informative probes, nuclear DNA- and mitochondrial DNA-encoded probes involved in mitochondrial functions were depicted. r = correlation coefficient, red line = clones, blue line = controls, red animal ID = Duroc, blue animal ID = Large White.
In the live clone group, 9,955 probes (74.8%) were found to be informative for further analysis. As is with the dead group, hierarchical clustering of the informative probes also separated samples by treatment with r = 0.871 and 0.913 for controls and clones, respectively. Similarly, 451 nuclear DNA-encoded genes for mitochondrial functions (3.4%) were clustered by treatment with r = 0.879 and 0.921 for controls and clones, respectively. For the 32 mtDNA-encoded genes (0.2%), most samples separated by treatment with the exception of one clone of the Duroc background (Animal ID: 44–1) and a control of the Large White background (Animal ID: 47–2).
Functional annotation of differentially expressed genes involved in mitochondrial functions
In the deceased group, 46 differentially expressed (DE) genes were identified, among which 43 were encoded by the nuclear DNA and 3 by the mtDNA. Seventeen of the nuclear-encoded genes were up-regulated and 26 down-regulated compared to controls (Table 3). Functional annotation of these DE genes revealed that the following nine involved in the OXPHOS pathway (Fig 2): NADH dehydrogenase (ubiquinone) 1 alpha subcomplex 4 (NDUFA4), ubiquinol-cytochrome c reductase complex III subunit VII (UQCRQ), ubiquinol-cytochrome c reductase (UQCR), ATPase V1 subunit E1 (ATP6V1E1), ATP synthase F1 complex beta polypeptide (ATP5B), and ATP synthase F0 complex subunit C1 (ATP5G1), all encoded by the nuclear DNA, as well as cytochrome c oxidase subunit 1 (COX1), cytochrome c oxidase subunit 2 (COX2), and NADH dehydrogenase 3 (ND3), all encoded by the mtDNA.
Table 3. Differentially expressed mitochondrial genes in deceased cloned piglets.
| Encoded from | GenBank ID | TC ID | Fold change c | Gene Symbol | Gene Name |
|---|---|---|---|---|---|
| nDNA a | NM_004169 | TC182203 | 3.65 | SHMT1 | SERINE HYDROXYMETHYLTRANSFERASE 1 |
| NM_004052 | TC182058 | 2.64 | BNIP3 | BCL2/ADENOVIRUS E1B 19KDA INTERACTING PROTEIN 3 | |
| NM_002065 | TC162304 | 2.12 | GLUL | GLUTAMATE-AMMONIA LIGASE (GLUTAMINE SYNTHETASE) | |
| NM_000817 | TC189704 | 2.07 | GAD1 | GLUTAMATE DECARBOXYLASE 1 | |
| NM_000274 | TC181897 | 2.05 | OAT | ORNITHINE AMINOTRANSFERASE | |
| NM_000663 | TC186487 | 1.97 | ABAT | 4-AMINOBUTYRATE AMINOTRANSFERASE | |
| NM_002612 | TC167221 | 1.91 | PDK4 | PYRUVATE DEHYDROGENASE KINASE, ISOZYME 4 | |
| NM_001437 | TC169575 | 1.88 | ESR2 | ESTROGEN RECEPTOR 2 (ER BETA) | |
| NM_001006642 | TC166867 | 1.87 | SLC25A25 | SOLUTE CARRIER FAMILY 25 (MITOCHONDRIAL CARRIER; PHOSPHATE CARRIER), MEMBER 25 | |
| NM_021232 | N/A | 1.73 | PRODH2 | PROLINE DEHYDROGENASE (OXIDASE) 2 | |
| NM_001696 | TC162504 | 1.62 | ATP6V1E1 | ATPASE, H+ TRANSPORTING, LYSOSOMAL 31KDA, V1 SUBUNIT E1 | |
| NM_000349 | TC162876 | 1.61 | STAR | STEROIDOGENIC ACUTE REGULATOR | |
| NM_012094 | TC164220 | 1.57 | PRDX5 | PEROXIREDOXIN 5 | |
| NM_022036 | TC164081 | 1.56 | GPRC5C | G PROTEIN-COUPLED RECEPTOR, FAMILY C, GROUP 5, MEMBER C | |
| NM_020166 | TC186613 | 1.55 | MCCC1 | METHYLCROTONOYL-COENZYME A CARBOXYLASE 1 (ALPHA) | |
| NM_004415 | TC188422 | 1.53 | DSP | DESMOPLAKIN | |
| NM_005763 | TC190934 | 1.52 | AASS | AMINOADIPATE-SEMIALDEHYDE SYNTHASE | |
| NM_002080 | TC163473 | 0.67 | GOT2 | GLUTAMIC-OXALOACETIC TRANSAMINASE 2, MITOCHONDRIAL (ASPARTATE AMINOTRANSFERASE 2) | |
| NM_006111 | TC185178 | 0.66 | ACAA2 | ACETYL-COENZYME A ACYLTRANSFERASE 2 (MITOCHONDRIAL 3-OXOACYL-COENZYME A THIOLASE) | |
| NM_014297 | TC181027 | 0.66 | ETHE1 | ETHYLMALONIC ENCEPHALOPATHY 1 | |
| NM_000308 | TC182001 | 0.66 | PPGB | PROTECTIVE PROTEIN FOR BETA-GALACTOSIDASE | |
| NM_000397 | TC163629 | 0.66 | CYBB | CYTOCHROME B-245, BETA POLYPEPTIDE | |
| NM_006793 | TC181710 | 0.65 | PRDX3 | PEROXIREDOXIN 3 | |
| NM_003679 | TC168142 | 0.65 | KMO | KYNURENINE 3-MONOOXYGENASE (KYNURENINE 3-HYDROXYLASE) | |
| NM_015469 | TC188504 | 0.65 | NIPSNAP3A | NIPSNAP HOMOLOG 3A | |
| NM_000016 | TC183520 | 0.64 | ACADM | ACYL-COENZYME A DEHYDROGENASE, C-4 TO C-12 STRAIGHT CHAIN | |
| NM_001686 | TC162934 | 0.64 | ATP5B | ATP SYNTHASE, H+ TRANSPORTING, MITOCHONDRIAL F1 COMPLEX, BETA POLYPEPTIDE | |
| NM_020312 | TC182787 | 0.64 | COQ9 | COENZYME Q9 HOMOLOG | |
| NM_012259 | TC168760 | 0.64 | HEY2 | HAIRY/ENHANCER-OF-SPLIT RELATED WITH YRPW MOTIF 2 | |
| NM_002489 | TC182398 | 0.64 | NDUFA4 | NADH DEHYDROGENASE (UBIQUINONE) 1 ALPHA SUBCOMPLEX, 4, 9KDA | |
| NM_014402 | TC164365 | 0.63 | UQCRQ | UBIQUINOL-CYTOCHROME C REDUCTASE, COMPLEX III SUBUNIT VII, 9.5KDA | |
| NM_002396 | TC167924 | 0.63 | ME2 | MALIC ENZYME 2, NAD(+)-DEPENDENT, MITOCHONDRIAL | |
| NM_001985 | TC163232 | 0.62 | ETFB | ELECTRON-TRANSFER-FLAVOPROTEIN, BETA POLYPEPTIDE | |
| NM_014481 | TC166660 | 0.62 | APEX2 | APEX NUCLEASE (APURINIC/APYRIMIDINIC ENDONUCLEASE) 2 | |
| NM_006830 | TC182529 | 0.62 | UQCR | UBIQUINOL-CYTOCHROME C REDUCTASE, 6.4KDA SUBUNIT | |
| NM_020548 | TC182240 | 0.61 | DBI | DIAZEPAM BINDING INHIBITOR (GABA RECEPTOR MODULATOR, ACYL-COENZYME A BINDING PROTEIN) | |
| NM_012343 | TC189901 | 0.58 | NNT | NICOTINAMIDE NUCLEOTIDE TRANSHYDROGENASE | |
| NM_016497 | TC165872 | 0.55 | MRPL51 | MITOCHONDRIAL RIBOSOMAL PROTEIN L51 | |
| NM_005175 | TC163315 | 0.55 | ATP5G1 | ATP SYNTHASE, H+ TRANSPORTING, MITOCHONDRIAL F0 COMPLEX, SUBUNIT C1 (SUBUNIT 9) | |
| NM_002979 | TC163162 | 0.54 | SCP2 | STEROL CARRIER PROTEIN 2 | |
| NM_006082 | TC181275 | 0.52 | TUBA6 | TUBULIN, ALPHA, UBIQUITOUS | |
| NM_001876 | TC164450 | 0.46 | CPT1A | CARNITINE PALMITOYLTRANSFERASE 1A | |
| NM_001948 | TC184267 | 0.45 | DUT | DUTP PYROPHOSPHATASE | |
| mtDNA b | NM_006818 | TC168152 | 0.65 | COX1 | CYTOCHOROME C OXIDASE SUBUNIT 1 |
| N/A | TC181301 | 0.65 | COX2 | CYTOCHROME C OXIDASE SUBUNIT 2 | |
| N/A | TC190307 | 2.11 | ND3 | NADH DEHYDROGENASE 3 |
anDNA: nuclear DNA
bmtDNA: mitochondrial DNA
cFold change = clone/age-matched control
Fig 2. Dysregulated oxidative phosphorylation pathway of deceased cloned piglets.
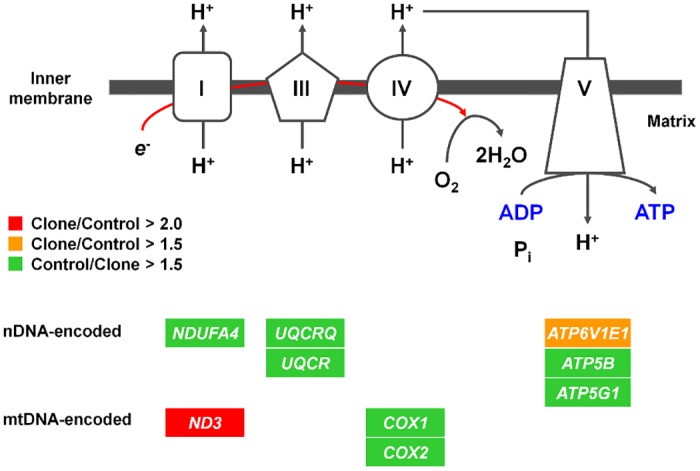
Genes in green boxes were down-regulated in clones (fold change > 1.5). Genes in orange box and red box were upregulated in clones by more than 1.5-, and 2.0-fold, respectively. Data were analyzed by using the Fisher’s exact test (p < 9.95 x 10⁻⁷, Benjamini and Hochberg FDR = 0.00019).
In the live clones, 35 nuclear DNA-encoded DE genes were found (Table 4). Among them, 24 were up-regulated and 11 were down-regulated compared to controls. Three mtDNA-encoded genes were also identified as differentially expressed. Functional analysis revealed that six nuclear genes were involved in the “FATTY ACID METABOLISM” pathway. These are dodecenoyl-coenzyme A delta isomerase (DCI), enoyl coenzyme A hydratase short chain 1 (ECHS1), glutaryl-coenzyme A dehydrogenase (GCDH), L-3-hydrozyacyl-coenzyme A dehydrogenase short chain (HADHSC), acetyl-coenzyme A acyltransferase 2 (ACAA2), and fatty-acid-coenzyme A ligase long chain 1 (ACSL1). However, no significant functional annotation was enriched with the DE genes encoded by mtDNA.
Table 4. Differentially expressed mitochondrial genes in live cloned piglets.
| Encoded from | GenBank ID | TC ID | Fold change c | Gene Symbol | Gene Name |
|---|---|---|---|---|---|
| nDNA a | NM_014585 | TC165023 | 2.13 | SLC40A1 | SOLUTE CARRIER FAMILY 40 (IRON-REGULATED TRANSPORTER), MEMBER 1 |
| NM_004331 | TC184073 | 1.79 | BNIP3L | BCL2/ADENOVIRUS E1B 19KDA INTERACTING PROTEIN 3-LIKE | |
| NM_170711 | TC183283 | 1.70 | DAZAP1 | DAZ ASSOCIATED PROTEIN 1 | |
| NM_001752 | TC181995 | 1.69 | CAT | CATALASE | |
| NM_012343 | TC189901 | 1.65 | NNT | NICOTINAMIDE NUCLEOTIDE TRANSHYDROGENASE | |
| NM_001919 | TC181889 | 1.64 | DCI | DODECENOYL-COENZYME A DELTA ISOMERASE (3,2 TRANS-ENOYL-COENZYME A ISOMERASE) | |
| NM_015917 | TC161988 | 1.63 | GSTK1 | GLUTATHIONE S-TRANSFERASE SUBUNIT 13 HOMOLOG | |
| NM_002979 | TC163162 | 1.63 | SCP2 | STEROL CARRIER PROTEIN 2 | |
| NM_000456 | TC185923 | 1.61 | SUOX | SULFITE OXIDASE | |
| NM_005881 | TC163821 | 1.59 | BCKDK | BRANCHED CHAIN KETOACID DEHYDROGENASE KINASE | |
| NM_018838 | TC164907 | 1.58 | NDUFA12 | NADH DEHYDROGENASE (UBIQUINONE) 1 ALPHA SUBCOMPLEX, 12 | |
| NM_004092 | TC181253 | 1.57 | ECHS1 | ENOYL COENZYME A HYDRATASE, SHORT CHAIN, 1, MITOCHONDRIAL | |
| NM_000159 | TC182620 | 1.57 | GCDH | GLUTARYL-COENZYME A DEHYDROGENASE | |
| NM_005327 | TC183224 | 1.56 | HADHSC | L-3-HYDROXYACYL-COENZYME A DEHYDROGENASE, SHORT CHAIN | |
| NM_005984 | TC163540 | 1.56 | SLC25A1 | SOLUTE CARRIER FAMILY 25 (MITOCHONDRIAL CARRIER; CITRATE TRANSPORTER), MEMBER 1 | |
| NM_000398 | TC183476 | 1.55 | CYB5R3 | CYTOCHROME B5 REDUCTASE 3 | |
| NM_006111 | TC185178 | 1.54 | ACAA2 | ACETYL-COENZYME A ACYLTRANSFERASE 2 (MITOCHONDRIAL 3-OXOACYL-COENZYME A THIOLASE) | |
| NM_004453 | TC166131 | 1.53 | ETFDH | ELECTRON-TRANSFERRING-FLAVOPROTEIN DEHYDROGENASE | |
| NM_001359 | TC182911 | 1.53 | DECR1 | 2,4-DIENOYL COA REDUCTASE 1, MITOCHONDRIAL | |
| NM_001609 | TC167600 | 1.52 | ACADSB | ACYL-COENZYME A DEHYDROGENASE, SHORT/BRANCHED CHAIN | |
| NM_032549 | TC167347 | 1.51 | IMMP2L | IMP2 INNER MITOCHONDRIAL MEMBRANE PEPTIDASE-LIKE | |
| NM_002858 | TC166623 | 1.51 | ABCD3 | ATP-BINDING CASSETTE, SUB-FAMILY D (ALD), MEMBER 3 | |
| NM_012181 | TC161966 | 1.50 | FKBP8 | FK506 BINDING PROTEIN 8, 38KDA | |
| NM_030791 | TC164539 | 1.50 | SGPP1 | SPHINGOSINE-1-PHOSPHATE PHOSPHATASE 1 | |
| NM_018947 | TC163123 | 0.65 | CYCS | CYTOCHROME C, SOMATIC | |
| NM_001995 | TC163394 | 0.64 | ACSL1 | FATTY-ACID-COENZYME A LIGASE, LONG-CHAIN 1 | |
| NM_018188 | TC162178 | 0.63 | ATAD3A | ATPASE FAMILY, AAA DOMAIN CONTAINING 3A | |
| NM_005729 | TC182963 | 0.60 | PPIF | PEPTIDYLPROLYL ISOMERASE F (CYCLOPHILIN F) | |
| NM_031212 | TC182541 | 0.58 | SLC25A28 | SOLUTE CARRIER FAMILY 25, MEMBER 28 | |
| NM_000032 | TC166637 | 0.58 | ALAS2 | AMINOLEVULINATE, DELTA-, SYNTHASE 2 | |
| NM_002065 | TC165015 | 0.54 | GLUL | GLUTAMATE-AMMONIA LIGASE (GLUTAMINE SYNTHETASE) | |
| NM_001006642 | TC166867 | 0.48 | SLC25A25 | SOLUTE CARRIER FAMILY 25 (MITOCHONDRIAL CARRIER; PHOSPHATE CARRIER), MEMBER 25 | |
| NM_199187 | TC162826 | 0.41 | KRT18 | KERATIN 18 | |
| NM_000636 | TC164641 | 0.25 | SOD2 | SUPEROXIDE DISMUTASE 2, MITOCHONDRIAL | |
| NM_002612 | N/A | 0.20 | PDK4 | PYRUVATE DEHYDROGENASE KINASE, ISOZYME 4 | |
| mtDNA b | N/A | TC176636 | 1.60 | ATP6 | ATPASE SUBUNIT 6 |
| N/A | TC166635 | 0.66 | COX3 | CYTOCHROME C OXIDASE SUBUNIT 3 | |
| NM_016357 | TC167974 | 0.62 | ND2 | NADH DEHYDROGENASE SUBUNIT 2 |
anDNA: nuclear DNA
bmtDNA: mitochondrial DNA
cFold change = clone/age-matched control
The expression levels of nine genes were validated by qPCR (Fig 3). They are GLUL, CEBPA, NOTCH3 (up-regulated in clones), NDUFA4, UQCR, ACSL1 (down-regulated in clones), and COX4l1, COX7C, P38 (control level of expression in clones). Although slight differences in the fold changes of three genes were observed (GLUL, ACSL1, and P38), overall the qPCR results confirmed the directionality of the microarray.
Fig 3. Comparisons of representative gene expressions from qPCR and microarray.
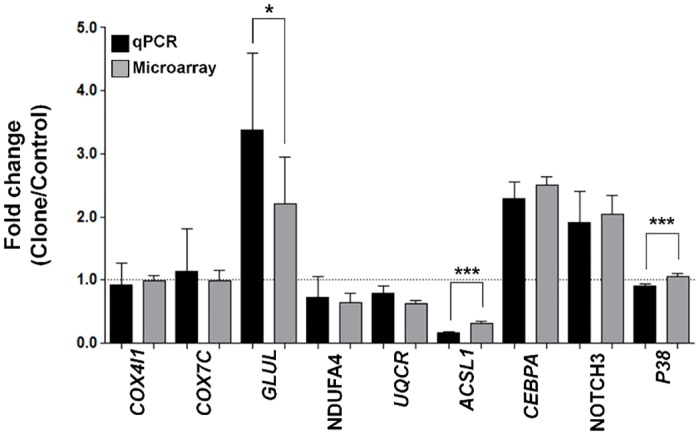
Black bars indicate mean gene expression data from qPCR, and gray bars from microarray. Error bars mean ± SD. Data were analyzed by one-sided t-test (*p < 0.05, ***p < 0.001).
Discussion
Using sequence variations in the mtDNA-encoded ND1 gene, we first determined the “maternal background” of clones and controls used in this study and subsequently analyzed if expression of genes involved in mitochondrial functions were normally expressed in the deceased and the live clones or if they are related to their maternal lineages. We found that all cloned piglets had either the Large White or the Duroc as the maternal background. These breeds are the most common commercial pig lineages of the world and serve to produce many mixed-lineaged commercial hogs [31]. Although these European domestic pig lineages are closely related in their maternal lines, Large White is supposed to have separated from the European lineages around 58,000 year ago. In addition, the genetic distance between the Large White and the Duroc is 40-fold longer than that among European domestic lineages [32]; therefore, it should be feasible to distinguish between the maternal lineage of the Large White and the Duroc by using mitochondrial ND 1 gene sequence By sequence alignment, we found seven lineage-specific ND1 polymorphisms from the 371-bp target fragment. Interestingly, these polymorphisms were not supposed to induce translational variants. Therefore, these ND1 polymorphisms are good candidates for lineage determination while not affecting function s of the mitochondrial OXPHOS complex I. We did not find maternal lineage-dependent survivability of cloned piglets. Whether oocytes of different maternal breed background critically impact the cloning efficiency or survivability in pigs requires additional study and larger datasets.
The persistence of donor cell-derived mtDNA in cloned animals has been reported in four mammalian species including pigs [9]. The degree of heteroplasmy; however, has been found to be highly variable, ranging from 0 to 57% when donor cell was an embryonic blastomere determined by restriction digestion and Southern blotting [10]. Most somatic cell clones only contain a low fraction (<1%) of the donor cell mtDNA as determined by the more sensitive qPCR method [11]. In general, it is thought that the onset of physiological effects of pathogenic heteroplasmy begins when the ratio of mutant to normal mtDNA exceeds a specific threshold. For example, heteroplasmy-induced mitochondrial dysfunction contributes to pulmonary hypertension associated with cardiac output in mice. Quantification analysis revealed that most organs in these mice have more than 30% of mutant mtDNA [12]. In addition, a very low proportion of mutant heteroplasmy (less than 5%) is of questionable clinical significance since it may be due to laboratory error [33]. In preliminary trials of this study, we determined that a higher than 25% heteroplasmy would be detectable by sequencing the ND1. None of the cloned animals has such a high level of heteroplasmy (data not shown). Therefore, we excluded the possibility of pathogenesis contributed by donor cell-derived mtDNA.
Developmental competence of reconstructed embryos is significantly affected by the cytoplasm of the recipient oocytes. For example, oocytes from the hybrid strain BDF1 produce the highest cloning efficiency in the mouse [34]. Using oocytes of three different breeds and the same donor cell line, both transferable cloned embryos and viable bovine cloned fetuses were found to vary in phenotype based on different oocyte cytoplasm [19]. These cytoplasmic effects continued to affect birth weight, crump-rump length, and femoral length of cloned fetuses. In inter-subspecies SCNT embryos in goats, full term birth rates were highest in intra-species SCNT controls, followed by NT using recipient oocytes of crossbred goats with the lowest birth rate resulting from Boer donor cells into Saanen oocytes [20]. Furthermore, structure and quantity of mitochondria in the recipient oocytes have also been shown to influence the developmental potential of reconstructed bovine embryos [35]. For instance, oocytes with different mtDNA haplotype have a different copy number of mtDNA and ATP content. These oocytes have differential expression levels of COX1 and COX3, key components of the OXPHOS pathway and ATP generation, which is suspected to affect the cloning efficiency. These results shed light on the relevance of the maternal oocyte lineage to generate cloned animals by SCNT. In contrast, the maternal lineages revealed in this study were found to not be critical for embryo-fetal development or at least for viability of cloned piglets. Therefore, it is likely that the recipient oocytes retrieved at least from the Large White and/or the Duroc do not affect the cloning efficiency in pigs as opposed to observations in the mouse or bovine where the source of the oocyte is important.
Despite the lack of correlation of clone pig survival and mitochondrial lineages, gene expression analyses revealed an interruption of the interaction between genes encoded by the nuclear and mtDNA. Lack of expression coordination, especially abnormal expression of mtDNA-encoded genes, can affect nuclear DNA expression at the cellular level. For example, in the respiratory-deficient cell line lacking mtDNA (ρ°cells), the expression levels of numerous nuclear DNA-encoded genes for mitochondrial biogenesis and functions are dysregulated [36]. Kulawiec et al. reported that in ρ°cells, UQCRC1, a nuclear DNA-encoded gene, is down-regulated by as much as 10-fold. Furthermore, in both breast and ovarian carcinomas, UQCRC1 expression is positively correlated with mtDNA-encoded COX2 expression [17]. In this study, expression profiles of mtDNA-encoded genes in the live clone group showed treatment-dependent clustering. However, clustering analysis based on the expression profiles of mtDNA-encoded genes of the deceased clones showed an intermixed pattern with their age-matched control. These results imply that disruption in mitochondria-to-nucleus interaction occurred only in the deceased cloned piglets. Such lack of coordination may affect energy metabolism in the lungs and contribute to the overall deficiency in full development of clones.
Annotation analysis revealed that defects in the OXPHOS pathway could have contributed early death of cloned piglets. Several genes for OXPHOS pathway were differentially expressed in the deceased cloned piglets. For example, COX1 and COX2, two of the three mtDNA-encoded genes involved in OXPHOS complex IV, were significantly down-regulated only in the deceased clones. NDUFA4 and ND3 are complex I subunits encoded from nuclear and mtDNA, respectively. Mitochondrial genes like ND3 are down-regulated under pathological conditions such as glioblastoma [37] and hypoxia [38], and it was accompanied by the reduction of the activities of the respiratory enzyme complexes. Furthermore, down-regulation of these genes leads to loss of complex IV and complex I assemblies and activities [39, 40]. Another down-regulated gene in clones, UQCRQ, encodes a ubiquinone-binding protein (QP-C) as a subunit of complex III. A deletion in this gene decreases cytochrome b content which affects the assembly or maintenance of complex III [41]. ATP5B is a beta subunit of ATP synthase that catalyzes ATP formation using the energy of proton flux through the mitochondrial inner membrane during OXPHOS [42], and it is down-regulated in ulcerative colitis affecting the colon mucosa with other mitochondrial proteins [43]. Multiple copies of subunit C in the transmembrane portion (F0) of the ATP synthase transport rotate protons across the mitochondrial inner membrane to the F1-ATPase. ATP5G1 is one of the subunit C genes, and mature forms of ATP5G1, ATP5G2, and ATP5G3 are identical [44]. In alcohol consuming rats, all of these genes were dysregulated accompanying mitochondrial injury in the pancreas [45]. The abnormal expression of all of the genes above in deceased clones likely resulted in reduced ATP generation and pulmonary functionality.
In conclusion, this study demonstrates that the lineage of recipient oocytes may have little or no effect on the viability of cloned piglets by SCNT. However, cloned pigs may develop abnormal expression of both nuclear and mtDNA-encoded genes especially in the OXPHOS pathway, leading to a disruption of coordination of nuclear and mitochondrion interactions.
Data Availability
All relevant data are within the paper.
Funding Statement
The work received the following grant support: USDA Regional Research Project W2171 and USDA-ARS contract 58-1265-0-040.
References
- 1. Wilmut I, Schnieke AE, McWhir J, Kind AJ, Campbell KH. Viable offspring derived from fetal and adult mammalian cells. Nature. 1997;385(6619):810–3. . [DOI] [PubMed] [Google Scholar]
- 2. Kishigami S, Wakayama S, Hosoi Y, Iritani A, Wakayama T. Somatic cell nuclear transfer: infinite reproduction of a unique diploid genome. Exp Cell Res. 2008;314(9):1945–50. 10.1016/j.yexcr.2008.01.027 [DOI] [PubMed] [Google Scholar]
- 3. Ogonuki N, Inoue K, Yamamoto Y, Noguchi Y, Tanemura K, Suzuki O, et al. Early death of mice cloned from somatic cells. Nat Genet. 2002;30(3):253–4. . [DOI] [PubMed] [Google Scholar]
- 4. Lai L, Kolber-Simonds D, Park KW, Cheong HT, Greenstein JL, Im GS, et al. Production of alpha-1,3-galactosyltransferase knockout pigs by nuclear transfer cloning. Science. 2002;295(5557):1089–92. . [DOI] [PubMed] [Google Scholar]
- 5. Lan GC, Chang ZL, Luo MJ, Jiang YL, Han D, Wu YG, et al. Production of cloned goats by nuclear transfer of cumulus cells and long-term cultured fetal fibroblast cells into abattoir-derived oocytes. Molecular reproduction and development. 2006;73(7):834–40. . [DOI] [PubMed] [Google Scholar]
- 6. Powell AM, Talbot NC, Wells KD, Kerr DE, Pursel VG, Wall RJ. Cell donor influences success of producing cattle by somatic cell nuclear transfer. Biology of reproduction. 2004;71(1):210–6. . [DOI] [PubMed] [Google Scholar]
- 7. Urakawa M, Ideta A, Sawada T, Aoyagi Y. Examination of a modified cell cycle synchronization method and bovine nuclear transfer using synchronized early G1 phase fibroblast cells. Theriogenology. 2004;62(3–4):714–28. . [DOI] [PubMed] [Google Scholar]
- 8. Wallace DC. Mitochondrial diseases in man and mouse. Science. 1999;283(5407):1482–8. . [DOI] [PubMed] [Google Scholar]
- 9. Burgstaller JP, Schinogl P, Dinnyes A, Muller M, Steinborn R. Mitochondrial DNA heteroplasmy in ovine fetuses and sheep cloned by somatic cell nuclear transfer. BMC developmental biology. 2007;7:141 . [DOI] [PMC free article] [PubMed] [Google Scholar]
- 10. Hiendleder S, Schmutz SM, Erhardt G, Green RD, Plante Y. Transmitochondrial differences and varying levels of heteroplasmy in nuclear transfer cloned cattle. Molecular reproduction and development. 1999;54(1):24–31. . [DOI] [PubMed] [Google Scholar]
- 11. Hiendleder S, Zakhartchenko V, Wenigerkind H, Reichenbach HD, Bruggerhoff K, Prelle K, et al. Heteroplasmy in bovine fetuses produced by intra- and inter-subspecific somatic cell nuclear transfer: neutral segregation of nuclear donor mitochondrial DNA in various tissues and evidence for recipient cow mitochondria in fetal blood. Biology of reproduction. 2003;68(1):159–66. . [DOI] [PubMed] [Google Scholar]
- 12. Acton BM, Lai I, Shang X, Jurisicova A, Casper RF. Neutral mitochondrial heteroplasmy alters physiological function in mice. Biology of reproduction. 2007;77(3):569–76. . [DOI] [PubMed] [Google Scholar]
- 13. Neupert W. Protein import into mitochondria. Annu Rev Biochem. 1997;66:863–917. . [DOI] [PubMed] [Google Scholar]
- 14. Cotter D, Guda P, Fahy E, Subramaniam S. MitoProteome: mitochondrial protein sequence database and annotation system. Nucleic acids research. 2004;32(Database issue):D463–7. 10.1093/nar/gkh048 [DOI] [PMC free article] [PubMed] [Google Scholar]
- 15. Butow RA, Avadhani NG. Mitochondrial signaling: the retrograde response. Mol Cell. 2004;14(1):1–15. . [DOI] [PubMed] [Google Scholar]
- 16. McKenzie M, Trounce I. Expression of Rattus norvegicus mtDNA in Mus musculus cells results in multiple respiratory chain defects. J Biol Chem. 2000;275(40):31514–9. . [DOI] [PubMed] [Google Scholar]
- 17. Kulawiec M, Arnouk H, Desouki MM, Kazim L, Still I, Singh KK. Proteomic analysis of mitochondria-to-nucleus retrograde response in human cancer. Cancer Biol Ther. 2006;5(8):967–75. . [DOI] [PubMed] [Google Scholar]
- 18. Bruggerhoff K, Zakhartchenko V, Wenigerkind H, Reichenbach HD, Prelle K, Schernthaner W, et al. Bovine somatic cell nuclear transfer using recipient oocytes recovered by ovum pick-up: effect of maternal lineage of oocyte donors. Biology of reproduction. 2002;66(2):367–73. . [DOI] [PubMed] [Google Scholar]
- 19. Hiendleder S, Prelle K, Bruggerhoff K, Reichenbach HD, Wenigerkind H, Bebbere D, et al. Nuclear-cytoplasmic interactions affect in utero developmental capacity, phenotype, and cellular metabolism of bovine nuclear transfer fetuses. Biology of reproduction. 2004;70(4):1196–205. . [DOI] [PubMed] [Google Scholar]
- 20. Jian-Quan C, Juan C, Xu-Jun X, Guo-Hui L, Si-Guo L, Hong-Ying S, et al. Effect of cytoplast on the development of inter-subspecies nuclear transfer reconstructed goat embryo. Molecular reproduction and development. 2007;74(5):568–73. . [DOI] [PubMed] [Google Scholar]
- 21. Yan ZH, Zhou YY, Fu J, Jiao F, Zhao LW, Guan PF, et al. Donor-host mitochondrial compatibility improves efficiency of bovine somatic cell nuclear transfer. BMC developmental biology. 2010;10:31 10.1186/1471-213X-10-31 [DOI] [PMC free article] [PubMed] [Google Scholar]
- 22. Lee JH, Peters A, Fisher P, Bowles EJ, St John JC, Campbell KH. Generation of mtDNA homoplasmic cloned lambs. Cellular reprogramming. 2010;12(3):347–55. 10.1089/cell.2009.0096 . [DOI] [PubMed] [Google Scholar]
- 23. Carroll JA, Carter DB, Korte SW, Prather RS. Evaluation of the acute phase response in cloned pigs following a lipopolysaccharide challenge. Domestic animal endocrinology. 2005;29(3):564–72. 10.1016/j.domaniend.2005.03.009 . [DOI] [PubMed] [Google Scholar]
- 24. Zhao SH, Recknor J, Lunney JK, Nettleton D, Kuhar D, Orley S, et al. Validation of a first-generation long-oligonucleotide microarray for transcriptional profiling in the pig. Genomics. 2005;86(5):618–25. . [DOI] [PubMed] [Google Scholar]
- 25. Park J, Marjani SL, Lai L, Samuel M, Wax D, Davis SR, et al. Altered gene expression profiles in the brain, kidney, and lung of deceased neonatal cloned pigs. Cellular reprogramming. 2010;12(5):589–97. 10.1089/cell.2010.0004 [DOI] [PMC free article] [PubMed] [Google Scholar]
- 26. Park J, Marjani SL, Lai L, Samuel M, Wax D, Davis SR, et al. Altered gene expression profiles in the brain, kidney, and lung of deceased neonatal cloned pigs. unpublished. 10.1089/cell.2010.0004 [DOI] [PMC free article] [PubMed] [Google Scholar]
- 27. Park J, Lai L, Samuel M, Wax D, Bruno RS, French R, et al. Altered gene expression profiles in the brain, kidney, and lung of one-month-old cloned pigs. Cellular reprogramming. 2011;13(3):215–23. 10.1089/cell.2010.0088 [DOI] [PMC free article] [PubMed] [Google Scholar]
- 28. Clevel WS, and Devlin S. J.. Locally-weighted regression: an approach to regression analysis by local fitting. J Am Stat Assoc. 1988;83:596–610. [Google Scholar]
- 29. Jensen KB, Watt FM. Single-cell expression profiling of human epidermal stem and transit-amplifying cells: Lrig1 is a regulator of stem cell quiescence. Proc Natl Acad Sci U S A. 2006;103(32):11958–63. . [DOI] [PMC free article] [PubMed] [Google Scholar]
- 30. Dennis G Jr., Sherman BT, Hosack DA, Yang J, Gao W, Lane HC, et al. DAVID: Database for Annotation, Visualization, and Integrated Discovery. Genome Biol. 2003;4(5):P3 . [PubMed] [Google Scholar]
- 31. Tagliaro CH, Franco MHLP, Schneider MPC, de Brito BG, Barbosa AS. Biochemical polymorphisms and genetic relationships between brazilian and foreign breeds of pigs reared in Brazil. Ciencia Rural, Santa Maria. 1999;29(2):319. [Google Scholar]
- 32. Kim KI, Lee JH, Li K, Zhang YP, Lee SS, Gongora J, et al. Phylogenetic relationships of Asian and European pig breeds determined by mitochondrial DNA D-loop sequence polymorphism. Anim Genet. 2002;33(1):19–25. . [DOI] [PubMed] [Google Scholar]
- 33. Wong LJ, Boles RG. Mitochondrial DNA analysis in clinical laboratory diagnostics. Clin Chim Acta. 2005;354(1–2):1–20. . [DOI] [PubMed] [Google Scholar]
- 34. Latham KE. Strain-specific differences in mouse oocytes and their contributions to epigenetic inheritance. Development. 1994;120(12):3419–26. . [DOI] [PubMed] [Google Scholar]
- 35. Jiao F, Yan JB, Yang XY, Li H, Wang Q, Huang SZ, et al. Effect of oocyte mitochondrial DNA haplotype on bovine somatic cell nuclear transfer efficiency. Molecular reproduction and development. 2007;74(10):1278–86. . [DOI] [PubMed] [Google Scholar]
- 36. Traven A, Wong JM, Xu D, Sopta M, Ingles CJ. Interorganellar communication. Altered nuclear gene expression profiles in a yeast mitochondrial dna mutant. J Biol Chem. 2001;276(6):4020–7. . [DOI] [PubMed] [Google Scholar]
- 37. Dmitrenko V, Shostak K, Boyko O, Khomenko O, Rozumenko V, Malisheva T, et al. Reduction of the transcription level of the mitochondrial genome in human glioblastoma. Cancer Lett. 2005;218(1):99–107. . [DOI] [PubMed] [Google Scholar]
- 38. Piruat JI, Lopez-Barneo J. Oxygen tension regulates mitochondrial DNA-encoded complex I gene expression. J Biol Chem. 2005;280(52):42676–84. . [DOI] [PubMed] [Google Scholar]
- 39. Li Y, D'Aurelio M, Deng JH, Park JS, Manfredi G, Hu P, et al. An assembled complex IV maintains the stability and activity of complex I in mammalian mitochondria. J Biol Chem. 2007. . [DOI] [PubMed] [Google Scholar]
- 40. Dietrich JB, Poirier R, Aunis D, Zwiller J. Cocaine downregulates the expression of the mitochondrial genome in rat brain. Ann N Y Acad Sci. 2004;1025:345–50. . [DOI] [PubMed] [Google Scholar]
- 41. Haut S, Brivet M, Touati G, Rustin P, Lebon S, Garcia-Cazorla A, et al. A deletion in the human QP-C gene causes a complex III deficiency resulting in hypoglycaemia and lactic acidosis. Hum Genet. 2003;113(2):118–22. . [DOI] [PubMed] [Google Scholar]
- 42. Ohta S, Tomura H, Matsuda K, Kagawa Y. Gene structure of the human mitochondrial adenosine triphosphate synthase beta subunit. J Biol Chem. 1988;263(23):11257–62. . [PubMed] [Google Scholar]
- 43. Hsieh SY, Shih TC, Yeh CY, Lin CJ, Chou YY, Lee YS. Comparative proteomic studies on the pathogenesis of human ulcerative colitis. Proteomics. 2006;6(19):5322–31. . [DOI] [PubMed] [Google Scholar]
- 44. Yan WL, Lerner TJ, Haines JL, Gusella JF. Sequence analysis and mapping of a novel human mitochondrial ATP synthase subunit 9 cDNA (ATP5G3). Genomics. 1994;24(2):375–7. . [DOI] [PubMed] [Google Scholar]
- 45. Li HS, Zhang JY, Thompson BS, Deng XY, Ford ME, Wood PG, et al. Rat mitochondrial ATP synthase ATP5G3: cloning and upregulation in pancreas after chronic ethanol feeding. Physiol Genomics. 2001;6(2):91–8. . [DOI] [PubMed] [Google Scholar]
Associated Data
This section collects any data citations, data availability statements, or supplementary materials included in this article.
Data Availability Statement
All relevant data are within the paper.