
Figure 5. Micro-Western Array image and heatmap of abundance and phosphorylation fold changes of signaling proteins in LNCaP 104-R1 cells treated with CAPE.
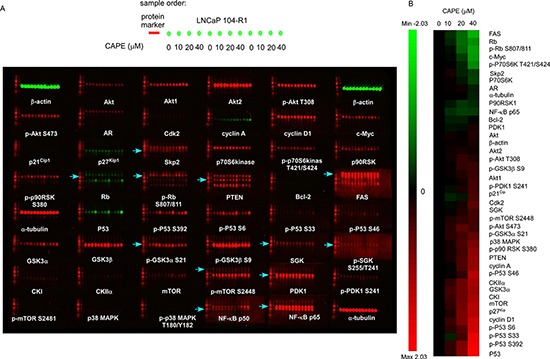
(A) LNCaP 104-R1 cells were treated with 0, 10, 20, 40 μM CAPE for 96 h. Micro-Western Arrays were performed to measure the changes in abundance and modification of total Akt, Akt1, Akt2, phospho-Akt Thr308, phospho-Akt Ser473, AR, Cdk2, cyclin A, cyclin D1, c-Myc, p21Cip1, p27Kip1, Skp2, p70S6 kinase, phospho-p70 S6 kinase Thr421/Ser424, p90RSK, phospho-p90RSK Ser380, Rb, phospho-Rb Ser807/811, PTEN, Bcl-2, fatty acid synthase (FAS), p53, phospho-p53 Ser392, phospho-p53 Ser6, phospho-p53 Ser33, phospho-p53 Ser46, GSK3α, GSK3β, phospho-GSK3α Ser21, phospho-Gsk3β Ser9, SGK, phospho-SGK Ser255/Thr241, CKI, CKIIα, mTOR, phospho-mTOR Ser2448, PDK1, phospho-PDK1 Ser241, phospho-mTOR ser2481, p38 MAPK, phospho-p38 MAPK Thr180/Tyr182, NF-κB p65, and NF-κB p50. Protein abundance of α-tubulin and β-actin was used as loading control. Red color and green color indicated 680 nM and 780 nM wavelength detected by Licor Odyssey scanner for rabbit antibodies and mouse antibodies, respectively. Blue arrows indicated the correct location of band for the detected proteins. (B) Proteins were organized in the y-axis of the heatmap based on time of maximal fold change amplitude. Green color indicated decrease of protein expression while red color indicated increase of protein expression under treatment of CAPE.