

Significance
Carbohydrates hold an unprecedented capacity for altering biological function, but determining which glycans and underlying enzymes are crucial for a specific biological pathway is a major impediment to our understanding of this posttranslational modification. Here we demonstrate that the mRNA target networks of microRNA (miRNA), small noncoding RNA, identify glycosylation enzymes acting as regulatory elements within a biological pathway. Leveraging the miRNA-200 family (miR-200f), regulators of epithelial-to-mesenchymal transition (EMT), we identify multiple promesenchymal glycosylation enzymes. Silencing miR-200f–targeted glycogenes phenocopies the effect of miR-200f, inducing mesenchymal-to-epithelial transition. These enzymes are upregulated in TGF-β–induced EMT, suggesting tight integration within the signaling network. Our work indicates that miRNA networks can be used to identify crucial glycosylation enzymes driving disease states.
Keywords: glycan regulation, epithelial to mesenchymal transition, glycomics, miR-200, TGF-beta
Abstract
Glycosylation, the most abundant posttranslational modification, holds an unprecedented capacity for altering biological function. Our ability to harness glycosylation as a means to control biological systems is hampered by our inability to pinpoint the specific glycans and corresponding biosynthetic enzymes underlying a biological process. Herein we identify glycosylation enzymes acting as regulatory elements within a pathway using microRNA (miRNA) as a proxy. Leveraging the target network of the miRNA-200 family (miR-200f), regulators of epithelial-to-mesenchymal transition (EMT), we pinpoint genes encoding multiple promesenchymal glycosylation enzymes (glycogenes). We focus on three enzymes, beta-1,3-glucosyltransferase (B3GLCT), beta-galactoside alpha-2,3-sialyltransferase 5 (ST3GAL5), and (alpha-N-acetyl-neuraminyl-2,3-beta-galactosyl-1,3)-N-acetylgalactosaminide alpha-2,6-sialyltransferase 5 (ST6GALNAC5), encoding glycans that are difficult to analyze by traditional methods. Silencing these glycogenes phenocopied the effect of miR-200f, inducing mesenchymal-to-epithelial transition. In addition, all three are up-regulated in TGF-β–induced EMT, suggesting tight integration within the EMT-signaling network. Our work indicates that miRNA can act as a relatively simple proxy to decrypt which glycogenes, including those encoding difficult-to-analyze structures (e.g., proteoglycans, glycolipids), are functionally important in a biological pathway, setting the stage for the rapid identification of glycosylation enzymes driving disease states.
Glycosylation is the most abundant posttranslational modification and regulates many biological processes essential to human health (1), as evidenced by the >100 congenital disorders of glycosylation discovered to date (2) and the increasing number of glycosylation-related genes (glycogenes) identified in genomewide association studies in diseases ranging from heart disease (3) to schizophrenia (4). However, pinpointing the glycans and their corresponding biosynthetic enzymes controlling specific biological events is a difficult endeavor for two main reasons: (i) glycans are an analytical challenge because of their structural complexity and the multiplicity of attachment sites, and (ii) glycan biosynthesis requires an intricate pathway with multiple, potentially redundant enzymes (e.g., glycosyltransferases) acting in tandem to create an epitope (5). Decryption of this complex glycocode would unlock new avenues to control biological interactions.
MicroRNAs (miRNAs) are short noncoding RNAs that repress translation or initiate mRNA degradation through binding to the 3′ UTR of mRNAs (6). Recent work by our laboratory has shown miRNAs are major regulators of the glycome (7–9). To date 10 human glycogenes have been validated as miRNA targets in the literature (7, 8). In several of these studies, inhibition of the glycogene recapitulates the biological effects of the miRNA (9–11). MiRNAs regulate networks of genes that work in concert to control biological processes (12, 13). We hypothesize that miRNAs controlling a specific biological pathway can be used as a proxy to identify, through its target network, the functionally relevant glycogenes that modulate that biological process.
The cycling of cells between an epithelial (nonmotile) and mesenchymal (migratory) state (epithelial-to-mesenchymal transition, EMT, and mesenchymal-to-epithelial transition, MET) controls embryogenesis and wound healing. Proper orchestration of cell migration is critical during these events, and aberrant EMT is linked to various pathologies including birth defects, cancer metastasis, and fibrosis (14). MiRNAs are known to play an important role in the regulation of EMT. The miR-200 family (miR-200f) is perhaps the best-characterized miRNA regulator of this process. Levels of mir-200f are high in epithelial cells, low in mesenchymal cells, and regulate expression of Zeb1 (zinc finger E-box binding homeobox 1), a transcription factor that represses E-cadherin (15–17). MiR-200f is regulated by TGF-β, an inducer of EMT (16, 17).
In this work, we leverage the glycogene target network of miR-200f to identify glycosylation enzymes controlling EMT (16, 17). We examine eight glycogenes within the predicted network and validate seven of the eight as targets of miR-200f. We then focus on three genes encoding the difficult-to-study glycans beta-1,3-glucosyltransferase (B3GLCT), beta-galactoside alpha-2,3-sialyltransferase 5 (ST3GAL5), and (alpha-N-acetyl-neuraminyl-2,3-beta-galactosyl-1,3)-N-acetylgalactosaminide alpha-2,6-sialyltransferase 5 (ST6GALNAC5) and show that, as predicted by the network, they act as regulators of the EMT pathway. Overall, our work provides evidence that miRNA networks can be used to identify key glycosylation enzymes within a biological process, suggesting that miRNA may be used as a proxy to crack the functional glycocode.
Results
MiR-200f Targets a Broad Network of Glycogenes.
To identify miR-200f targets, we created a map of miR-200f–glycogene interactions based on conserved and nonconserved miRNA site predictions from miRanda (Fig. 1A) (7). We considered only glycogene targets with an mirSVR score of −0.1 or less, enhancing the probability of target down-regulation upon miRNA binding (18). We further simplified our network by focusing on glycosyltransferases. In constructing our network we included the five known members of the miR-200 family: miR-141, -200a, -200b, -200c, and -429. These can be separated into two groups, miR-141/200a and miR-200b/200c/429, within which the miRNAs have an identical seed region. The two groups differ from each other within their seed regions by only one nucleotide (16). In line with these differences, we observed three clusters of predicted targets, those exclusive to miR-141/200a, those exclusive to miR-200b/200c/429, and those predicted to be targeted by both sets of miRNAs. The predicted glycogene targets were distributed approximately evenly between N-linked, O-linked (i.e., αGalNAc-Ser/Thr), noncanonical O-linked, and glycolipid biosynthetic pathways with some glycosaminoglycan and terminal modifications also represented, indicating that this family controls a diverse range of glycans (Table S1).
Fig. 1.

A broad network of glycogenes is targeted by miR-200f. (A) Network of predicted glycogene targets for miR-200f. Gray lines connect miRNA to predicted glycogene targets (circles). The size of the circle reflects combined miRSVR scores for all miR-200f predictions. Targets tested by luciferase assay are colored-coded as shown in the key in the figure. (B) Graphical representation of luciferase data. Luciferase–3′-UTR reporter constructs were cotransfected with miRNA or scramble mimics (60 nM) in HEK 293T/17 cells. Luciferase signal was assayed 24 h posttransfection. The graphs display average log2 (mimic/scramble). n = 3 biological replicates; *P < 0.005, t test. For wild-type constructs (black bars) displaying a ≥25% decrease (red line), mutants of the appropriate binding region were tested (gray bars; see Table S2). Fig. S1 shows the effect of all five miR-200f members on select constructs. Error bars represent the SD.
Table S1.
Classification of predicted miR-200f target glycogenes according to the type of glycan synthesized (related to Table S3)
| N-linked | O-linked | NC-O–linked | GAGs | Glycolipid | Other/terminal | |
| ALG2 | C1GALT1 | B3GAT1 | B3GALT6 | B3GALT2 | B3GALNT2 | |
| ALG5 | GALNT2 | B3GLCT | CHSY3 | B3GALNT1 | B3GNT1 | |
| ALG6 | GALNT3 | GXYLT1 | HS3ST1 | B3GNT4 | B3GNT2 | |
| ALG8 | GALNT4 | HAS2 | HS3ST3A1 | B3GNT5 | FUT2 | |
| ALG11 | GALNT10 | LARGE | HS6ST2 | B4GALT6 | FUT4 | |
| DDOST | GALNT11 | LFNG | CSGALNACT2 | ST3GAL2 | ||
| MGAT2 | GALNT12 | MGEA5 | GAL3ST1 | ST3GAL3 | ||
| MGAT3 | GALNT14 | OGT | ST3GAL5 | ST8SIA2 | ||
| MGAT4A | GCNT4 | POFUT1 | ST3GAL6 | ST8SIA4 | ||
| MGAT4C | ST6GALNAC3 | |||||
| ST6GALNAC5 | ||||||
| UGCG | ||||||
| Count | 10.0 | 9.0 | 9.0 | 5.0 | 12.0 | 9.0 |
| % total | 18.5 | 16.7 | 16.7 | 9.3 | 22.2 | 16.7 |
miR-200f predicated glycogenes were classified according to the glycan they synthesize using the Kyoto Encyclopedia of Genes and Genomes. The % total represents the distribution of one type of glycan among all predicted targets. GAGs, glycosaminoglycans; NC-O–linked, noncanonical O-linked.
We selected eight targets within the miRNA–glycogene network for validation using a 3′-UTR–luciferase reporter assay (Fig. 1). MiRNA mimics that repressed luciferase expression by ≥25% [log2(mimic/scramble) = −0.42; red line in Fig. 1B] were considered significant inhibitors of the glycogene. miRNA-binding sites were validated by mutagenesis of the seed-binding regions of the 3′-UTR–luciferase constructs (Fig. 1B and Table S2). MiRNA mimics of miR-141, -200c, and -429 gave results similar to those of other members within their group (Fig. S1). Of the eight targets tested, only MGAT2 was not targeted by miR-200f. In addition, two genes predicted to be targets of all family members, B3GLCT and ST3GAL5, were targeted only by miR-200b/200c/429 (Fig. 1B and Fig. S1). Overall, our data confirmed multiple miR-200f–glycogene interactions and identified clear differences in the ability of the two distinct groups of miR-200f members to target glycogenes.
Table S2.
Summary of seed region mutations in 3′ UTRs used in luciferase assay (related to Fig. 1)
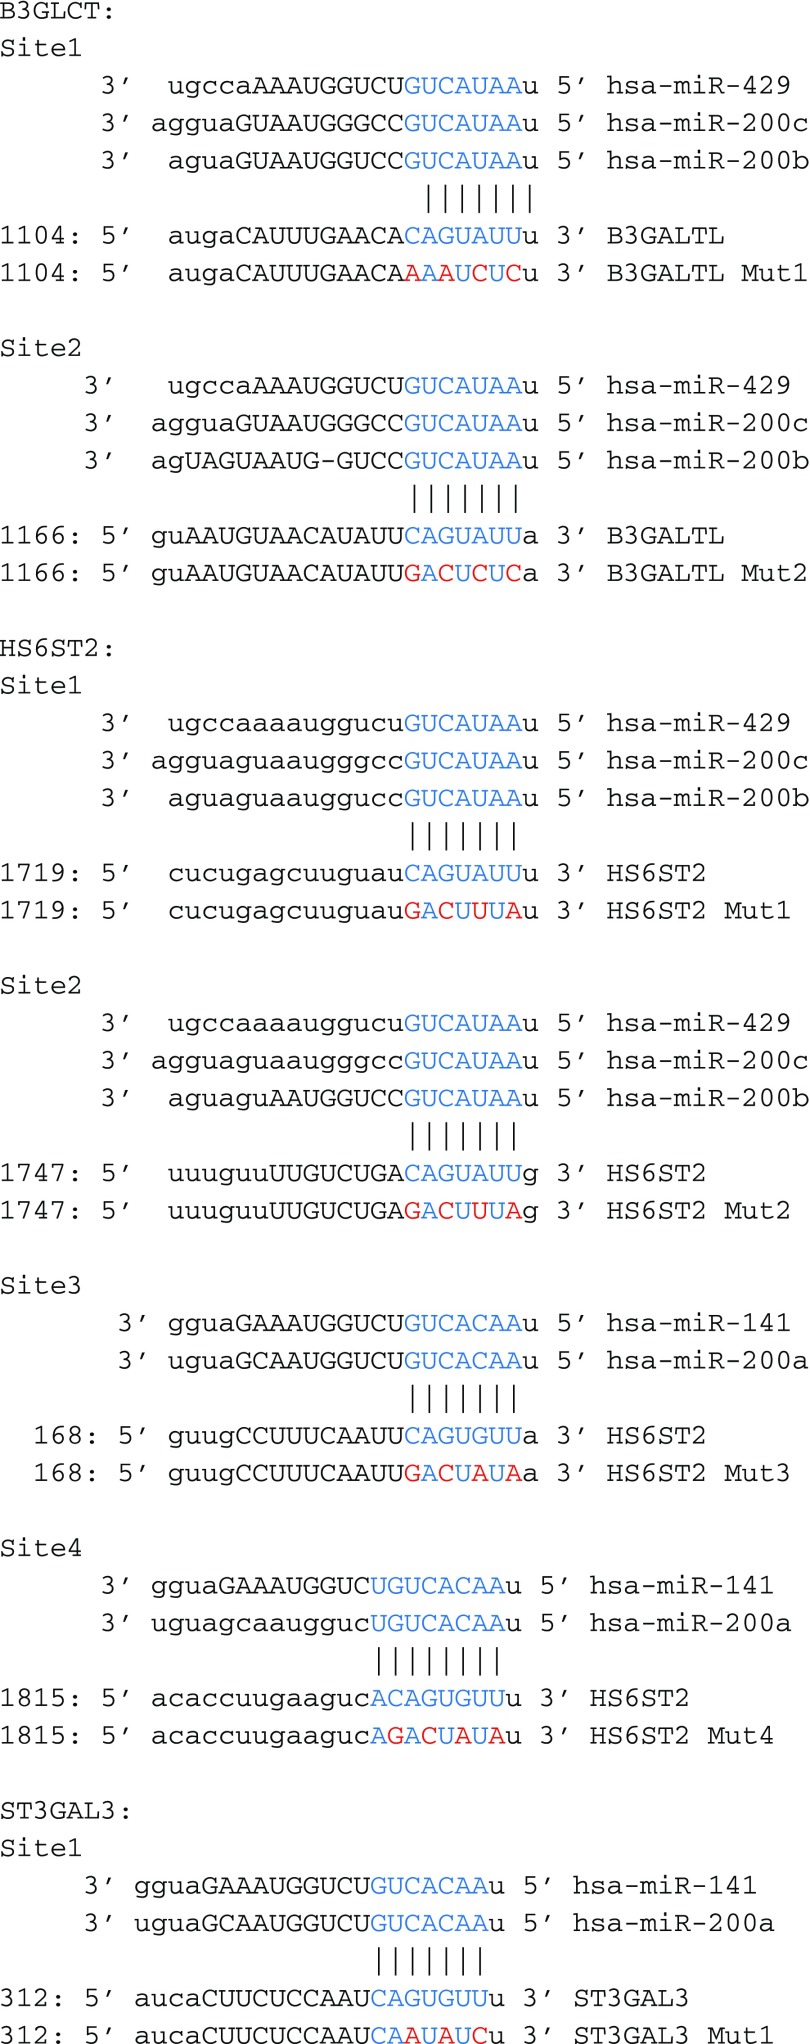 |
Fig. S1.

Members of the two miR-200f groups have similar effects on their targets. Graphical representation of luciferase assays showing the effects of all miR-200f members on B3GLCT, HS6ST2, ST3GAL5, and ST6GALNAC5 3′-UTR constructs. The assays were performed as indicated in Fig. 1. The graphs display average log2 (mimic/scramble). n = 3 biological replicates; *P < 0.005, Student’s t-test. For wild-type constructs (black bars) displaying ≥25% decrease (red line), mutants of the appropriate binding region were tested (gray bars; see Table S2). Error bars represent SD.
MiR-200f Regulates the Glycome in MDA-MB-231 Cells Undergoing MET.
MiR-200f levels are high in epithelial cells, which express high levels of E-cadherin, form tight junctions, and have low motility. Conversely, miR-200f is low in mesenchymal cells, which lose cell–cell contacts and are characterized by low levels of E-cadherin and high motility (16, 17). The highly metastatic breast cancer cell line MDA-MB-231 is considered mesenchymal and is commonly used to examine MET (12, 17). MiR-200f is known to cause MET within this cell line (12, 17, 19). Previous reports have not distinguished clearly between the effects of the two miR-200f groups, often using combinations of miRNAs from both sets. Our luciferase data suggest that the two miR-200f groups have disparate effects on the glycome. Transfection of MDA-MB-231 cells with either miR-200a or -200b mimics induced changes in morphology consistent with MET, but these changes were more apparent in miR-200b–treated cells (Fig. 2A). This observation was confirmed by examination of MET markers. The expected increase in E-cadherin and loss of vimentin and ZEB1 expression were observed in both miRNA treatments but were more pronounced for cells treated with miR-200b mimics (Fig. 2 B and C and Fig. S2A).
Fig. 2.

MiR-200f regulates glycosylation in MDA-MB-231 cells undergoing MET. (A) Representative phase-contrast images of MDA-MB-231 cells treated with scramble, miR-200a, or miR -200b mimics (50 nM, 7 d). The morphology is consistent with the induction of MET by miRNA. (B) Western blot analysis of the EMT markers E-cadherin (epithelial) and vimentin (mesenchymal) from MDA-MB-231 cells treated as in A. Data shown are representative of four biological replicates. (C) Relative abundance of mRNA for the EMT markers E-cadherin and vimentin from MDA-MB-231 cells treated as in A. qRT-PCR data are reported as the average of the relative expression in four biological replicates normalized to GAPDH. Error bars denote SD; *P < 0.005, t test. (D–F) Glycan epitopes biosynthesized by B3GLCT (D), ST3GAL5 (E), and ST6GALNAC5 (F). (G–I) Relative abundance of mRNA encoding B3GLCT, ST3GAL5, and ST6GALNAC5 shows changes in transcript expression with MET. Analysis was on samples from C using the same methods. n = 4; *P < 0.005; **P < 0.02, t test. (J–L) Western blot analysis shows a decrease in B3GLCT (J), ST3GAL5 (K), and ST6GALNAC5 (L) protein levels with MET. Samples from B were used. Representative images from four biological replicates are shown. (M) MDA-MB-231 cells undergoing MET lose GM3. MDA-MB-231 cells were treated as in A, fixed with paraformaldehyde, and stained for GM3 (see SI Experimental Procedures for details). Phase-contrast and fluorescence images representative of two biological replicates (four images per replicate) are shown. Scr, scramble.
Fig. S2.

Effects of miR-200f and glycogene silencing on ZEB1. (A) miR-200b has a more pronounced effect than mir-200a on EMT. MDA-MB-231 cells were treated with scramble, miR-200a, or miR-200b mimics (50 nM, 7 d) and analyzed by qRT-PCR. qRT-PCR data for ZEB1 are reported as the average of relative expression of four biological replicates normalized to GAPDH. Error bars denote SD; *P < 0.005, t test. (B) Effect of glycogene silencing on ZEB1 Levels. Data are from MDA-MB-231 cells treated with control shRNA or shRNAs silencing (KO) B3GLCT, ST3GAL5, or ST6GALNAC5 on day 5 (control, B3GLCT, and ST3GAL5), or day 10 (ST6GALNAC5) after treatment. qRT-PCR data are reported as the average of relative expression of three biological replicates normalized to GAPDH. Error bars denote SD; *P < 0.05.
We next examined the effects of miR-200a or -200b treatment on the expression of predicted mir-200f glycogene targets by quantitative RT-PCR (qRT-PCR) (Table S3). Overall, we found a larger number of predicted glycogenes altered in the miR-200b–treated samples (miR-200a: 8/33; miR-200b: 15/33), indicating that miR-200b has a more profound effect on the glycome in this system. In examining the data, we noticed that none of the glycogenes exclusive to the N-linked pathway was affected significantly by either miRNA. Lectin microarray analysis of miR-200a– and -200b–treated cells showed no changes in N-linked–specific lectin binding (Fig. S3), in line with our mRNA expression (Table S3) and luciferase (Fig. 1B) data. In general, few changes were observed on our lectin microarrays, which have limited analytical capacity for glycolipids, glycosaminoglycans, and noncanonical O-links (i.e., the majority of miR-200f targets). In light of these data, we focused our attention on three specific glycogenes in the miR-200b network from the glycolipid and noncanonical O-linked pathways: B3GLCT, which catalyzes the addition of a glucose to O-fucosylated serines and threonines; ST3GAL5, a sialyltransferase that modifies the glycolipid lactosylceramide to form GM3; and ST6GALNAC5, which transfers a sialic acid to the N-acetylgalactosamine on the glycolipid GM1b to form GD1α (Fig. 2 D–F, respectively) (20).
Table S3.
miR-200f target glycogene transcript expression profile in MDA-MB-231 cells treated with miR-200a, miR-200b, or scramble mimics
| miR-200a treatment | miR-200b treatment | Glycan type | ||||
| Glycogene | Fold change | P value | Glycogene | Fold change | P value | |
| Shared predicted targets | ||||||
| MGAT4A | 1.06 | 0.74 | MGAT4A | 1.17 | 0.31 | N-linked |
| C1GALT1 | −1.19 | 0.050 | C1GALT1 | −1.10 | 0.40 | O-linked |
| GALNT14 | −1.49 | 0.011 | GALNT14 | −1.94 | 0.0059 | |
| *B3GLCT | −1.06 | 0.69 | *B3GLCT | −1.61 | 0.0042 | NC O-linked |
| *ST3GAL5 | −1.61 | 0.0064 | *ST3GAL5 | −2.13 | 2.1E-0.4 | Glycolipid |
| ST6GALNAC3 | 1.62 | 0.20 | ST6GALNAC3 | 1.11 | 0.76 | |
| B3GNT2 | 1.07 | 0.66 | B3GNT2 | 1.22 | 0.15 | Other/terminal |
| miR-200b/-200c/-429 predicted targets | ||||||
| *MGAT2 | −1.08 | 0.72 | *MGAT2 | 1.01 | 0.98 | N-linked |
| MGAT3 | −1.86 | 0.12 | MGAT3 | 1.30 | 0.15 | |
| MGAT4C | 1.93 | 0.20 | MGAT4C | −1.00 | 1.00 | |
| GALNT2 | −1.09 | 0.52 | GALNT2 | −1.40 | 0.022 | O-linked |
| GALNT3 | 1.03 | 0.71 | GALNT3 | 2.30 | 4.5E-0.4 | |
| GALNT10 | −1.14 | 0.11 | GALNT10 | −1.68 | 0.0012 | |
| GALNT11 | −1.11 | 0.29 | GALNT11 | −1.26 | 0.011 | |
| GALNT12 | −1.40 | 0.0074 | GALNT12 | −1.52 | 0.0063 | |
| GCNT4 | −1.18 | 0.16 | GCNT4 | −1.05 | 0.79 | |
| LFNG | −1.49 | 0.21 | LFNG | −2.14 | 0.074 | NC O-linked |
| MGEA5 | −1.06 | 0.58 | MGEA5 | 1.02 | 0.71 | |
| CHSY3 | 1.15 | 0.36 | CHSY3 | −1.04 | 0.68 | GAGs |
| HS3ST1 | 1.99 | 0.044 | HS3ST1 | 3.28 | 0.014 | |
| HS3ST3A1 | −1.11 | 0.74 | HS3ST3A1 | −1.24 | 0.39 | |
| B3GALNT1 | −1.11 | 0.56 | B3GALNT1 | −1.16 | 0.46 | Glycolipid |
| *ST6GALNAC5 | 2.23 | 0.033 | *ST6GALNAC5 | 4.79 | 0.010 | |
| B3GNT1 | −1.04 | 0.80 | B3GNT1 | −1.47 | 0.039 | Other/terminal |
| ST3GAL2 | −1.18 | 0.20 | ST3GAL2 | −1.59 | 0.0012 | |
| ST8SIA4 | −1.23 | 0.013 | ST8SIA4 | −1.15 | 0.22 | |
| miR-200a/141 predicted targets | ||||||
| GALNT4 | −1.16 | 0.20 | GALNT4 | −1.17 | 0.077 | O-linked |
| POFUT1 | −1.00 | 0.98 | POFUT1 | −1.01 | 0.90 | NC O-linked |
| B3GALT6 | 1.05 | 0.83 | B3GALT6 | 1.00 | 0.99 | GAGs |
| B3GNT4 | 1.29 | 0.075 | B3GNT4 | 2.24 | 6.4E-04 | Glycolipid |
| B3GNT5 | 1.25 | 0.11 | B3GNT5 | 1.70 | 0.0026 | |
| *ST3GAL6 | −1.18 | 0.30 | *ST3GAL6 | 1.01 | 0.91 | |
| *ST3GAL3 | −1.42 | 0.051 | *ST3GAL3 | −1.43 | 0.035 | Other/terminal |
MDA-MB-231 cells were treated with miR-200a, miR-200b, or scramble mimics (50 nM) for 7 d. qRT-PCR was performed using RT2 Profiler PCR Array Human Glycosylation (Qiagen) or custom primers for genes not represented on the array (Dataset S1). Fold change (miR-treated/scramble) was calculated by taking the average relative expression of miR-treated samples (n = 4 independent experiments, normalized to GAPDH) over the average relative expression of the scramble-treated cells (n = 4 independent experiments, normalized to GAPDH). Where the fold change was less than 1, the negative inverse is shown. P values for treated vs. scramble were calculated using Student's t-test. Statistically significant (P ≤ 0.05) down-regulation is in bold; up-regulation is underlined. GAGs, glycosaminoglycans; NC O-linked, noncanonical O-linked; See Table S1 for glycan type distribution.
Genes for which luciferase data were obtained (Fig. 1).
Fig. S3.

Glycomic analysis of MDA-MB-231 cells treated with miR-200f. Lectin microarray analysis of MDA-MB-231 cells treated as in Fig. 2A. In brief, equal amounts of Cy5-sample (S) and Cy3-reference (R) were analyzed on the lectin microarray. The heat map shows the median-normalized log2 ratios (S/R). Hierarchical clustering used the centered Pearson correlation coefficient as the distance metric and average linkage analysis (n = 77 lectins). Red, log2(S/R) > log2(Smedian/Rmedian); green, log2(Smedian/Rmedian) > log2(S/R). A yellow box indicates lectins that are significantly different between miR-200f and scramble treatment (P < 0.05, t test, n = 3). Lectins specific to N-linked glycans are denoted in blue. Table S1 shows miR-200f glycogene target classification based on glycan type. Dataset S1 shows the printlist for the microarray.
Our candidate genes were chosen for three reasons: (i) all three displayed >40% down-regulation by miR-200b in our luciferase assays (Fig. 1B); (ii) all three were associated with human disease (3, 21–24); (iii) all three glycogenes showed significant changes in mRNA expression levels in miR-200b–treated MDA-MB-231 cells undergoing miRNA-induced MET (P ≤ 0.01) (Table S3). Unlike B3GLCT and ST3GAL5, the expression of ST6GALNAC5 mRNA increased in the miR-200b–treated samples (Fig. 2 G–I). This finding is in contrast to both the luciferase data for the ST6GALNAC5 3′-UTR construct (Fig. 1B) and protein expression levels, which were repressed for all three enzymes by miR-200b (Fig. 2 J–L). It is common for miRNA to repress translation in the absence of an mRNA degradation effect (6), as is observed here for ST6GALNAC5. To determine whether glycans synthesized by these glycogenes were down-regulated by miR-200b, we used fluorescence microscopy to examine the levels of GM3, the glycolipid product of ST3GAL5 (Fig. 2E), in response to miR-200b treatment (Fig. 2M). We observed a clear loss of anti-GM3 antibody staining for miR-200b–treated MDA-MB-231 cells, as would be expected. Taken together, our data show that miR-200f alters the glycome by targeting glycogenes in MDA-MB-231 cells undergoing miRNA-induced MET.
Silencing B3GLCT, ST3GAL5, or ST6GALNAC5 Phenocopies the Effects of miR-200b in MDA-MB-231 Cells.
To examine whether glycogenes targeted by miR-200b are directly involved in EMT, we silenced B3GLCT, ST3GAL5, or ST6GALNAC5 in MDA-MB-231 cells using shRNA. If these genes are involved in the EMT pathway, silencing them should phenocopy the effects of miR-200b, driving MET forward in the mesenchymal cell line. Morphological changes indicative of MET were observed as early as 5 d following lentiviral vector transduction and selection for shRNA-expressing cells (Fig. 3A). We evaluated E-cadherin expression in B3GLCT- and ST3GAL5-silenced cells at day 5 and, because of slower growth rates, in ST6GALNAC5-silenced cells at day 10 (Fig. 3 and Fig. S4). Gene silencing resulted in increased expression of E-cadherin at both the protein and transcript levels, in line with the observed morphological changes. ZEB1 levels also were increased in all three knockdowns, indicating that the increase in E-cadherin is not caused by repression of this transcriptional regulator (Fig. S2B).
Fig. 3.

Silencing B3GLCT, ST3GAL5, or ST6GALNAC5 phenocopies miR-200b, inducing MET in MDA-MB-231 cells. (A) Representative phase-contrast images of MDA-MB-231 cells treated with control shRNA or shRNAs silencing (KO) B3GLCT, ST3GAL5, or ST6GALNAC5. Images were acquired on day 5 (control, B3GLCT, ST3GAL5) or day 10 (ST6GALNAC5) after treatment. Fig. S4 shows day 10 images for control and expanded fields of view for the images shown. Images are representative of a minimum of three biological replicates with three fields of view per experiment. (B, D, and F) qRT-PCR analysis of MDA-MB-231 cells treated as in A. Glycogene mRNA confirms shRNA silencing (KO) compared with control for B3GLCT (B), ST3GAL5 (D), and ST6GALNAC5 (F) and an increase in E-cadherin mRNA. qRT-PCR data are reported as the average relative expression of four (B3GLCT, ST3GAL5) or three (ST6GALNAC5) biological replicates normalized to GAPDH. Error bars denote SD; *P < 0.002; **P < 0.02; t test. (C, E, and G) Western blot analysis shows an increase in E-cadherin levels induced by shRNA silencing of B3GLCT (C), ST3GAL5 (E), or ST6GALNAC5 (G). Western blot samples were collected on day 5 (B3GLCT) or day 10 (ST3GAL5 and ST6GALNAC5). Representative blots from three (ST3GAL5 and ST6GALNAC5) or four (B3GLCT) biological replicates are shown.
Fig. S4.

Effect of glycogene silencing on MDA-MB-231 morphology. (A) Representative phase-contrast images of MDA-MB-231 cells treated with control or shRNA against ST6GALNAC5 on day 10 posttreatment. (B) Original uncropped images corresponding to those shown in Fig. 3A. Yellow boxes indicate regions selected for Fig. 3A.
MiR-200f regulates not only the morphology but also the migratory capacity of cells (12, 19). Previous studies have shown that miR-200f expression in MDA-MB-231 cells inhibits the migration of this cell line in wound-healing assays (12, 19). To test whether silencing B3GLCT, ST3GAL5, or ST6GALNAC5 mimics the effects of miR-200b on the migratory capacity of MDA-MB-231 cells, we performed in vitro scratch assays (25). Migration was evaluated after 24 h, which is less than the doubling time of MDA-MB-231 cells (26). As expected, transfection of MDA-MB-231 cells with miR-200b mimics inhibited gap closure in the scratch assay as compared with a scrambled control (46% of control, P = 0.01) (Fig. 4 A and B). Silencing of B3GLCT, ST3GAL5, or ST6GALNAC5 recapitulated the inhibition of migration observed with miR-200b (P < 0.001 for B3GLCT and ST6GALNAC5; P = 0.02 for ST3GAL5) (Fig. 4 C and D). The strongest effect was observed in the B3GLCT knockdown (20% of control). Migration was reduced to 38% of control in ST6GALNAC5-silenced cells and to 67% of control in ST3GAL5-silenced cells. Thus, silencing glycogenes targeted by miR-200b phenocopies the effects of the miRNA, suggesting that miR-200f regulates glycosylation enzymes that are important components of the biological pathways it controls.
Fig. 4.

Silencing B3GLCT, ST3GAL5, or ST6GALNAC5 phenocopies miR-200b, inhibiting migration in scratch assays. (A) Representative phase-contrast images show reduced migration of MDA-MB-231 cells treated with miR-200b mimic (50 nM). Scrambled mimic (Scramble) served as control. Scratches were made with a P200 tip on plates at 100% confluency 6 d posttransfection and were imaged (0 h). The identical region was imaged 24 h later to determine the extent of wound healing. Images are representative of three biological replicates. (B) Graphical representation of the percent of closure in the experiments in A. Images were analyzed in ImageJ, and the wound area was calculated for 0 h and 24 h postscratch. Graphs show the average percent of closure for the three biological replicates. Error bars denote SD; **P < 0.05; t test. (C) Representative phase-contrast images show reduced migration of cells treated with shRNAs silencing (KO) B3GLCT, ST3GAL5, or ST6GALNAC5. Scratches were made with a P200 tip on plates at 100% confluency 5 d post shRNA treatment (glycogene or control) and were imaged (0 h). The identical region was imaged 24 h later to determine the extent of wound healing. Images are representative of three biological replicates. (D) Graphical representation of the percent of closure for the experiments in C. Images were analyzed as in B. Graphs show the average percent of closure for three biological replicates. Error bars denote SD; *P < 0.001, **P < 0.05; t test.
TGF-β1 Induces Both EMT and Increased Protein Expression of B3GLCT, ST3GAL5, and ST6GALNAC5 in A549 Cells.
We tested whether B3GLCT, ST3GAL5, and ST6GALNAC5 were involved in the more complex EMT networks induced by a natural stimulus of EMT, TGF-β1. TGF-β1 is a cytokine known to induce EMT, in part through up-regulation of the transcription factor Zeb1, a repressor of both miR-200f and E-cadherin (16, 27). We examined the effects of TGF-β1 on A549 cells, a human nonsmall cell lung carcinoma line that has been used previously to study TGF-β1–induced EMT (28). In brief, cells were treated with TGF-β1 (5 ng/mL) for 48 h. Changes in morphology consistent with EMT could be observed as soon as 24 h after treatment. By 48 h, the majority of cells displayed the spindle-shaped morphology characteristic of a mesenchymal phenotype (Fig. 5A). Analysis of E-cadherin, fibronectin (a mesenchymal marker), vimentin, and Zeb1 by qRT-PCR in these cells confirmed the induction of EMT (Fig. 5B). We analyzed the expression of B3GLCT, ST3GAL5, and ST6GALNAC5 transcripts in these cells (Fig. 5C). Because of the very low expression levels of the ST6GALNAC5 mRNA, we were not able to determine changes in this transcript by qRT-PCR. Both B3GLCT and ST3GAL5 showed significant increases in expression (3.5-fold and 1.5-fold, respectively) compared with untreated cells. We observed increases in protein expression levels consistent with the changes in glycogene mRNA (Fig. 5D). By loading threefold more protein than was used in the Western blot analysis of B3GLCT and ST3GAL5, we were able to observe an increase in ST6GALNAC5 protein expression because of TGF-β1–induced EMT. Overall our results suggest that glycogenes targeted by miR-200b are promesenchymal genes that are part of the broader EMT-signaling network induced by TGF-β1.
Fig. 5.

TGF-β1 induces both EMT and increased protein expression of B3GLCT, ST3GAL5, and ST6GALNAC5 in A549 cells. (A) Representative phase-contrast images of A549 cells undergoing EMT induced by treatment with TGF-β1 (5 ng/mL, 48 h). Vehicle-treated cells (Veh) are shown as a control. (B) Relative abundance of mRNA encoding the EMT markers E-cadherin, fibronectin, vimentin, and Zeb1 in A549 cells treated as in A. qRT-PCR data are reported as the average of relative expression normalized to GAPDH. Error bars denote SD; *P < 0.005; t test; n = 3 biological replicates. (C) Relative abundance of mRNA encoding glycogenes B3GLCT and ST3GAL5 in the samples used in B. qRT-PCR data are reported as the average of relative expression normalized to GAPDH. Error bars denote SD; *P < 0.002; **P < 0.01; t test; n = 3 biological replicates. (D) Western blot data for samples used in B and C show a decrease in E-cadherin and a concomitant increase of B3GLCT, ST3GAL5, and ST6GALNAC5 protein levels. To visualize ST6GALNAC5, threefold-higher sample levels (60 μg protein) were evaluated. Representative data from the three biological replicates are shown.
SI Experimental Procedures
GM3 Staining.
MDA-MB-231 cells were transfected with miRNA mimics as previously described. After the second transfection (72 h after the initial treatment), cells were split into glass-bottomed dishes (35 × 20 mm; In Vitro Scientific) coated with gelatin (0.8 µL/cm2, 2% gelatin solution; Sigma Aldrich) and cultured for an additional 3 d. Cells then were fixed in 4% (wt/vol) paraformaldehyde in HBSS (10 min, room temperature) and incubated with α-GM3 antibody (1:100 vol/vol in HBSS, 1 h, 37 °C) (clone M2590; Cosmo Bio Co, Ltd.), followed by α-mouse–Alexa Fluor-647 (1:100 vol/vol in PBS solution, 30 min, 37 °C) (Invitrogen) in the dark. Samples were imaged by fluorescence microscopy (60× PlanFluor objective, NA 0.3, excitation/emission, 625–650 nm/670 nm, Eclipse TE 2000-U; Nikon). All fluorescence images within an experiment were acquired under identical conditions.
Lectin Microarray.
MDA-MB-231 cells were treated with miRNA 200a, -200b, or scramble mimics for 7 d as previously described. Cell sample preparation and lectin microarray analysis then were conducted as previously described (45). Briefly, cell membrane samples were prepared and labeled with NHS-Cy5. Reference was prepared by mixing equal amounts (by protein) of membrane samples from MDA-MB-231 cells treated with scramble, mir-200a, or mir-200b before labeling with NHS-Cy3. Lectins were purchased from E. Y. Laboratories or Vector Laboratories with the following exceptions: recombinant cyanovirin, scytovirin, and griffithsin were gifts from B. O’Keefe (Frederick National Laboratory for Cancer Research, Frederick, MD); recombinant Gaf-D, PA-IL, PA-IIL, and RS-IIL were made as previously described (46); TJA-I and TJA-II were from NorthStar Bioproducts; and PA-I was from Sigma Aldrich. Antibodies were purchased from Santa Cruz Biotechnology (SPM110, P12, 7LE), R&D Systems (Lewis x), and Abcam (F3). Dataset S1 summarizes the printlist. Printing, hybridization, and data analysis were performed as previously described (47). Our data were distributed normally as determined by the Lilliefors test. Lectins were excluded from analysis if they did not meet our minimal threshold for activity (48).
Discussion
Glycosylation can impact many aspects of the cell, from cell adhesion to receptor clustering and activation (Fig. 6). For example, glycosylation of E-cadherin, fibronectin, and other EMT-associated glycoproteins governs their roles in adhesion and motility, altering their stability and protein-interaction networks (29–31). A single glycosylation enzyme can regulate multiple components of a biological pathway, exerting a synergistic effect. Current approaches to identifying functionally relevant glycans are focused on glycan analysis to identify glycans that alter in disease and on glycogene profiling to identify changes in mRNA that correlate with disease states. These approaches have several limitations. (i) High-throughput analysis of glycans typically is not comprehensive (5). The great majority of studies on glycans in disease focus on only the N-linked glycome. Glycolipids, O-linked glycans, and glycosaminoglycans often are ignored because of difficulties in sample preparation and annotation in mass spectrometry and a lack of specific binding reagents. (ii) Glycogene transcripts often are at the limits of detection, where quantitation is inaccurate, complicating mRNA profiling (32, 33). (iii) The multiple glycosylation enzymes with overlapping catalytic specificities present a challenge in mapping changes in glycan structure to changes in specific enzyme levels (34). (iv) It is not clear that all changes in glycosylation correlating with a disease state or biological process are relevant. Some alterations may be bystanders of the expression of other functionally relevant glycans (35). Identifying the parts of the glycocode that are meaningful in terms of biological function in a specific system is more complex than simply identifying changes in glycosylation.
Fig. 6.

The MiR-200 family regulates a network of glycogenes altering glycosylation crucial to processes involved in EMT. Glycogenes inhibited when miR-200f levels are high (Left, green arrow, red glycogenes) and promoted by loss of miR-200f (Right, red arrow, green glycogenes) alter glycosylation in multiple contexts including receptor signaling (36), protein secretion (40), and cell-adhesion networks (29–31).
In this work we demonstrate a previously undescribed strategy for decrypting the functional glycocode that leverages miRNA as a proxy for identifying glycosylation enzymes that are important for a specific biological process, EMT (Fig. 6). By leveraging miR-200f target networks (Fig. 1), we identified a set of relevant glycogenes from the cohort that biosynthesize glycans ignored in typical glycan analysis. MiR-200f strongly impacted glycogenes controlling glycolipid, glycosaminoglycan, and O-linked glycan biosynthesis (Table S3), which comprise 65% of predicted targets (Table S1), rather than the N-linked–associated glycogenes that are the focus of most research. Our miRNA strategy bypasses the analytical constraints attached to glycolipids, glycosaminoglycans, and O-linked glycans to identify specific glycosylation enzymes and, by extension, the epitopes they biosynthesize as modulators of the EMT pathway.
From the broader miR-200f network, we focused our studies on three targets: B3GLCT, ST6GALNAC5, and ST3GAL5, which biosynthesize noncanonical O-linked glycans and glycolipids (Fig. 2 D–F). Knocking down any of these three glycogenes phenocopied the known effects of miR-200f, reversing the mesenchymal phenotype, increasing E-cadherin, and slowing cell migration. These effects were not mediated by the transcription factor Zeb1, indicating that these glycans affect protein expression and/or stabilization of E-cadherin independent of the transcriptional repressor. Induction of EMT by TGF-β1 increased the expression of all three glycosylation enzymes. This finding is in line with the known function of TGF-β, which inhibits mir-200f. Taken together, our data demonstrate that miR-200f controls glycosylation enzymes that are functionally relevant to EMT and that miRNA can be used as a proxy to place these enzymes into biological context.
Placing glycogenes into context within specific pathways using miRNA as a predictor may offer insight into the roles of glycosylation in human disease. MiR-200f is a regulatory component of the TGF-β EMT-signaling pathway, implying that B3GLCT, ST6GALNAC5, and ST3GAL5 also are components of that pathway. Increased levels of the glycolipid GM3, the product of ST3GAL5, have been shown to promote the dimerization and activation of TGF-β receptors (36). However, B3GLCT and ST6GALNAC5 are not known to be involved in EMT. Mutations that compromise the enzymatic activity of B3GLCT, the β1,3-glucosyltranferase previously annotated as B3GALTL, are the underlying cause of Peter's Plus syndrome (21), a congenital disorder characterized by malformation of the eye (Peter's anomaly), short stature, and craniofacial features commonly including cleft palate (37). TGF-β–induced EMT plays a predominant role in both the formation of the eye (38) and the closure of the palate during embryonic development (39), and recent work has implicated B3GLCT in the secretion of thrombospondin-1, a protein involved in TGF-β activation (40). Taken together, this report and our data suggest that Peter's Plus is a TGF-β–related EMT-disruption syndrome, similar to other congenital disorders with TGF-β–related mechanisms (41). Coronary artery disease (CAD) caused by activating mutations in ST6GALNAC5 (3) also may be related to TGF-β–induced EMT. CAD has been linked to higher TGF-β levels (42) and fibrosis, an EMT process (43). Thus, higher ST6GALNAC5 activity may promote TGF-β signaling, causing CAD. If these rare genetic mutations do impact TGF-β networks, drugs that target TGF-β signaling potentially could help patients with these syndromes, effectively deorphanizing these diseases by placing them in the larger context of TGF-β–related disorders.
Identifying functionally relevant glycosylation enzymes opens new avenues for therapeutics for virtually any disease (1). Glycosylation enzymes are overlooked as druggable targets because of the difficulties in pinpointing the critical enzymes in a disease state (34, 35, 44). However, glycans play a role in every major disease (1), and there are clinical examples of drugs targeting glycosylation enzymes [Zavesca in Gaucher's disease (44), zanamivir (Relenza) and oseltamivir (Tamiflu) in influenza (35), and migalastat in Fabry's disease (44)], suggesting that glycosylation enzymes may provide fallow ground for drug development. Multiple biological pathways governed by different miRNA often are involved in disease processes. Our approach enables these miRNA networks to be leveraged to yield the most critical enzymes to target in a disease state. Taking advantage of this concept will require a better map of glycogene–miRNA interactions (8). By using miRNA as a relatively simple proxy to decrypt which glycogenes, including encoding difficult-to-analyze structures (e.g., proteoglycans, glycolipids), are important in specific biological states, this work provides a decryption key for the functional glycocode.
Experimental Procedures
Glycogene Target Analysis of miR-200f.
Identification and visualization of miR-200f glycogene targets and construction of the regulatory network was performed as previously described (7) with the following exception: Only glycosyltransferases with an mirSVR score of −0.1 or less were considered (18).
Luciferase Reporter Assay.
Luciferase reporter assays were performed as previously described using pLightSwitch-MT vector constructs (SwitchGear Genomics) (8). Plasmids containing glycogene 3′ UTRs were obtained from SwitchGear Genomics (B3GLCT) or were cloned from cDNA using standard methods. Dataset S1 shows the primers and sequenced 3′ UTRs.
Cell Culture and TGF-β1 Treatment.
The MDA-MB-231 and A549 cell lines (Division of Cancer Treatment and Diagnosis Tumor Repository, National Cancer Institute) were grown in RPMI-1640 medium (Lonza) supplemented with 10% (vol/vol) FBS (Innovative Research) and 2 mM l-glutamine (Lonza) at 37 °C in 5% CO2. For TGF-β1 treatment, A549 cells were was seeded at a density of 500,000 cells in a 10-cm dish; 24 h later the medium was replaced with reduced FBS (5%) growth medium supplemented with 5 ng/mL human recombinant TGF-β1 (R&D; 240-B-002) or vehicle, and cells were cultured for additional 48 h.
Transfection of miRNA Mimics in MDA-MB-231 Cells.
MDA-MB-231 cells were seeded in six-well plates (80,000 cells per well), cultured for 24 h, and transfected with miRNA mimics (50 nM) using Lipofectamine 2000 (Life Technologies). Cells were transfected again 72 h after the initial treatment and 6–12 h later were split into 2 × 60 mm dishes. Samples were harvested for protein or RNA extraction on day 7 posttransfection.
Western Blotting.
Lysates from cells lysed in cold RIPA buffer supplemented with protease inhibitors were subjected to standard Western Blot protocols (8). The primary antibodies were α-GAPDH (glyceraldehyde-3-phosphate dehydrogenase; 1:10,000), α-E-cadherin (1:1,000), α-ST6GALNAC5 (1:1,000), and α-Vimentin (1:10,000) from Abcam and α-B3GLCT (B3GALTL, 1:1,000) and α-ST3GAL5 (1:1,000) from Novus Biologicals. Secondary antibodies [α-mouse-HRP (GAPDH) or α-rabbit-HRP (all others) (Bio-Rad)] were used at 1:5,000. Blots were developed using SuperSignal West Pico (Thermo Scientific).
RNA Extraction and Real-Time qPCR.
Total RNA was extracted from samples as previously described (8). Glycogene profiling summarized in Tables S3 and S4 was obtained by using RT2 Profiler PCR Array Human Glycosylation (Qiagen) and Power SYBR Green (Life Technologies) using the manufacturers’ protocols. Additional primers were designed using PrimerSelect or NCBI primer blast and were purchased from Integrated DNA Technologies (Dataset S1). All cycle threshold values (Ct) were obtained by using the LightCycler Roche 480 Second Derivative Max algorithm.
Table S4.
Expression profile of glycogenes not predicted to be targets of the miR-200 family in MDA-MB-231 cells treated with miR-200a, miR-200b, or scramble mimics
| miR-200a treatment | miR-200b treatment | ||||
| Glycogene | Fold change | P value | Glycogene | Fold change | P value |
| A4GNT | −1.41 | 7.2E-03 | A4GNT | −1.81 | 1.1E-03 |
| AGA | −1.37 | 2.5E-03 | AGA | −1.17 | 0.24 |
| B3GNT3 | 13.51 | 5.8E-06 | B3GNT3 | 67.80 | 1.4E-05 |
| B3GNT8 | −1.14 | 0.42 | B3GNT8 | 1.01 | 0.95 |
| B4GALT1 | −1.17 | 0.20 | B4GALT1 | −1.15 | 0.16 |
| B4GALT2 | 1.01 | 0.97 | B4GALT2 | −1.02 | 0.92 |
| B4GALT3 | 1.21 | 0.43 | B4GALT3 | 1.32 | 0.19 |
| B4GALT5 | 1.11 | 0.62 | B4GALT5 | 1.61 | 2.1E-02 |
| C1GALT1C1 | −1.01 | 0.94 | C1GALT1C1 | 1.02 | 0.80 |
| EDEM1 | −1.07 | 0.59 | EDEM1 | −1.05 | 0.65 |
| EDEM2 | −1.06 | 0.60 | EDEM2 | 1.04 | 0.66 |
| EDEM3 | 1.02 | 0.79 | EDEM3 | −1.10 | 0.23 |
| FUCA1 | −1.09 | 0.31 | FUCA1 | −1.12 | 0.19 |
| FUCA2 | −1.09 | 0.24 | FUCA2 | −1.03 | 0.61 |
| FUT8 | 1.20 | 0.19 | FUT8 | −1.07 | 0.45 |
| FUT11 | 1.03 | 0.79 | FUT11 | 1.28 | 0.12 |
| GALNT1 | 1.15 | 0.29 | GALNT1 | −1.12 | 0.30 |
| GALNT6 | 2.14 | 3.7E-04 | GALNT6 | 1.79 | 9.9E-05 |
| GALNT7 | −1.07 | 0.60 | GALNT7 | −1.09 | 0.39 |
| GALNT8 | −1.69 | 0.21 | GALNT8 | −2.07 | 0.18 |
| GALNT9 | −2.19 | 0.12 | GALNT9 | −1.90 | 0.17 |
| GALNT13 | −1.16 | 2.4E-02 | GALNT13 | 1.03 | 0.63 |
| GALNTL1 | −1.61 | 1.3E-02 | GALNTL1 | −2.02 | 3.3E-03 |
| GALNTL5 | 1.41 | 0.69 | GALNTL5 | 1.08 | 0.94 |
| GALNTL6 | −2.06 | 0.12 | GALNTL6 | −3.08 | 4.8E-02 |
| GANAB | −1.01 | 0.92 | GANAB | −1.02 | 0.80 |
| GCNT1 | −1.61 | 8.1E-05 | GCNT1 | −1.63 | 4.0E-03 |
| GCNT3 | −1.18 | 0.35 | GCNT3 | 1.49 | 0.23 |
| GLB1 | −1.06 | 0.73 | GLB1 | −1.17 | 0.26 |
| GNPTAB | −1.15 | 0.19 | GNPTAB | −1.03 | 0.84 |
| GNPTG | −1.15 | 0.26 | GNPTG | −1.13 | 0.22 |
| HEXA | −1.11 | 0.36 | HEXA | −1.14 | 9.1E-02 |
| HEXB | −1.13 | 0.24 | HEXB | −1.17 | 0.11 |
| MAN1A1 | 1.09 | 0.54 | MAN1A1 | −1.14 | 0.45 |
| MAN1A2 | 1.02 | 0.88 | MAN1A2 | −1.15 | 0.25 |
| MAN1B1 | −1.06 | 0.56 | MAN1B1 | −1.08 | 0.41 |
| MAN1C1 | −1.07 | 0.76 | MAN1C1 | −1.39 | 3.9E-02 |
| MAN2A1 | −1.06 | 0.23 | MAN2A1 | 1.13 | 0.23 |
| MAN2A2 | 1.24 | 0.41 | MAN2A2 | 1.43 | 0.12 |
| MAN2B1 | 1.04 | 0.89 | MAN2B1 | 1.01 | 0.97 |
| MANBA | −1.21 | 5.5E-04 | MANBA | −1.22 | 1.5E-02 |
| MGAT1 | 1.18 | 0.36 | MGAT1 | 1.37 | 1.9E-02 |
| MGAT4B | 1.13 | 0.39 | MGAT4B | 1.13 | 0.17 |
| MGAT5 | 1.27 | 0.32 | MGAT5 | 1.31 | 0.25 |
| MGAT5B | −1.29 | 0.15 | MGAT5B | −2.24 | 3.7E-03 |
| MOGS | 1.10 | 0.63 | MOGS | 1.32 | 9.2E-02 |
| NAGPA | −1.33 | 0.32 | NAGPA | −1.40 | 0.20 |
| NEU1 | −1.08 | 0.63 | NEU1 | 1.25 | 0.10 |
| NEU2 | 1.43 | 0.24 | NEU2 | 1.62 | 3.2E-02 |
| NEU3 | −1.05 | 0.63 | NEU3 | 1.24 | 7.4E-02 |
| NEU4 | −1.35 | 0.51 | NEU4 | −1.63 | 0.36 |
| OGT | −1.09 | 0.50 | OGT | −1.02 | 0.88 |
| POFUT2 | −1.14 | 0.18 | POFUT2 | −1.25 | 1.4E-02 |
| POMGNT1 | 1.06 | 0.71 | POMGNT1 | −1.05 | 0.59 |
| POMT1 | −1.18 | 0.33 | POMT1 | −1.07 | 0.61 |
| POMT2 | 1.07 | 0.66 | POMT2 | 1.02 | 0.85 |
| PRKCSH | 1.02 | 0.86 | PRKCSH | 1.07 | 0.39 |
| ST3GAL1 | 1.19 | 5.6E-02 | ST3GAL1 | 1.21 | 2.7E-02 |
| ST6GAL1 | −1.60 | 8.5E-03 | ST6GAL1 | −2.08 | 3.8E-04 |
| ST6GALNAC1 | 4.57 | 4.4E-02 | ST6GALNAC1 | 9.10 | 6.1E-03 |
| ST8SIA3 | −1.11 | 0.91 | ST8SIA3 | −1.06 | 0.95 |
| ST8SIA6 | −1.72 | 1.7E-02 | ST8SIA6 | −3.13 | 1.8E-03 |
| UGGT1 | −1.03 | 0.87 | UGGT1 | −1.15 | 0.30 |
| UGGT2 | −1.09 | 0.44 | UGGT2 | −1.18 | 9.3E-02 |
MDA-MB-231 cells were treated with miR-200a, miR-200b, or scramble mimics (50 nM) for 7 d. qRT-PCR was performed using RT2 Profiler PCR Array Human Glycosylation (Qiagen). Fold change (miR-treated/scramble-treated) was calculated by taking the average relative expression of miR-treated samples (n = 4 independent experiments, normalized to GAPDH) over the average relative expression of the scramble-treated cells (n = 4 independent experiments, normalized to GAPDH). Where the fold change was less than 1, the negative inverse is shown. P values for treated vs. scramble were calculated using Student's t-test. Statistically significant (P ≤ 0.05) down-regulation is in bold type, and statistically significant up-regulation is underlined.
Gene Silencing.
MISSION shRNA clones (Sigma Aldrich) were obtained as viral stocks from the shRNA Core at New York University Langone Medical Center. MDA-MB-231 cells were seeded at 80,000 cells per well in a six-well format and were transduced 24 h later with shRNA lentivectors (multiplicity of infection = 2) in medium containing 8 µg/mL Polybrene (Sigma Aldrich; see Dataset S1 for shRNA sequences). After 48 h, the medium was replaced with selection medium (1 µg/mL puromycin). Cells were harvested for protein and RNA extraction as described in the text.
Scratch Assay.
MDA-MB-231 cells were seeded at 80,000 cells per dish in 35-mm dishes. MiRNA treatment and gene silencing were performed as previously described. Confluent monolayers of cells were scratched on day 6 (miR-200f treatment) or day 5 (silencing) using a P200 tip, and the medium was replaced to remove floating cells. Images were acquired immediately after the scratch and 24 h later. Images were analyzed in ImageJ using the MiToBo plugin (www2.informatik.uni-halle.de/agprbio/mitobo/index.php/Main_Page) to quantify the wound area at time 0 h and 24 h. The percent of wound closure was calculated for a minimum of three regions per replicate (for one of the scramble-treated biological replicates only one region was imaged) and was averaged for three biological replicates.
Supplementary Material
Acknowledgments
We thank J. P. Trout and G. M. Sandelin for their help cloning 3′-UTR constructs and Boval BioSolutions for lyophilized protease- and IgG-free bovine serum albumin (no. LY-0081). This work was supported by Department of Defense Peer Reviewed Cancer Research Program Discovery Award CA110602. T.K. was the recipient of a Margaret Strauss Kramer Fellowship.
Footnotes
The authors declare no conflict of interest.
This article is a PNAS Direct Submission.
This article contains supporting information online at www.pnas.org/lookup/suppl/doi:10.1073/pnas.1502076112/-/DCSupplemental.
References
- 1. National Research Council (2012) Transforming Glycoscience: A Roadmap for the Future (National Academies, Washington, DC) p 191. [PubMed]
- 2.Freeze HH, Chong JX, Bamshad MJ, Ng BG. Solving glycosylation disorders: Fundamental approaches reveal complicated pathways. Am J Hum Genet. 2014;94(2):161–175. doi: 10.1016/j.ajhg.2013.10.024. [DOI] [PMC free article] [PubMed] [Google Scholar]
- 3.InanlooRahatloo K, et al. Mutation in ST6GALNAC5 identified in family with coronary artery disease. Sci Rep. 2014;4:3595. doi: 10.1038/srep03595. [DOI] [PMC free article] [PubMed] [Google Scholar]
- 4.Lencz T, et al. Genome-wide association study implicates NDST3 in schizophrenia and bipolar disorder. Nat Commun. 2013;4:2739. doi: 10.1038/ncomms3739. [DOI] [PMC free article] [PubMed] [Google Scholar]
- 5.Rakus JF, Mahal LK. New technologies for glycomic analysis: Toward a systematic understanding of the glycome. Annu Rev Anal Chem (Palo Alto Calif) 2011;4:367–392. doi: 10.1146/annurev-anchem-061010-113951. [DOI] [PubMed] [Google Scholar]
- 6.Fabian MR, Sonenberg N, Filipowicz W. Regulation of mRNA translation and stability by microRNAs. Annu Rev Biochem. 2010;79:351–379. doi: 10.1146/annurev-biochem-060308-103103. [DOI] [PubMed] [Google Scholar]
- 7.Kasper BT, Koppolu S, Mahal LK. Insights into miRNA regulation of the human glycome. Biochem Biophys Res Commun. 2014;445(4):774–779. doi: 10.1016/j.bbrc.2014.01.034. [DOI] [PMC free article] [PubMed] [Google Scholar]
- 8.Agrawal P, et al. Mapping posttranscriptional regulation of the human glycome uncovers microRNA defining the glycocode. Proc Natl Acad Sci USA. 2014;111(11):4338–4343. doi: 10.1073/pnas.1321524111. [DOI] [PMC free article] [PubMed] [Google Scholar]
- 9.Gaziel-Sovran A, et al. miR-30b/30d regulation of GalNAc transferases enhances invasion and immunosuppression during metastasis. Cancer Cell. 2011;20(1):104–118. doi: 10.1016/j.ccr.2011.05.027. [DOI] [PMC free article] [PubMed] [Google Scholar]
- 10.Kasza Z, et al. MicroRNA-24 suppression of N-deacetylase/N-sulfotransferase-1 (NDST1) reduces endothelial cell responsiveness to vascular endothelial growth factor A (VEGFA) J Biol Chem. 2013;288(36):25956–25963. doi: 10.1074/jbc.M113.484360. [DOI] [PMC free article] [PubMed] [Google Scholar]
- 11.Pedersen ME, et al. An epidermal microRNA regulates neuronal migration through control of the cellular glycosylation state. Science. 2013;341(6152):1404–1408. doi: 10.1126/science.1242528. [DOI] [PubMed] [Google Scholar]
- 12.Bracken CP, et al. Genome-wide identification of miR-200 targets reveals a regulatory network controlling cell invasion. EMBO J. 2014;33(18):2040–2056. doi: 10.15252/embj.201488641. [DOI] [PMC free article] [PubMed] [Google Scholar]
- 13.Liu Q, et al. miR-16 family induces cell cycle arrest by regulating multiple cell cycle genes. Nucleic Acids Res. 2008;36(16):5391–5404. doi: 10.1093/nar/gkn522. [DOI] [PMC free article] [PubMed] [Google Scholar]
- 14.Thiery JP, Acloque H, Huang RY, Nieto MA. Epithelial-mesenchymal transitions in development and disease. Cell. 2009;139(5):871–890. doi: 10.1016/j.cell.2009.11.007. [DOI] [PubMed] [Google Scholar]
- 15.Brabletz S, Brabletz T. The ZEB/miR-200 feedback loop—a motor of cellular plasticity in development and cancer? EMBO Rep. 2010;11(9):670–677. doi: 10.1038/embor.2010.117. [DOI] [PMC free article] [PubMed] [Google Scholar]
- 16.Gregory PA, et al. The miR-200 family and miR-205 regulate epithelial to mesenchymal transition by targeting ZEB1 and SIP1. Nat Cell Biol. 2008;10(5):593–601. doi: 10.1038/ncb1722. [DOI] [PubMed] [Google Scholar]
- 17.Park SM, Gaur AB, Lengyel E, Peter ME. The miR-200 family determines the epithelial phenotype of cancer cells by targeting the E-cadherin repressors ZEB1 and ZEB2. Genes Dev. 2008;22(7):894–907. doi: 10.1101/gad.1640608. [DOI] [PMC free article] [PubMed] [Google Scholar]
- 18.Betel D, Koppal A, Agius P, Sander C, Leslie C. Comprehensive modeling of microRNA targets predicts functional non-conserved and non-canonical sites. Genome Biol. 2010;11(8):R90. doi: 10.1186/gb-2010-11-8-r90. [DOI] [PMC free article] [PubMed] [Google Scholar]
- 19.Jurmeister S, et al. MicroRNA-200c represses migration and invasion of breast cancer cells by targeting actin-regulatory proteins FHOD1 and PPM1F. Mol Cell Biol. 2012;32(3):633–651. doi: 10.1128/MCB.06212-11. [DOI] [PMC free article] [PubMed] [Google Scholar]
- 20.Kanehisa M, Goto S. KEGG: Kyoto Encyclopedia of Genes and Genomes. Nucleic Acids Res. 2000;28(1):27–30. doi: 10.1093/nar/28.1.27. [DOI] [PMC free article] [PubMed] [Google Scholar]
- 21.Hess D, Keusch JJ, Oberstein SA, Hennekam RC, Hofsteenge J. Peters Plus syndrome is a new congenital disorder of glycosylation and involves defective Omicron-glycosylation of thrombospondin type 1 repeats. J Biol Chem. 2008;283(12):7354–7360. doi: 10.1074/jbc.M710251200. [DOI] [PubMed] [Google Scholar]
- 22.Boccuto L, et al. A mutation in a ganglioside biosynthetic enzyme, ST3GAL5, results in salt & pepper syndrome, a neurocutaneous disorder with altered glycolipid and glycoprotein glycosylation. Hum Mol Genet. 2014;23(2):418–433. doi: 10.1093/hmg/ddt434. [DOI] [PMC free article] [PubMed] [Google Scholar]
- 23.Simpson MA, et al. Infantile-onset symptomatic epilepsy syndrome caused by a homozygous loss-of-function mutation of GM3 synthase. Nat Genet. 2004;36(11):1225–1229. doi: 10.1038/ng1460. [DOI] [PubMed] [Google Scholar]
- 24.Bos PD, et al. Genes that mediate breast cancer metastasis to the brain. Nature. 2009;459(7249):1005–1009. doi: 10.1038/nature08021. [DOI] [PMC free article] [PubMed] [Google Scholar]
- 25.Liang CC, Park AY, Guan JL. In vitro scratch assay: A convenient and inexpensive method for analysis of cell migration in vitro. Nat Protoc. 2007;2(2):329–333. doi: 10.1038/nprot.2007.30. [DOI] [PubMed] [Google Scholar]
- 26.Jessani N, et al. Carcinoma and stromal enzyme activity profiles associated with breast tumor growth in vivo. Proc Natl Acad Sci USA. 2004;101(38):13756–13761. doi: 10.1073/pnas.0404727101. [DOI] [PMC free article] [PubMed] [Google Scholar]
- 27.Gregory PA, et al. An autocrine TGF-beta/ZEB/miR-200 signaling network regulates establishment and maintenance of epithelial-mesenchymal transition. Mol Biol Cell. 2011;22(10):1686–1698. doi: 10.1091/mbc.E11-02-0103. [DOI] [PMC free article] [PubMed] [Google Scholar]
- 28.Liu J, et al. Suppression of SCARA5 by Snail1 is essential for EMT-associated cell migration of A549 cells. Oncogenesis. 2013;2:e73. doi: 10.1038/oncsis.2013.37. [DOI] [PMC free article] [PubMed] [Google Scholar]
- 29.Nita-Lazar M, Rebustini I, Walker J, Kukuruzinska MA. Hypoglycosylated E-cadherin promotes the assembly of tight junctions through the recruitment of PP2A to adherens junctions. Exp Cell Res. 2010;316(11):1871–1884. doi: 10.1016/j.yexcr.2010.02.008. [DOI] [PMC free article] [PubMed] [Google Scholar]
- 30.Pinho SS, et al. Loss and recovery of Mgat3 and GnT-III Mediated E-cadherin N-glycosylation is a mechanism involved in epithelial-mesenchymal-epithelial transitions. PLoS ONE. 2012;7(3):e33191. doi: 10.1371/journal.pone.0033191. [DOI] [PMC free article] [PubMed] [Google Scholar]
- 31.Freire-de-Lima L. Sweet and sour: The impact of differential glycosylation in cancer cells undergoing epithelial-mesenchymal transition. Front Oncol. 2014;4:59. doi: 10.3389/fonc.2014.00059. [DOI] [PMC free article] [PubMed] [Google Scholar]
- 32.Draghici S, Khatri P, Eklund AC, Szallasi Z. Reliability and reproducibility issues in DNA microarray measurements. Trends Genet. 2006;22(2):101–109. doi: 10.1016/j.tig.2005.12.005. [DOI] [PMC free article] [PubMed] [Google Scholar]
- 33.Nairn AV, et al. Regulation of glycan structures in murine embryonic stem cells: Combined transcript profiling of glycan-related genes and glycan structural analysis. J Biol Chem. 2012;287(45):37835–37856. doi: 10.1074/jbc.M112.405233. [DOI] [PMC free article] [PubMed] [Google Scholar]
- 34.Schjoldager KT, Clausen H. Site-specific protein O-glycosylation modulates proprotein processing - deciphering specific functions of the large polypeptide GalNAc-transferase gene family. Biochim Biophys Acta. 2012;1820(12):2079–2094. doi: 10.1016/j.bbagen.2012.09.014. [DOI] [PubMed] [Google Scholar]
- 35.Dalziel M, Crispin M, Scanlan CN, Zitzmann N, Dwek RA. Emerging principles for the therapeutic exploitation of glycosylation. Science. 2014;343(6166):1235681. doi: 10.1126/science.1235681. [DOI] [PubMed] [Google Scholar]
- 36.Kim SJ, et al. Ganglioside GM3 participates in the TGF-β1-induced epithelial-mesenchymal transition of human lens epithelial cells. Biochem J. 2013;449(1):241–251. doi: 10.1042/BJ20120189. [DOI] [PubMed] [Google Scholar]
- 37.Heinonen TY, Maki M. Peters’-plus syndrome is a congenital disorder of glycosylation caused by a defect in the beta1,3-glucosyltransferase that modifies thrombospondin type 1 repeats. Ann Med. 2009;41(1):2–10. doi: 10.1080/07853890802301975. [DOI] [PubMed] [Google Scholar]
- 38.Ittner LM, et al. Compound developmental eye disorders following inactivation of TGFbeta signaling in neural-crest stem cells. J Biol. 2005;4(3):11. doi: 10.1186/jbiol29. [DOI] [PMC free article] [PubMed] [Google Scholar]
- 39.Kang P, Svoboda KK. Epithelial-mesenchymal transformation during craniofacial development. J Dent Res. 2005;84(8):678–690. doi: 10.1177/154405910508400801. [DOI] [PubMed] [Google Scholar]
- 40.Vasudevan D, Takeuchi H, Johar SS, Majerus E, Haltiwanger RS. Peters plus syndrome mutations disrupt a noncanonical ER quality-control mechanism. Curr Biol. 2015;25(3):286–295. doi: 10.1016/j.cub.2014.11.049. [DOI] [PMC free article] [PubMed] [Google Scholar]
- 41.Le Goff C, Cormier-Daire V. From tall to short: The role of TGFβ signaling in growth and its disorders. Am J Med Genet C Semin Med Genet. 2012;160C(3):145–153. doi: 10.1002/ajmg.c.31337. [DOI] [PubMed] [Google Scholar]
- 42.Chen C, et al. Serum TGF-β1 and SMAD3 levels are closely associated with coronary artery disease. BMC Cardiovasc Disord. 2014;14:18. doi: 10.1186/1471-2261-14-18. [DOI] [PMC free article] [PubMed] [Google Scholar]
- 43.Lan TH, Huang XQ, Tan HM. Vascular fibrosis in atherosclerosis. Cardiovasc Pathol. 2013;22(5):401–407. doi: 10.1016/j.carpath.2013.01.003. [DOI] [PubMed] [Google Scholar]
- 44.Gloster TM, Vocadlo DJ. Developing inhibitors of glycan processing enzymes as tools for enabling glycobiology. Nat Chem Biol. 2012;8(8):683–694. doi: 10.1038/nchembio.1029. [DOI] [PubMed] [Google Scholar]
- 45.Hsu KL, Pilobello K, Krishnamoorthy L, Mahal LK. Ratiometric lectin microarray analysis of the mammalian cell surface glycome. Methods Mol Biol. 2011;671:117–131. doi: 10.1007/978-1-59745-551-0_6. [DOI] [PubMed] [Google Scholar]
- 46.Hsu KL, Gildersleeve JC, Mahal LK. A simple strategy for the creation of a recombinant lectin microarray. Molecular BioSystems. 2008;4(6):654–662. doi: 10.1039/b800725j. [DOI] [PMC free article] [PubMed] [Google Scholar]
- 47.Pilobello KT, Agrawal P, Rouse R, Mahal LK. Advances in lectin microarray technology: Optimized protocols for piezoelectric print conditions. Curr Protoc Chem Biol. 2013;5(1):1–23. doi: 10.1002/9780470559277.ch120035. [DOI] [PMC free article] [PubMed] [Google Scholar]
- 48.Batista BS, Eng WS, Pilobello KT, Hendricks-Munoz KD, Mahal LK. Identification of a conserved glycan signature for microvesicles. J Proteome Res. 2011;10(10):4624–4633. doi: 10.1021/pr200434y. [DOI] [PMC free article] [PubMed] [Google Scholar]
Associated Data
This section collects any data citations, data availability statements, or supplementary materials included in this article.