Abstract
Background:
Obtaining ground truth for pathological images is essential for various experiments, especially for training and testing image analysis algorithms. However, obtaining pathologist input is often difficult, time consuming and expensive. This leads to algorithms being over-fitted to small datasets, and inappropriate validation, which causes poor performance on real world data. There is a great need to gather data from pathologists in a simple and efficient manner, in order to maximise the amount of data obtained.
Methods:
We present a lightweight, web-based HTML5 system for administering and participating in data collection experiments. The system is designed for rapid input with minimal effort, and can be accessed from anywhere in the world with a reliable internet connection.
Results:
We present two case studies that use the system to assess how limitations on fields of view affect pathologist agreement, and to what extent poorly stained slides affect judgement. In both cases, the system collects pathologist scores at a rate of less than two seconds per image.
Conclusions:
The system has multiple potential applications in pathology and other domains.
Keywords: Data acquisition, gold standard, ground truth, training data, web experiment system
INTRODUCTION
Image analysis algorithms have the potential to either fully or partially automate visual inspection tasks to assist pathologists with their workload. However, due to the amount of variation in appearance between both tissue and disease types, complex algorithms need to be developed specifically for one purpose, rather than general image analysis pathologist tasks.[1]
In order to be properly validated, image analysis algorithms must be trained on an extensive and varied set of preclassified images.[2,3,4,5,6,7] For the trained algorithms to be trusted (let alone useful), classification of these images must be done by clinically trained pathologists with working experience of the tissue and disease being analyzed.[8,9,10] However, labeling large quantities of data for training and testing is time-consuming for pathologists and, therefore, expensive to generate. This often results in pathologists providing insufficient amounts of data for training algorithms and validating experiments.[11] Insufficient training and validation of pathological image analysis algorithms leads to overfitting to the ground truth, meaning that algorithms fail when exposed to real-world image data.
Obtaining reliable ground truth data for experiments is difficult.[12] Therefore the process with which the pathologist generates this data should be as simple and effective as possible. Maximizing the amount of ground truth data obtained, compared to the effort spent by the pathologist generating the data will provide computer vision researchers with larger expert-classified data sets for training, testing, and validation of their algorithms. In this paper, we present a lightweight web-based system specifically designed to capture pathologist scores and opinions rapidly, and demonstrate its use in two use cases.
METHODS
Prospector is a web-based interactive pathology scoring system, using HTML5, jQuery, and PHP, with a MySQL database and Matlab compiled executable programs used for background data processing. As a result, the system is both platform and browser independent. The system itself has been developed by the primary author at the Section of Pathology and Tumor Biology, within the Leeds Institute of Cancer and Pathology, at the University of Leeds, UK.
Prospector is Primarily Modeled on Two Simple Use Cases
Administering an experiment
Participating in an experiment
Part one allows administrator users to create an experiment, whereby administrators are required to provide a comma separated value (CSV) list of uniform resource locators pointing to static images. These images should be hosted on a fast, reliable server, and should not exceed the expected size of the image viewing area (related to monitor size), in order to maximize the efficiency of the experiment. Images can be micrographs, extracts from virtual slides, or macroscopic images. Images can also be generated from within predefined regions of interest on a virtual slide, creating randomly sampled, equidistant and systematically placed images, using the random spot system.[13] With the image list created, administrators are required to step through a simple setup wizard, which consists of four screens.
Initially, the administrator is presented with a list of available experiments to view and edit, or to create a new experiment. This functionality is contained within the left-hand pane of the screen, shown in Figure 1, and existing experiments may be selected and edited form here. Built into the system is an automatic mailto E-mail link that invites recipients to participate in the experiment, and provides them with a hyperlink to follow. Once participants have completed the experiment, their data can be downloaded (by the administrator) as a zip archive of CSV files, where one CSV file contains all the responses from one participant.
Figure 1.
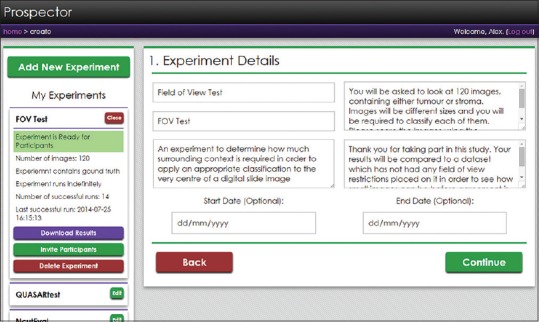
The experiment setup screen. The left-hand pane shows a collapsible list of all the experiments that the administrator has made. From the expanded view, administrators can edit the experiment, download existing results, invite participants using a generic E-mail template or delete the experiment. The right-hand pane shows step one of the experiment setup wizard, asking for the experiment title, short name, description, brief, debrief, and optional start and end dates
The first screen of the setup wizard asks the administrator to provide a name and description of the experiment, a brief and debrief, and optional start and end dates which can limit the period of the experiment's availability to participants. If left blank, the experiment will run indefinitely. The brief and debrief are used to present to the participants before and after the experiment has taken place.
The second screen prompts users to upload their list of image hyperlinks with optional ground truth data. Ground truth should be a short text classification applied to each image in the list as the second column, denoting the correct or ideal classification that should be given by the participant. Providing existing ground truth data changes the experiment type from “collection” to “comparison,” and is useful for studies compare levels of agreement, or the effects of controlled manipulation of pathologist scoring conditions (see the case studies for examples of the “comparison” experiment). These classifications will be used to compare to participant scores, so it is important that the text classifications provided can be matched to the available scoring categories specified in screen three. Collection experiments are simply for obtaining ground truth from pathologists. Images can be presented to the user sequentially or in a random order, and can be rotated and translated randomly in order to prevent repetition biases.
The third screen is for setting the available scores which participants may respond with. Each possible score requires a name, a description and a shortcut key. Names of scores should be directly comparable to ground truth data, if provided. It should be noted that the system has specifically been designed to give single keystroke responses in order to maximize throughput of data.
The fourth and final screen of the wizard concerns privacy. By default, the experiment is open to the world, and only requires a name and valid E-mail address to participate. Administrators may however provide a CSV while list of E-mail addresses that are allowed to participate in their experiments. For ease of use, using an asterisk and E-mail domain will whitelist all addresses from a particular organization (e.g.*@leeds.ac.uk). The type of anonymity given to the participant can also be set with one of the three options: “Forced anonymity,” where all participation is anonymous; “optional anonymity,” where participants may choose to participate anonymously; “no anonymity,” where participant identity is required to be linked to their results. The default setting is “optional anonymity.”
Part two allows users to participate in an existing experiment that has been created previously. The participant is asked to log in, providing their name and an E-mail address, and then is presented with advice on how to setup their environment before continuing the experiment. This relates to room conditions, browser settings, screen size, brightness, and contrast (using a calibration scale). Once the participant has optimized their conditions, they are presented with the experiment brief (set by the administrator), and instructions on how to use the system before proceeding to the scoring screen [Figure 1].
Figure 2 illustrates the scoring screen for the participant. The main image is a nonnavigable, static snapshot. This is primarily in order to reduce the time spent navigating and loading the image, but also allows the system to be able to apply random rotation and translation for prevention of repetition biases. The image in Figure 1 also has automatically placed guides over it, because in this example, the participant is being asked to identify the tissue type at the very center of the image. The control panel on the right-hand side has been optimized for tablet users, with large, simple buttons. Desktop users are encouraged to use the keyboard shortcuts described at the top of the panel. These methods of scoring have been used to reduce as many clicks, taps or keystrokes as possible to increase data acquisition.
Figure 2.
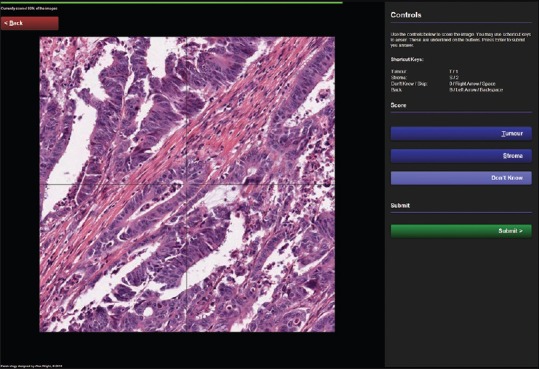
The participant scoring screen, displaying an example experiment for scoring colorectal cancer tissue in order to identify the ratio of tumor to stroma. The screen consists of a large viewing area for the images, a control panel containing available scores and associated keyboard shortcut keys, a slim progress bar at the top, and a back navigation button to correct scores made in error. Also note that as an optional feature, crosshairs have been placed over the image to help participants identify the center of the image, where the classification is to be made
Once all the images have been scored, the data is saved and instantly available for the administrator to download. If the experiment is comparing scores to existing ground truth, then the data is matched and added to the dataset. The participant is presented with a debrief screen [Figure 3] and if applicable, the level of percentage agreement with the original ground truth data.
Figure 3.
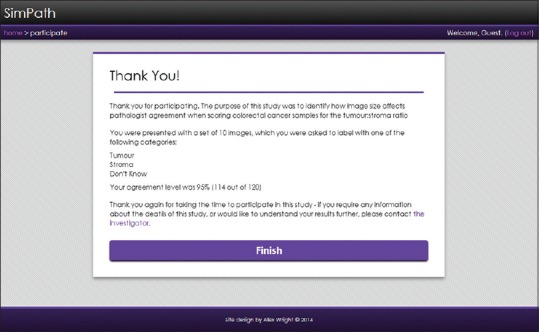
The experiment debrief screen providing feedback on the participant's performance and the purpose of the study
RESULTS
Prospector has been used in existing studies to determine optimal scoring conditions for pathologists. We present two cases studies, both using the “comparison” paradigm of the system in order to establish conditions that maximize levels of agreement between pathologists.
Case Study 1: Determining Optimal Image Sizes for Contextual Analysis
The aim of the first case study was to identify how much contextual information is required in order for a pathologist to classify a given point on a piece of tissue.[7] Forty images of colorectal cancer (CRC) tissue were used in the experiment, which had already been classified by a pathologist as part of a clinical trial study.[14] The clinical trial used anonymized virtual slides scanned at × 20 objective zoom, or 0.5 microns/pixel. The classifications were made by pathologists evaluating single point locations, within each virtual slide containing CRC tissue, in order to identify the type of tissue found at each of the locations. For the purposes of this study, classifications were simplified into one of the two classes: Tumor or stroma. The 40 images for the case study one were randomly selected from the full set of over 2000 clinical CRC cases, containing over 100,000 pathologist-scored point locations. Each of the 40 images were extracted at the virtual slide native resolution (0.5 microns/pixel), using three different sizes, in order to present to the participants images with different amounts of visual contextual information surrounding the classified point. The image sizes were 64px2, 256px2, and 1024px2. The intention of the study was to establish whether there were significant effects on the level of agreement between participants, when scoring images of different sizes.
Six participants (3 trained pathologists and three technicians experienced in scoring tissue) were presented with the 120 images and asked to classify each of them. As described previously, images were rotated and translated randomly to avoid repetition biases, and guides were placed over the images to explicitly illustrate the exact point that should be classified. Participant agreement was calculated by the system and presented in the experiment debrief. The results were analyzed in order to establish an appropriate minimum size for image analysis algorithms to classify tissue, using appropriate levels of context (neighboring tissue). Figure 4 illustrates the experiment was successful in identifying that 64p × 2 images were not appropriate for human inspection, whereas both 256px2 and 1024px2 were.
Figure 4.
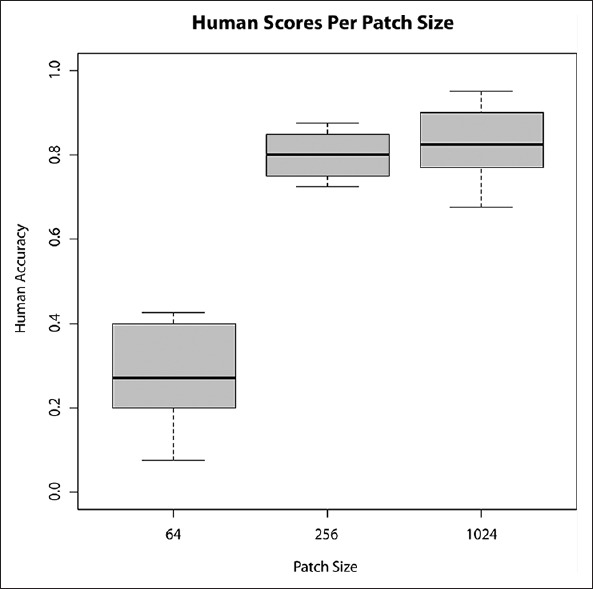
Box plots of accuracy when limited to three fields of view - 64px2, 256px2, and 1024px2
Due to the simplicity of the user interface for the scoring system, participants were able to familiarize themselves with the system rapidly, and the mean time taken to complete the experiment was approximately 212 s for all 120 images, equating to a mean scoring time of 1.77 s/image.
Case Study 2: Identifying Possible Staining Intensity Thresholds for Quality Control of Virtual Slides
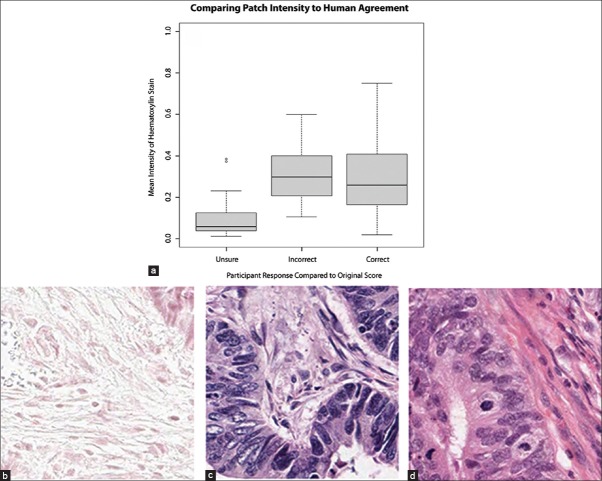
The second case study used a similar methodology to identify how staining intensity, or lack thereof, affects a pathologist's ability to score images of tissue.[15] Using a set of 240 images taken from the same dataset as case study one (scanned at 0.5 microns/pixel), all of which sized at 256px2, the staining intensity of each image was calculated prior to being presented to the pathologist. Using color deconvolution[16] to separate hematoxylin from eosin stains (H and E), the nuclear staining channel (H) was thresholded[17] in order to establish the mean intensity of foreground within the images. Foreground pixels within the nuclear staining channel image represented the nuclear structure and therefore important visual information regarding the tissue.[18] It was hypothesized that a lack of nuclear staining would impair the pathologist's ability to score the images, and agreement levels would be lower on images that had lower levels of staining.
One pathologist and one trained technician participated in the study, and their responses were correlated against the previously generated staining intensity statistics. Analysis of the data showed no significant differences between agreement and intensity [Figure 5], but showed a trend toward higher intensities being rejected by the pathologist (unsure category).
Figure 5.
(a) Box plots of agreement compared to mean intensity of the deconvoluted nuclear staining channel (b-d) example images representing mean foreground hematoxylin intensity for unsure (0.06), incorrect (0.3) and correct (0.27) responses, respectively
The average time taken to complete this experiment was approximately 454 s, equating to a mean scoring time of 1.89 s/image.
DISCUSSION
We have outlined how obtaining acceptable quantities of ground truth from pathologists is a barrier to improving computer vision algorithms, and that the generation of this data should be as efficient as possible. Out of this need, we have developed a simple and powerful web-based system for rapid acquisition of ground truth data, whereby a set of pathologist labeled images is generated. The system can also be used for comparing pathologist scores to existing ground truth data. This is beneficial for use in experiments either examining the efficacy of the characteristics of a given set of images or manipulating conditions in order to understand their effects on pathologist agreement. The system has been designed to be as minimalistic as possible to expedite experiment setup time and minimize participation time for pathologists, providing experimenters with a platform for rapidly capturing pathologist scores. We demonstrated its use in capturing a total of 960 opinions on 240 images across two case studies, with a mean scoring time of 1.83 s/image. As such, we believe prospector is an effective tool for experimenters wishing to analyze images using a simple, rapid interface. The case studies provided illustrate that the types of analyses are not limited to gathering training data for computer vision algorithms or pathologists wishing to score their own clinical images. The “comparison” experiment methodology has the capacity to be incorporated into experiments where pathologist counter scoring is required for validation, or for validating image analysis algorithm results, by recruiting pathologists to score markup images. Its use could also be extended to studies gathering opinions on images from multiple pathologists. Once familiarized with the shortcut keys, the mean time taken for a pathologist to score an image was < 2 s for a simple three-class scoring system. Time taken to analyze images will be subject to the type of analysis, and the bandwidth of the client machines. As a prospector is a web-based system, it can also be used for worldwide collaborations, such as clinical trials or inter-observer studies. The images used need not be photomicrographs or virtual slides, as the system could be used for macroscopic images, clinical images, or snapshots of radiological images. Currently, prospector only allows static images of virtual slides, as embedding navigable slides will slow down the user experience and has been beyond the scope of the project. However, the system itself is being actively developed with monthly releases, and all feature requests are considered. Further extensions of the system might provide an opportunity for crowd-sourcing massive online image assessment (citizen science) experiments that do not require expert training to classify images.
Prospector is available for use at http://www.virtualpathology.leeds.ac.uk/ prospector and at the time of writing requires an E-mail request to register as an administrator. Please E-mail the corresponding author for more information.
ACKNOWLEDGMENTS
This work is funded by Yorkshire Cancer Research.
Footnotes
Available FREE in open access from: http://www.jpathinformatics.org/text.asp?2015/6/1/21/157785
REFERENCES
- 1.Gurcan MN, Boucheron LE, Can A, Madabhushi A, Rajpoot NM, Yener B. Histopathological image analysis: A review. IEEE Rev Biomed Eng. 2009;2:147–71. doi: 10.1109/RBME.2009.2034865. [DOI] [PMC free article] [PubMed] [Google Scholar]
- 2.Zhou Y, Magee D, Treanor D, Bulpitt A. Stain guided mean-shift filtering in automatic detection of human tissue nuclei. J Pathol Inform. 2013;4(Suppl):S6. doi: 10.4103/2153-3539.109863. [DOI] [PMC free article] [PubMed] [Google Scholar]
- 3.Adam A, Bulpitt AJ, Treanor D. Texture analysis of virtual slides for grading dysplasia in barrett's oesophagus. Medical Image Understanding and Analysis. 2011:1–5. [Google Scholar]
- 4.Chomphuwiset P, Magee DR, Boyle RD, Treanor D. Context-based classification of cell nuclei and tissue regions in liver histopathology. Medical Image Understanding and Analysis. 2011:1–5. [Google Scholar]
- 5.Chomphuwiset P, Magee D, Boyle R. Nucleus classification and bile duct detection in liver histology. MICCAI Workshop on Machine Learning in Medical Imaging. 2010:1–8. [Google Scholar]
- 6.Lim CH, Treanor D, Dixon MF, Axon AT. Low-grade dysplasia in Barrett's esophagus has a high risk of progression. Endoscopy. 2007;39:581–7. doi: 10.1055/s-2007-966592. [DOI] [PubMed] [Google Scholar]
- 7.Wright A, Magee D, Quirke P, Treanor DE. Towards automatic patient selection for chemotherapy in colorectal cancer trials. Proc SPIE 9041, Medical Imaging 2014: Digital Pathology. 2014:90410A. [Google Scholar]
- 8.Hipp JD, Lucas DR, Emmert-Buck MR, Compton CC, Balis UJ. Digital slide repositories for publications: Lessons learned from the microarray community. Am J Surg Pathol. 2011;35:783–6. doi: 10.1097/PAS.0b013e31821946b6. [DOI] [PubMed] [Google Scholar]
- 9.Madabhushi A. Digital pathology image analysis: Opportunities and challenges. Imaging Med. 2009;1:7–10. doi: 10.2217/IIM.09.9. [DOI] [PMC free article] [PubMed] [Google Scholar]
- 10.Hipp JD, Smith SC, Sica J, Lucas D, Hipp JA, Kunju LP, et al. Tryggo: Old norse for truth: The real truth about ground truth: New insights into the challenges of generating ground truth maps for WSI CAD algorithm evaluation. J Pathol Inform. 2012;3:8. doi: 10.4103/2153-3539.93890. [DOI] [PMC free article] [PubMed] [Google Scholar]
- 11.Laurinavicius A, Laurinaviciene A, Dasevicius D, Elie N, Plancoulaine B, Bor C, et al. Digital image analysis in pathology: Benefits and obligation. Anal Cell Pathol (Amst) 2012;35:75–8. doi: 10.3233/ACP-2011-0033. [DOI] [PMC free article] [PubMed] [Google Scholar]
- 12.Hipp JD, Sica J, McKenna B, Monaco J, Madabhushi A, Cheng J, et al. The need for the pathology community to sponsor a whole slide imaging repository with technical guidance from the pathology informatics community. J Pathol Inform. 2011;2:31. doi: 10.4103/2153-3539.83191. [DOI] [PMC free article] [PubMed] [Google Scholar]
- 13.Wright AI, Grabsch HI, Treanor DE. RandomSpot: A web-based tool for systematic random sampling of virtual slides. J Pathol Inform. 2015;6:8. doi: 10.4103/2153-3539.151906. [DOI] [PMC free article] [PubMed] [Google Scholar]
- 14.Gray R, Barnwell J, McConkey C, Hills RK, Williams NS, et al. Quasar Collaborative Group. Adjuvant chemotherapy versus observation in patients with colorectal cancer: A randomised study. Lancet. 2007;370:2020–9. doi: 10.1016/S0140-6736(07)61866-2. [DOI] [PubMed] [Google Scholar]
- 15.Magee D, Treanor D, Crellin D, Shires M, Mohee K, Quirke P. Colour normalisation in digital histopathology images. Optical Tissue Image analysis in Microscopy, Histopathology and Endoscopy (MICCAI Workshop) 2009:100–11. [Google Scholar]
- 16.Ruifrok AC, Johnston DA. Quantification of histochemical staining by color deconvolution. Anal Quant Cytol Histol. 2001;23:291–9. [PubMed] [Google Scholar]
- 17.Huang LK, Wang MJ. Image thresholding by minimizing the measures of fuzziness. Pattern Recognit. 1995;28:41–51. [Google Scholar]
- 18.Wu Y, Grabsch H, Ivanova T, Tan IB, Murray J, Ooi CH, et al. Comprehensive genomic meta-analysis identifies intra-tumoural stroma as a predictor of survival in patients with gastric cancer. Gut. 2013;62:1100–11. doi: 10.1136/gutjnl-2011-301373. [DOI] [PubMed] [Google Scholar]


