

Abstract
Objective: To explore the protective effects of calcitriol on diabetic nephropathy by modulating the expressions of transforming growth factor-beta 1 (TGF-β1) and Cdc42 interacting protein-4 (CIP4). Methods: Streptozotocin-induced diabetic nephropathy rats (n=36) were randomly divided into control group (control-H, control-M, control-L) and calcitriol group (calcitriol-H, calcitriol-M, calcitriol-L). The expression of TGF-β1 gradually decreased in control-H, control-M and control-L subgroups by injection of different virus vectors. Peanut oil and calcitriol were given to control and calcitriol group, respectively. The expressions of TGF-β1 and CIP4 in kidney, the pathology, and the renal function and lipid profiles were compared between control and calcitriol treatment groups. Results: In the control group, the higher level of TGF-β1 was associated with more severe glomerular pathology (P<0.05). There is a positive correlation between the expression of CIP4 and TGF-β1. Control-H subgroup had significant more severe kidney disease, higher levels of cholesterol, triglyceride, blood glucose, blood urea nitrogen (BUN) and creatinine (Cr) than control-M and control-L subgroups. After calcitriol treatment, the expression of TGF-β1 and CIP4 were significantly decreased compared to the corresponding control subgroups (all P<0.05). Renal fibrosis and pathological changes were markedly improved. The levels of cholesterol, triglyceride, blood glucose, BUN and Cr were significantly reduced (P<0.05). Conclusion: Calcitriol may protect diabetic nephropathy from fibrosis via inhibition of TGF-β1 and CIP4.
Keywords: Diabetic nephropathy, calcitriol, transforming growth factor beta 1 (TGF-β1), Cdc42 interacting protein-4 (CIP4)
Introduction
Diabetic nephropathy (DN), as a severe micro-vascular complication of diabetes mellitus, is the first cause for end-stage renal failure [1-4]. DN is characterized by excessive deposition of extracellular matrix (ECM), thickening of glomerular and tubular basement membranes, and increased amount of mesangial matrix. The above pathologies ultimately lead to glomerular sclerosis and tubulointerstitial fibrosis [5]. Although a comprehensive control on hyperglycemia, hypertension and dyslipidemia can significantly delay the progression of diabetic nephropathy, a large proportion of patients may eventually develop into chronic renal failure.
Transforming growth factor-β1 (TGF-β1) is proved to be a potential fibrogenic factor, which can induce tubular epithelial-mesenchymal transition (EMT) and then participate in the process of renal interstitial fibrosis [6-9]. The expression of Cdc42 interacting protein-4 (CIP4) were also increased in renal interstitial fibrosis [10], suggesting that CIP4 may be involved in the development of diabetic nephropathy.
Recent research found that, in addition to regulating calcium-phosphorus metabolism, calcitriol is wildly involved in the immune system and kidney disease by modulating various cell differentiation and proliferation [11]. A previous study in nephrectomized rats showed that vitamin D analog and ACEI therapy resulted in an additional reno-protective effect presumably by regulating the RAAS system [12]. Recent data showed that vitamin D is involved in the modulation of renin-angiotensin system [13,14]. Also, active vitamin D3 could effectively reduce the renal fibrosis and protect the renal function in diabetic nephropathy rat models [15]. Therefore, it seems that the kidney function possibly improved by calcitriol supplementation. Therefore, the aim of the present study was to explore the protective effects of calcitriol on diabetic kidney. The underlying mechanisms may be involved with the anti-fibrosis effects and decreased expressions of TGF-β1 and CIP4 after calcitriol treatment.
Materials and methods
Animals
Male Sprague-Dawley (SD) rats (weighing 80 g) were obtained from the Xinjiang Uygur Autonomous Region Center. All experiments were conducted in accordance with the US National Institutes of Health Guide for the Care and Use of Laboratory Animals, and the experimental protocol was approved by the Ethics Committee of Xinjiang Medical University.
Reagents and materials
Calcitriol (Roche, China), TGF-β1 Lentiviral vectors were purchased from Biowit Technologies Company (Shenzhen, China). The primers were purchased from the Taihe Gene Biotechnology Company (Beijing, China). Masson’s trichrome stain kit was purchased from Fuzhou Maixin Biotech (Fuzhou, China). TGF-β1 and CIP4 antibodies were obtained from Abcam (American). β-actin antibody was purchased from Cell-signaling. Two-step immunohistochemical detection reagents and PBS were purchased from Zhongshan Biotechnology Company (Beijing, China).
Experimental animals, grouping, and treatments
Male Sprague-Dawley (SD) rats were fed with normal diet. All animals were housed at a temperature of 20-25°C, a humidity of 65-69%, and were subjected to a 12 h light/dark cycle with free access to food and tap water. When they grow up to about 300 g, a high-fat diet was given. After 8-week of high-fat diet, diabetes was induced by a single intraperitoneal injection of streptozotocin (Sigma, USA) at a dose of 30 mg/kg diluted in the citrate buffer (0.1 mol/L, pH 4.0) [16]. Seventy-two hours after streptozotocin injection, diabetes was diagnosed when their random blood glucose levels over 16.7 mmol/L for 3 days [17]. Another 8-week of high-fat diet was continued, maintaining blood glucose >16.7 mmol/L. At this time, 24 h urine output is above 150% of the original amount of urine and urinary protein excretion is above 30 mg/24 h, indicating the model of DN. The DN rats (n=36) were randomly assigned to two groups: the control group (treated with peanut oil by gavage, n=18) and calcitriol group (treated with calcitriol by gavage, n=18). Calcitriol was dissolved in the 0.05ml peanut oil and was given to the rat with a dose of 0.03 μg/(kg.d).
In the control group, rats with over-express of TGF-β1 (injected Lentiviral vector with increasing the expression of TGF-β1) were set as Control-H (n=6); Rats with normal expression of TGF-β1 (injected Lentiviral vector without any active gene segments) were set as Control-M (n=6); Rats with low-express of TGF-β1 (injected Lentiviral vector with a segment of siRNA, which will disturb the expression of TGF-β1) were set as Control-L (n=6). Similarly, in the calcitriol group, the subgroups were set as calcitriol-H (n=6), calcitriol-M (n=6) and calcitriol-L (n=6) according to the different levels of TGF-β1 expressed in kidney. After calcitriol treatment for 37 days, the animals were euthanized and the blood samples were collected by cardiac puncture. Renal tissue was immediately frozen for Western blot and RT-PCR.
Real-time PCR analysis
Total RNA was isolated and purified from the kidney cortex and the concentrations were determined by using a microspectrophotometer. The cDNA was prepared by using these samples, according to the protocols provided by a commercially available QuantiTect Reverse Transcription kit (Qiagen, Germany). Quantitative real-time PCR was conducted by the following procedures: denatured for 10 minutes at 95°C; annealing of primers at 95°C for 10 seconds; extension at 60°C for 30 seconds; the template was amplified for 40 cycles. Gene expression was quantified by means of the comparative Ct method (ΔΔCt) and the relative quantification (RQ) was calculated as 2-ΔΔCt [17]. All RT-PCRs were performed in triplicate, and the data was presented as mean ± SD. The primers of TGF-β1 were as follows: forward 5’-AGAAGTCACCCGCGTGCTAAT-3’ and reverse 5’-CACTGCTTCCCGAATGTCTGA-3’; CIP4: forward 5’-CACAGGGGACCTTTG CACT-3’ and reverse 5’-CTATGTACAGCCACACGGGA-3’; β-actin: forward 5’-AGTACCCCATTGAACACGGC-3’ and reverse 5’-TTTTCACGGTTGGCCTTA GG -3’.
Western blot analysis
Proteins were extracted from the kidney by using RIPA buffer (containing 0.1% PMSF). Equal amounts of protein from each sample (50 µg) were electrophoresed on 10% SDS-PAGE gels and transferred to polyvinylidene fluoride (PVDF) membranes. The membranes were blocked by blocking solutions for 30 minutes and then incubated with the following antibodies: TGF-β1 (1:100), CIP4 (1:1000), β-actin (1:1000) at 4°C overnight, and horseradish peroxidase (HRP) rabbit anti-mouse secondary antibody (1:10000) for 2 h. The blots were detected by chemiluminescent substrate. The densitometric analysis was conducted with ChemiDoc MP Imaging System (BIO-RAD). Each band normalized to β-actin presented the relative density values.
Immunohistochemical Staining
Serial sections of formalin-fixed paraffin-embedded nephridial tissues were prepared into 3μm sections and placed on a microscope slide. The sections were digested with 3% H2O2 for 10 minutes at room temperature to remove peroxidase, and then incubated with citrate for 10 minutes. Subsequently, sections were incubated in primary antibodies TGF-β1 (1:50) and CIP4 (1:100) overnight at 4°C. Thereafter, the slices were incubated with secondary antibody for 25 minutes. The diaminobenzidine was used to visualize in a color reaction. Brown and yellow colors indicate positive results. The diagnostic criteria of immunohistochemical results included the following conditions: Nucleus, cytoplasm or cell membrane stained with brown, tan and yellow colors were considered positive. Staining levels were classified as follows: Unstained on background = zero points; light staining = one point; moderate staining = two points; deep staining = three points. The percentage of stained cells was classified as follows: Negative = zero points; staining range ≤25% = one point; 26-50% = two points; 51-75% = three points; >75% = four points. The final points were calculated by multiplying the staining level score of each section by the range score, and were as followings: ≤1 were negative (-); >1 but ≤3 were weakly positive (1+); >3 but ≤5 were moderately positive (2+) and >5 was strongly positive (3+) [18].
Histopathological examination of renal tissue
Paraffin-embedded kidney tissue was processed into sections with 3μm thick and stained. Hematoxylin-eosin (HE) and Masson’s trichrome staining were used for light microscopy. The tissue was fixed by glutaraldehyde for electronic microscopy.
Biochemical assays
Blood glucose values were determined by blood glucose monitor (Roche, China) on fasted tail blood. The levels of 24 h urinary albumin, serum cholesterol, triglycerides, Cr and BUN were measured by the automatic biochemical analyzer (HITACHI, Japan).
Statistical analysis
The results are expressed as means ± SD. Statistical analyses were conducted with SPSS version 17.0 and performed by one-way ANOVA for multiple comparisons. t-tests or nonparametric test was used for the comparisons of two groups. Differences were considered significant at P<0.05.
Results
In the control group, the higher expression of TGF-β1 and CIP4 was associated with more severe kidney disease, increased fibrosis, and elevated levels of cholesterol, triglycerides, BUN and Cr
The levels of mRNA and protein of TGF-β1 gradually decreased in control-H, control-M and control-L subgroups. mRNA of TGF-β1 was different in three subgroups (P<0.05; Figure 1A). The protein levels of TGF-β1 (by western blot) in control-H, control-M and control-L were 3.4 ± 0.9, 2.4 ± 1.0 and 0.8 ± 0.3, respectively, (P<0.05) (Figure 1B). Immunohistochemical staining showed the similar results: the expression of TGF-β1 gradually decreased in control-H, control-M and control-L (Figure 2); TGF-β1 primarily expressed in the renal tubules. These results suggest that the DN models with different levels of TGF-β1 were successfully established.
Figure 1.
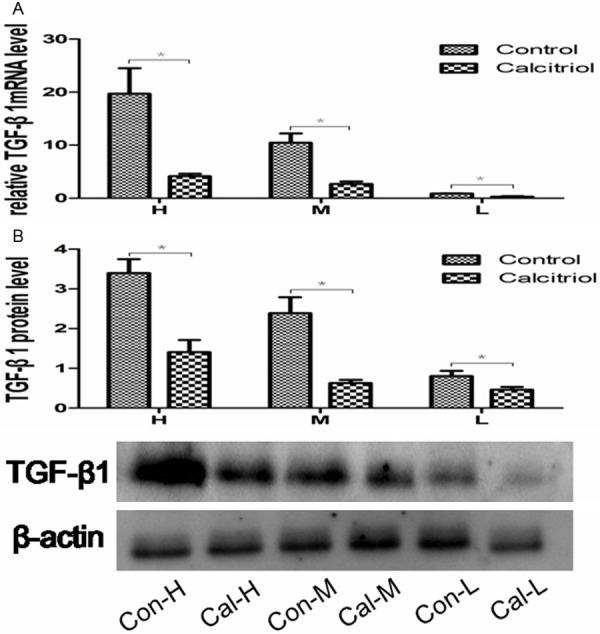
The expression of TGF-β1 after injection with TGF-β1 lentivirus. A. Representative RT-PCR analysis for TGF-β1mRNA expression in the control and calcitriol group. B. Representative Western blot analysis for TGF-β1 in the control and calcitriol group. *P<0.05 compared with control group. H: control-H and calcitriol-H; M: control-M and calcitriol-M; L: control-L and calcitriol-L.
Figure 2.
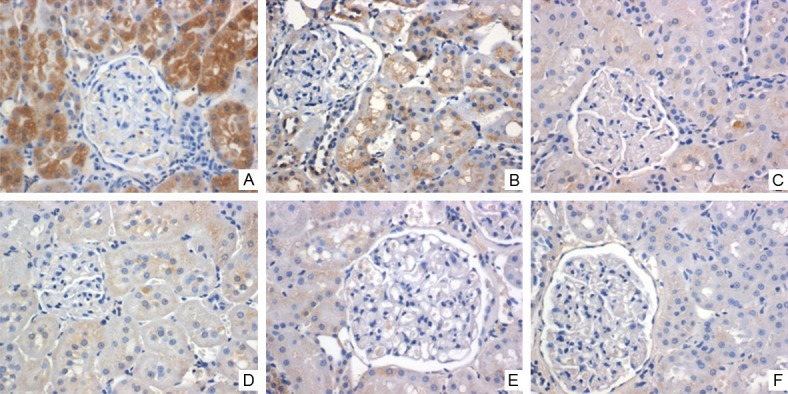
The expression of TGF-β1 after injection with TGF-β1 lentivirus. The expression of TGF-β1 protein was determined with immunohistochemical staining (brown colors indicate TGF-β1 positive staining). TGF-β1 immunostaining is strong in the control subgroups and weaker in the calcitriol group (Magnification ×400). A. Control-H; B. Control-M; C. Control-L; D. Calcitriol-H; E. Calcitriol-M; F. Calcitriol-L.
The levels of mRNA and protein of CIP4 gradually decreased in control-H, control-M and control-L subgroups (P<0.05; Figure 3A).CIP4 protein levels were 4.2 ± 1.5, 1.6 ± 0.8 and 0.4 ± 1.1, respectively in control-H, control-M and control-L subgroup (P<0.05) (Figure 3B). Immunohistochemical staining showed that CIP4 also primarily expressed in the renal tubules. The expression of CIP4 gradually decreased correlated with the reduction of TGF-β1 (Figure 4).
Figure 3.
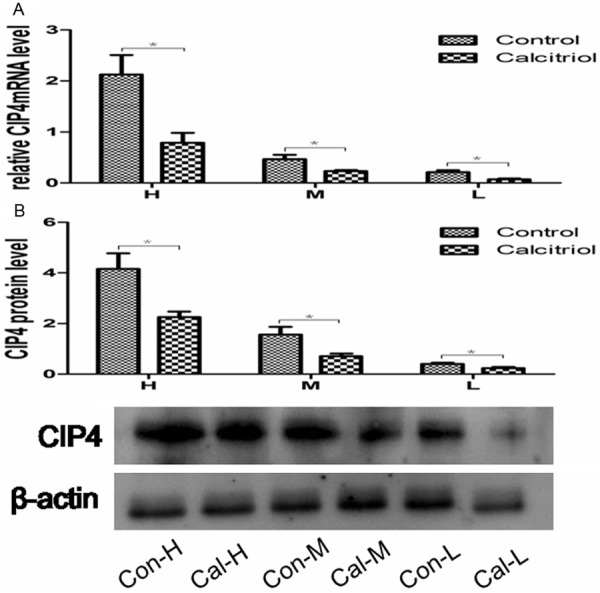
The expression of CIP4 in the kidney tissue. A. Representative RT-PCR analysis for CIP4mRNA expression in the control and calcitriol group. B. Representative Western blot analysis for CIP4 in the control and calcitriol group. *P<0.05 compared with control group. H: control-H and calcitriol-H; M: control-M and calcitriol-M; L: control-L and calcitriol-L.
Figure 4.
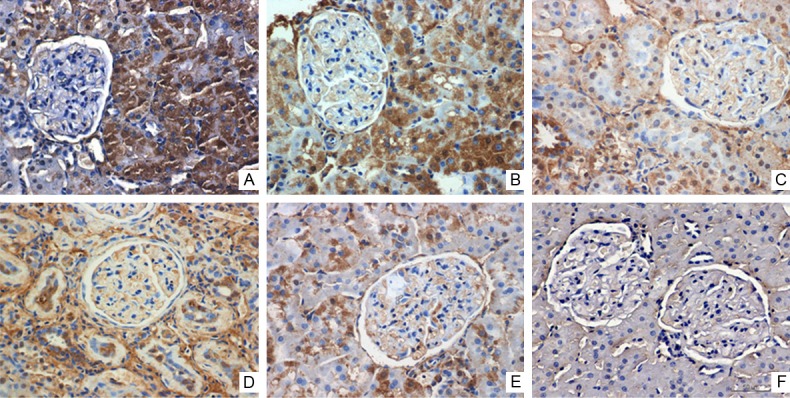
The expression of CIP4 in the kidney tissue. The expression of CIP4 protein was determined with immunohistochemical staining (brown colors indicate CIP4 positive staining). CIP4 immunostaining is strong in the control subgroups and weaker in the calcitriol group (Magnification ×400). A. Control-H; B. Control-M; C. Control-L; D. Calcitriol-H; E. Calcitriol-M; F. Calcitriol-L.
The ultra-structure changes in the control group: in control-H subgroup, the glomerular basement membrane was widened; fine granules were deposited in mesangial; foot projections from podocytes were partially fussed; mesangial cells proliferated. In control-M subgroup, the mesangial matrix increased; swelling, degeneration and necrosis could be seen in mesangial cells; capillary lumens were well opened (Figure 5).
Figure 5.
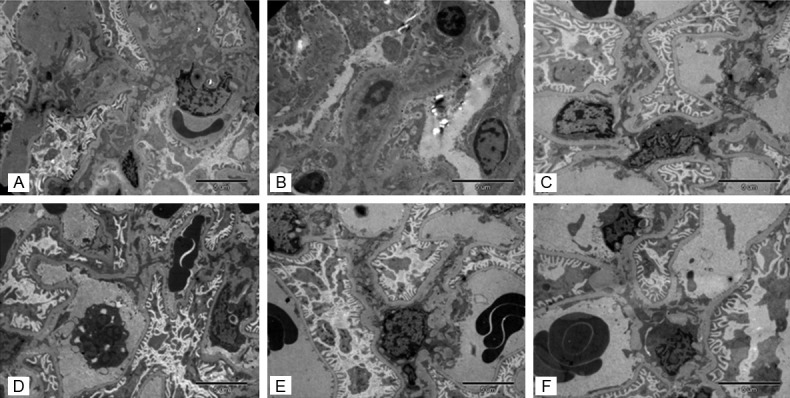
The ultra-structure improved after calcitriol treatment. In control-H subgroup, the glomerular basement membrane was widened; fine granules were deposited in mesangial; foot projections from podocytes were partially fussed; mesangial cells proliferated. In control-M subgroup, the mesangial matrix increased; swelling, degeneration and necrosis could be seen in mesangial cells; capillary lumens were well opened. After treatment with calcitriol, the shape of foot projections in podocytes was improved, the capillary lumens were reopened and the granules deposition in mesangial areas were decreased. A. Control-H; B. Control-M; C. Control-L; D. Calcitriol-H; E. Calcitriol-M; F. Calcitriol-L.
H.E. staining: control-H subgroup showed tubular necrosis, ECM accumulation and vascular basement membrane thickening. Control-M subgroup showed portion of glomerular hypertrophy, mesangial cell proliferation and ECM accumulation. In control-L subgroup, the mesangial matrix is increased slightly (Figure 6). In a whole, more severe pathological changes are associated with higher expression of TGF-β1.
Figure 6.
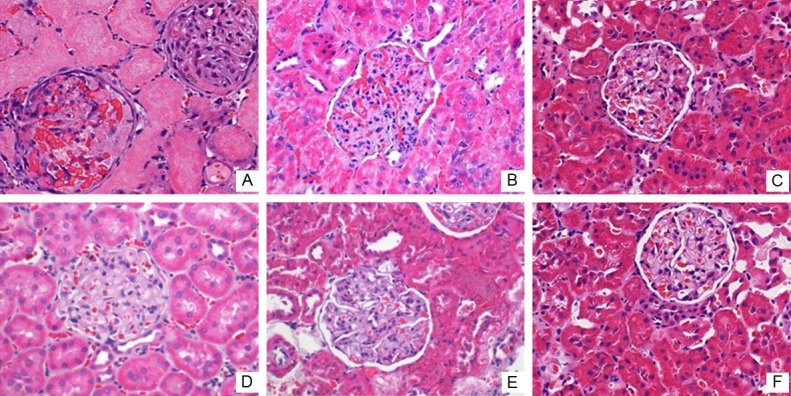
Effects of calcitriol on renal pathology structure. More severe pathological changes are associated with higher expression of TGF-β1.Pathological abnormalities significantly improved after calcitriol treatment (Magnification ×400). A. Control-H; B. Control-M; C. Control-L; D. Calcitriol-H; E. Calcitriol-M; F. Calcitriol-L.
Masson’s trichrome staining: the control subgroups showed a large number of spotty distributed renal interstitial fibrosis. Focal segmental glomerular sclerosis was observed. The increased renal fibrosis is correlated with the up-regulation of TGF-β1 (Figure 7).
Figure 7.
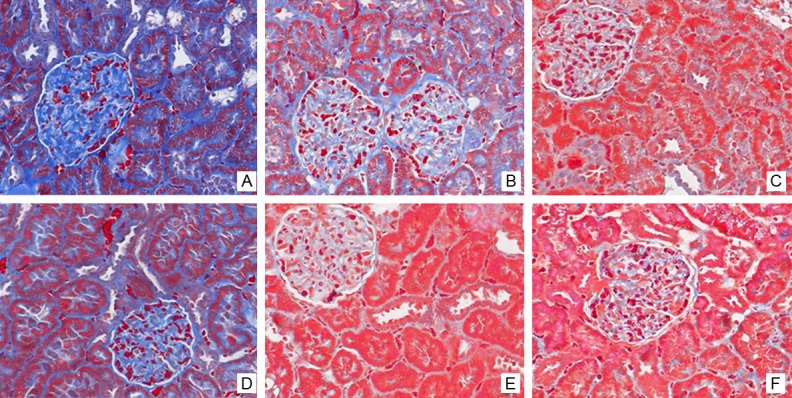
Effects of calcitriol on renal fibrosis. Masson’s trichrome staining of renal tissue. Interstitial fibrosis and glomerular sclerosis (blue area) are extensively observed in the control subgroups. Less interstitial fibrosis was seen after calcitriol treatment. A. Control-H; B. Control-M; C. Control-L; D. Calcitriol-H; E. Calcitriol-M; F. Calcitriol-L.
Biochemical parameters: increased cholesterol and triglyceride was associated with higher expression of TGF-β1. Serum Cr in control-H, control-M and control-L subgroup were 40.8 ± 4.8, 29.5 ± 8.1 and 19.5 ± 2.9 µmol/L, respectively (P <0.05). BUN in the control-H, control-M and control-L subgroup were 9.7 ± 2.1, 7.2 ± 1.6 and 4.3 ± 2.6 mmol/L, respectively (Table 1).
Table 1.
Renal function in the control and calcitriol subgroups
| Groups | n | Bun (mmol/L) | Scr (μmol/L) | Glucose (mmol/L) | Cholesterol (mmol/L) | Triglyceride (mmol/L) |
|---|---|---|---|---|---|---|
| Control-H | 6 | 9.7 ± 2.1 | 40.8 ± 4.8 | 31.6 ± 1.5 | 17.5 ± 0.8 | 10.6 ± 3.0 |
| Calcitriol-H | 6 | 7.3 ± 1.1★ | 20.1 ± 3.1★★ | 24.6 ± 2.1★★ | 6.3 ± 2.3★★ | 3.3 ± 2.8★★ |
| Control-M | 6 | 7.2 ± 1.6 | 29.5 ± 8.1 | 20.6 ± 1.7 | 7.8 ± 1.4 | 5.1 ± 1.7 |
| Calcitriol-M | 6 | 4.8 ± 1.1★ | 17.9 ± 1.2★★ | 17.8 ± 0.9★★ | 4.1 ± 0.7★★ | 2.4 ± 0.7★★ |
| Control-L | 6 | 4.3 ± 2.6 | 19.5 ± 2.9 | 16.6 ± 0.7 | 4.0 ± 1.2 | 1.6 ± 0.7 |
| Calcitriol-L | 6 | 0.8 ± 0.6★★ | 9.8 ± 4.5★★ | 15.0 ± 0.8★★ | 1.5 ± 0.3★★ | 0.4 ± 0.1★★ |
indicates P<0.05, compared to the corresponding control subgroups.
Indicates P<0.01, compared to the corresponding control subgroups.
Calcitriol treatment decreased the expressions of TGF-β1 and CIP4mRNA, improved pathological changes and renal function
TGF-β1: the mRNA and protein levels of TGF-β1 were significantly reduced compared to the corresponding control subgroups (Figure 1). Similarly, immunohistochemical staining confirmed that TGF-β1 was significantly decreased compared to the corresponding control subgroups (Figure 2).
CIP4: the expression mRNA and protein of CIP4 was significantly decreased compared to corresponding control subgroups (Figure 3). Immunohistochemical staining showed the similar results (Figure 4).
Ultra-structure changes: after treatment with calcitriol, the shape of foot projections in podocytes was improved, the capillary lumens were reopened and the granules deposition in mesangial areas were decreased (Figure 5).
Pathological structure changes in HE: the glomerular hypertrophy is decreased after calcitriol treatment, compared to the control subgroups (Figure 6).
Masson’s trichrome staining: less interstitial fibrosis was observed in calcitriol treatment subgroups than the control subgroups (Figure 7).
Biochemical parameters: in calcitriol subgroup, the blood glucose, cholesterol, and triglycerides were significantly decreased compared to corresponding control subgroups. Cr in control-H and calcitriol-H was 40.8 ± 4.8 vs. 20.1 ± 3.1 mmol/L, P<0.05. Cr in control-M and calcitriol-M was 29.5 ± 8.1 vs. 17.9 ± 1.2 mmol/L, P<0.05. Cr in control-L and calcitriol-L was 19.5 ± 2.9 vs. 9.8 ± 4.5 mmol/L, P<0.05. Similar results were found in BUN (Table 1).
Discussion
Our study showed that the higher expression of TGF-β1 and CIP4 is associated with more severe diabetic nephropathy. The expression of TGF-β1 and CIP4, the degree of fibrosis and the levels of cholesterol, triglycerides and creatinine were significantly reduced by calcitriol intervention.
It has been showed that the higher TGF-β1 expression is coupled with aggravated renal pathology and increased renal interstitial fibrosis [17]. Interstitial fibrosis is a known pathological feature of end stage renal disease [19]. Microenvironment changes, mediated by signaling molecule TGF-β1, may result in renal tubular epithelial-mesenchymal transition (EMT) and tubular interstitial fibrosis [20-22]. It has been proved that TGF-β1 is a major mediator in EMT via multiple signaling pathways, such as Smad pathway, mitogen activated protein kinase (MAPK), phosphatidylinositol 3-kinase/AKT (PI3K/AKT) and so on [9,23-25]. After binding to its receptor, TGF-β1 can transmit signals into cells by Smads proteins, induce glomerular and tubular cells hypertrophy, promote ECM accumulation [5], lead to EMT formation and interstitial fibrosis. At the same time, TGF-β1 induced tubular epithelium autophagy and apoptosis can lead to tubular injuries [22]. Another study has shown that TGF-β1 contributes to proteinuria and glomerular sclerosis [26].
Our study showed that the expression of CIP4 was consistent with the expression of TGF-β1. Cdc42 interacting protein-4 (CIP4) belongs to a member of Rho GTPase family and is a downstream signal after Cdc42 in Rho family. CIP4 can directly promote the phosphorylation of multiple signaling molecules, owing to its tyrosine protein kinase activity [27]. Meanwhile, when C-terminal SH3 domain of CIP4 is combined to SH2 domain of phosphatidylinositol 3-kinase (PI3K), the PI3K/AKT pathway could be activated [28]. By this way, EMT occurs [29].
Increasing evidence shows that TGF-β1 promotes the production of CIP4 via PI3K/AKT pathway in renal tubular EMT. In return, CIP4 may further participate in TGF-β1 induced EMT [30]. In this study, the expressions of TGF-β1 and CIP4 are synchronously increased. The higher expressions of two genes were correlated with more severe kidney disease. Therefore, it is speculated that the occurrence and progression of EMT may be regulated by TGF-β1 and CIP4.
Masson’s trichrome staining showed that a large number of collagen fibers were deposited in kidney in the control subgroups. The fibrosis was reduced after intervention of calcitriol. Simultaneously, the expression of TGF-β1 and CIP4 decreased after treatment. Therefore, it is speculated that the improved pathological changes were due to the suppression of TGF-β1 signaling pathway and its downstream mediator CIP4. Enhanced TGF-β1 signaling pathway could result in ECM accumulation, EMT, glomerular hypertrophy and renal interstitial fibrosis.
Another interesting finding is that blood glucose, cholesterol and triglycerides significantly decreased after treatment of calcitriol, suggesting that calcitriol may promote insulin secretion or improve insulin sensitivity, enhance the storage of free fat acid in adipocytes. A study from Asia has shown that low level of Vitamin D is coupled with higher incidence of diabetes mellitus. Supplementary Vitamin D can reduce blood glucose, increase insulin secretion and improve insulin sensitivity [31]. John et al. reported that vitamin D may promote the fatty acid synthesis and lipid storage, and inhibit lipolysis by increasing the calcium level in adipocytes [11,32].
In summary, calcitriol plays a protective role in DN rats via actions against fibrosis and suppression of TGF-β1 and CIP4. Furthermore, calcitriol intervention can decrease serum blood glucose, cholesterol and triglyceride. The possible protective effects in human DN deserve further investigation.
Acknowledgements
This work was supported by Natural science foundation of China grant (No. 8160116). The funders had no role in study design, data collection and analysis, decision to publish, or preparation of the manuscript.
Disclosure of conflict of interest
None.
References
- 1.Kim KH, Kim Y, Gubler MC, Steffes MW, Lane PH, Kashtan CE, Crosson JT, Mauer SM. Structural-functional relationships in Alport syndrome. J Am Soc Nephrol. 1995;5:1659–1668. doi: 10.1681/ASN.V591659. [DOI] [PubMed] [Google Scholar]
- 2.Pagtalunan ME, Miller PL, Jumping-Eagle S, Nelson RG, Myers BD, Rennke HG, Coplon NS, Sun L, Meyer TW. Podocyte loss and progressive glomerular injury in type II diabetes. J Clin Invest. 1997;99:342–348. doi: 10.1172/JCI119163. [DOI] [PMC free article] [PubMed] [Google Scholar]
- 3.Caramori ML, Kim Y, Huang C, Fish AJ, Rich SS, Miller ME, Russell G, Mauer M. Cellular basis of diabetic nephropathy: 1. Study design and renal structural-functional relationships in patients with long-standing type 1 diabetes. Diabetes. 2002;51:506–513. doi: 10.2337/diabetes.51.2.506. [DOI] [PubMed] [Google Scholar]
- 4.White KE, Bilous RW. Type 2 diabetic patients with nephropathy show structural-functional relationships that are similar to type 1 disease. J Am Soc Nephrol. 2000;11:1667–1673. doi: 10.1681/ASN.V1191667. [DOI] [PubMed] [Google Scholar]
- 5.Zhao TT, Zhang HJ, Lu XG, Huang XR, Zhang WK, Wang H, Lan HY, Li P. Chaihuang-Yishen granule inhibits diabetic kidney disease in rats through blocking TGF-beta/Smad3 signaling. PLoS One. 2014;9:e90807. doi: 10.1371/journal.pone.0090807. [DOI] [PMC free article] [PubMed] [Google Scholar]
- 6.Gore-Hyer E, Shegogue D, Markiewicz M, Lo S, Hazen-Martin D, Greene EL, Grotendorst G, Trojanowska M. TGF-beta and CTGF have overlapping and distinct fibrogenic effects on human renal cells. Am J Physiol Renal Physiol. 2002;283:F707–F716. doi: 10.1152/ajprenal.00007.2002. [DOI] [PubMed] [Google Scholar]
- 7.Zheng G, Lyons JG, Tan TK, Wang Y, Hsu TT, Min D, Succar L, Rangan GK, Hu M, Henderson BR, Alexander SI, Harris DC. Disruption of E-cadherin by matrix metalloproteinase directly mediates epithelial-mesenchymal transition downstream of transforming growth factor-beta1 in renal tubular epithelial cells. Am J Pathol. 2009;175:580–591. doi: 10.2353/ajpath.2009.080983. [DOI] [PMC free article] [PubMed] [Google Scholar]
- 8.Li XW, Liu Y, Hao W, Yang JR. Sequoyitol ameliorates diabetic nephropathy in diabetic rats induced with a high-fat diet and a low dose of streptozotocin. Can J Physiol Pharmacol. 2014;92:405–417. doi: 10.1139/cjpp-2013-0307. [DOI] [PubMed] [Google Scholar]
- 9.Zeng R, Han M, Luo Y, Li C, Pei G, Liao W, Bai S, Ge S, Liu X, Xu G. Role of Sema4C in TGF-beta1-induced mitogen-activated protein kinase activation and epithelial-mesenchymal transition in renal tubular epithelial cells. Nephrol Dial Transplant. 2011;26:1149–1156. doi: 10.1093/ndt/gfq619. [DOI] [PMC free article] [PubMed] [Google Scholar]
- 10.Bai S, Zeng R, Zhou Q, Liao W, Zhang Y, Xu C, Han M, Pei G, Liu L, Liu X, Yao Y, Xu G. Cdc42-interacting protein-4 promotes TGF-Beta1-induced epithelial-mesenchymal transition and extracellular matrix deposition in renal proximal tubular epithelial cells. Int J Biol Sci. 2012;8:859–869. doi: 10.7150/ijbs.3490. [DOI] [PMC free article] [PubMed] [Google Scholar]
- 11.Nagpal S, Na S, Rathnachalam R. Noncalcemic actions of vitamin D receptor ligands. Endocr Rev. 2005;26:662–687. doi: 10.1210/er.2004-0002. [DOI] [PubMed] [Google Scholar]
- 12.Mizobuchi M, Morrissey J, Finch JL, Martin DR, Liapis H, Akizawa T, Slatopolsky E. Combination therapy with an angiotensin-converting enzyme inhibitor and a vitamin D analog suppresses the pro-gression of renal insufficiency in uremic rats. J Am Soc Nephrol. 2007;18:1796–1806. doi: 10.1681/ASN.2006091028. [DOI] [PubMed] [Google Scholar]
- 13.Rojas-Rivera J, De La Piedra C, Ramos A, Ortiz A, Egido J. The expanding spectrum of biological actions of vitamin D. Nephrol Dial Transplant. 2010;25:2850–2865. doi: 10.1093/ndt/gfq313. [DOI] [PubMed] [Google Scholar]
- 14.Li YC, Kong J, Wei M, Chen ZF, Liu SQ, LP C. 1,25-Dihydroxyvitamin D3 is a negative endocrine regulator of the renin-angiotensin system. J Clin Invest. 2002;110:229–238. doi: 10.1172/JCI15219. [DOI] [PMC free article] [PubMed] [Google Scholar]
- 15.Tian Y, Lv G, Yang Y, Zhang Y, Yu R, Zhu J, Xiao L, Zhu J. Effects of vitamin D on renal fibrosis in diabetic nephropathy model rats. Int J Clin Exp Pathol. 2014;7:3028–3037. [PMC free article] [PubMed] [Google Scholar]
- 16.Zhang M, Lv XY, Li J, Xu ZG, Chen L. The characterization of high-fat diet and multiple low-dose streptozotocin induced type 2 diabetes rat model. Exp Diabetes Res. 2008;2008:704045. doi: 10.1155/2008/704045. [DOI] [PMC free article] [PubMed] [Google Scholar]
- 17.Zhang N, Gao Y, Zou D, Wang J, Li J, Zhou S, Zhu Z, Zhao X, Xu L, Zhang H. Effects of Chinese Medicine Tong xinluo on Diabetic Nephropathy via Inhibiting TGF- beta 1-Induced Epithelial-to-Mesenchymal Transition. Evid Based Complement Alternat Med. 2014;2014:123497. doi: 10.1155/2014/123497. [DOI] [PMC free article] [PubMed] [Google Scholar]
- 18.Sagar SK, Zhang C, Guo Q, Yi R. Role of expression of endothelin-1 and angiotensin-II and hypoxia-inducible factor-1alpha in the kidney tissues of patients with diabetic nephropathy. Saudi J Kidney Dis Transpl. 2013;24:959–964. doi: 10.4103/1319-2442.118098. [DOI] [PubMed] [Google Scholar]
- 19.Zeisberg M, Neilson EG. Mechanisms of tubulointerstitial fibrosis. J Am Soc Nephrol. 2010;21:1819–1834. doi: 10.1681/ASN.2010080793. [DOI] [PubMed] [Google Scholar]
- 20.Gore-Hyer E, Shegogue D, Markiewicz M, Lo S, Hazen-Martin D, Greene EL, Grotendorst G, Trojanowska M. TGF-beta and CTGF have overlapping and distinct fibrogenic effects on human renal cells. Am J Physiol Renal Physiol. 2002;283:F707–F716. doi: 10.1152/ajprenal.00007.2002. [DOI] [PubMed] [Google Scholar]
- 21.Rastaldi MP. Epithelial-mesenchymal transition and its implications for the development of renal tubulointerstitial fibrosis. J Nephrol. 2006;19:407–412. [PubMed] [Google Scholar]
- 22.Xu Y, Yang S, Huang J, Ruan S, Zheng Z, Lin J. Tgf-beta1 induces autophagy and promotes apoptosis in renal tubular epithelial cells. Int J Mol Med. 2012;29:781–790. doi: 10.3892/ijmm.2012.911. [DOI] [PubMed] [Google Scholar]
- 23.Zeng R, Yao Y, Han M, Zhao X, Liu XC, Wei J, Luo Y, Zhang J, Zhou J, Wang S, Ma D, Xu G. Biliverdin reductase mediates hypoxia-induced EMT via PI3-kinase and Akt. J Am Soc Nephrol. 2008;19:380–387. doi: 10.1681/ASN.2006111194. [DOI] [PMC free article] [PubMed] [Google Scholar]
- 24.Santibanez JF, Quintanilla M, Bernabeu C. TGF-beta/TGF-beta receptor system and its role in physiological and pathological conditions. Clin Sci (Lond) 2011;121:233–251. doi: 10.1042/CS20110086. [DOI] [PubMed] [Google Scholar]
- 25.Andras IE, Toborek M. HIV-1 stimulates nuclear entry of amyloid beta via dynamin dependent EEA1 and TGF-beta/Smad signaling. Exp Cell Res. 2014;323:66–76. doi: 10.1016/j.yexcr.2014.01.027. [DOI] [PMC free article] [PubMed] [Google Scholar]
- 26.Chen HY, Huang XR, Wang W, Li JH, Heuchel RL, Chung AC, Lan HY. The protective role of Smad7 in diabetic kidney disease: mechanism and therapeutic potential. Diabetes. 2011;60:590–601. doi: 10.2337/db10-0403. [DOI] [PMC free article] [PubMed] [Google Scholar]
- 27.Fricke R, Gohl C, Dharmalingam E, Grevelhorster A, Zahedi B, Harden N, Kessels M, Qualmann B, Bogdan S. Drosophila Cip4/Toca-1 integrates membrane trafficking and actin dynamics through WASP and SCAR/WAVE. Curr Biol. 2009;19:1429–1437. doi: 10.1016/j.cub.2009.07.058. [DOI] [PubMed] [Google Scholar]
- 28.Leibfried A, Fricke R, Morgan MJ, Bogdan S, Bellaiche Y. Drosophila Cip4 and WASp define a branch of the Cdc42-Par6-aPKC pathway regulating E-cadherin endocytosis. Curr Biol. 2008;18:1639–1648. doi: 10.1016/j.cub.2008.09.063. [DOI] [PubMed] [Google Scholar]
- 29.Itoh T, Hasegawa J, Tsujita K, Kanaho Y, Takenawa T. The tyrosine kinase Fer is a downstream target of the PLD-PA pathway that regulates cell migration. Sci Signal. 2009;2:ra52. doi: 10.1126/scisignal.2000393. [DOI] [PubMed] [Google Scholar]
- 30.Bai S, Zeng R, Zhou Q, Liao W, Zhang Y, Xu C, Han M, Pei G, Liu L, Liu X, Yao Y, Xu G. Cdc42-interacting protein-4 promotes TGF-Beta1-induced epithelial-mesenchymal transition and extracellular matrix deposition in renal proximal tubular epithelial cells. Int J Biol Sci. 2012;8:859–869. doi: 10.7150/ijbs.3490. [DOI] [PMC free article] [PubMed] [Google Scholar]
- 31.Flores M. A role of vitamin D in low-intensity chronic inflammation and insulin resistance in type 2 diabetes mellitus? Nutr Res Rev. 2005;18:175–182. doi: 10.1079/NRR2005104. [DOI] [PubMed] [Google Scholar]
- 32.Bikle D. Nonclassic actions of vitamin D. J Clin Endocrinol Metab. 2009;94:26–34. doi: 10.1210/jc.2008-1454. [DOI] [PMC free article] [PubMed] [Google Scholar]