

Abstract
Transient elastography (TE) is a novel, non-invasive imaging technique for measuring liver stiffness (LS). It is considered to be useful for predicting the severity of fibrosis and the risk of cirrhosis or hepatocellular carcinoma. However, the association between the presence of diffuse regions of increased cell density in the liver and elevated LS values has not been assessed. We experienced a case in which a mature T-cell neoplasm had invaded the liver, but the infiltrating lesion was not detected by contrast-enhanced computed tomography (CT) or fluorodeoxyglucose positron emission tomography/CT scans. Instead, the tumor’s presence was indicated by the change in the patient’s TE-derived LS values after chemotherapy. At diagnosis liver dysfunction was detected in a biochemical examination, and mean LS value was as high as 25.4 kPa [interquartile range (IQR): 0.3, success rate (SR):100%]. After chemotherapy, the patient’s mean LS value fell to 4.3 kPa (IQR: 0.8, SR:100%). A follow-up pathological investigation demonstrated that proliferating abnormal T-cells were no longer present in the patient’s liver. This is the first report to describe the use of LS data to support a diagnosis of liver infiltration by tumor cells exhibiting a portal and sinusoidal distribution pattern rather than a focal pattern. Elevated TE-derived LS values should lead to hepatic tumor infiltration being considered during initial examinations or a suspicion of recurrence during follow-up examination of lymphoma patients who achieve complete remission, even when radiological investigations do not detect abnormalities in the liver.
Keywords: Transient elastography, liver stiffness, liver infiltration, and mature T-cell neoplasm
Introduction
Acute idiopathic hepatic dysfunction is often seen in patients with malignant lymphoma or acute leukemia. In patients in whom focal intrahepatic lesions are detected using fluorodeoxyglucose (FDG)-positron emission tomography/computed tomography (PET/CT), CT, or magnetic resonance imaging (MRI), tumor infiltration into the liver is easy to diagnose. In patients without nodular hepatic lesions, such diagnostic techniques will not detect abnormal findings; however, clinicians might still be unsure about whether a liver biopsy should be performed because tumor invasion of the liver accompanied by nodal lesions represents stage IV disease, especially in patients with malignant lymphoma, and so must not be missed. Therefore, a non-invasive diagnostic technique that would help to determine the appropriateness of liver biopsy would be useful. We experienced a case in which a mature T-cell neoplasm (MTN) had invaded the liver, but the infiltrating lesion was not detected by contrast-enhanced CT or FDG-PET/CT scans. Instead, the tumor’s presence was indicated by the change in the patient’s transient elastography (TE)-derived liver stiffness (LS) values after chemotherapy.
TE is a novel, rapid, and non-invasive imaging method that can be used to assess LS [1-4]. It was first developed to evaluate chronic hepatitis C patients [1] and has been suggested to be useful for predicting the severity of fibrosis and the risk of cirrhosis [2-4]. However, other conditions can also increase LS such as the accumulation of inflammatory cells (which is seen in various types of hepatitis) [5] or amyloidosis [6]. Furthermore, TE-derived LS measurements have been reported to be useful for predicting hepatocellular carcinoma [7-10]. The association between diffuse regions of increased cell density in the liver and elevated LS values has not been fully elucidated. We hypothesized that the higher the density of diffusely distributed proliferating tumor cells in the liver, the higher the patient’s LS values will be. In addition, we considered that TE might be useful for assessing liver infiltration by lymphoma, leukemia, etc.
Case report
A 75-year-old man was admitted to our hospital with leukocytosis and gastric ulceration. He had also diabetes mellitus and systemic peripheral lymphadenopathies. A peripheral blood (PB) examination detected leukocytosis and thrombocytopenia. The patient had a white blood cell count of 55.7 × 10⁹/l, including 50% atypical lymphocytes, which were found to be medium to large lymphoid “flower cells” with many nuclear convolutions and lobules (data for PB not shown). Flow cytometry (FCM) demonstrated that the atypical cells were negative for CD7 and CD8, but positive for CD2, CD3, CD4, CD5, and CD25. In addition, the patient exhibited a hemoglobin level of 15.8 g/dl and a platelet count of 7.9 × 10⁹/l. A biochemical examination produced the following abnormal results: alkaline phosphatase (ALP): 801 IU/l, aspartate transaminase (AST): 101 IU/l, alanine aminotransferase (ALT): 88 IU/l, lactate dehydrogenase (LDH): 1130 IU/l, calcium (Ca): 12.8 mg/dl, and soluble interleukin-2 receptor (sIL-2R): 19855 U/ml. The patient’s serum human T-cell leukemic virus-1 (HTLV-1) antibody level was more than 8192 times higher than normal. Bone marrow (BM) aspiration followed by a biopsy examination of the collected sample detected infiltrating atypical lymphocytes, as was seen in the PB (Figure 1). T-cell receptor (TCR) Cβ1 gene analysis using southern blotting detected gene rearrangement in the BM. A contrast-enhanced CT scan depicted systemic lymphadenopathies, slight pleural effusion, and splenomegaly, but did not detect focal hepatic lesions (Figure 2A). During upper gastrointestinal endoscopy, extensive ulceration was observed in the gastric fornix. A gadolinium-ethoxybenzyl-diethylene-triamine-pentaacetic acid (Gd-EOB-DTPA)-enhanced MRI was not conducted. Abdominal ultrasonography (US) detected splenomegaly, but did not find any lesions in the liver. TE demonstrated that the patient had an LS value of 25.4 kPa [interquartile range (IQR): 0.3, success rate (SR): 100%]. The spleen stiffness value was not evaluated. We conducted a liver biopsy to investigate the cause of these high LS values. Written informed consent was obtained before the biopsy. A pathological examination of the patient’s liver tissue detected abnormal proliferating T-cells around portal tracts and within sinusoids; however, no signs of cirrhosis or fibrosis were observed (Figure 3A-D). FCM and TCR Cβ1 gene analysis involving southern blotting analyses of the liver (Figure 4A and 4B, respectively) and gastric tissues obtained the same abnormal findings, as were found in the BM. The patient’s gastric tissues were examined for the monoclonal integration of HTLV-1, but no definitive findings could be obtained, as too few cells were available. As a result, the patient was clinically diagnosed with adult T-cell leukemia/lymphoma, acute type, although the diagnosis was not supported by conclusive evidence, as mentioned above. Four days later, he was treated with the pirarubicin, cyclophosphamide, vincristine, and prednisolone (THP-COP) regimen. An FDG-PET/CT scan was conducted on the third day after the initiation of chemotherapy. Ideally, it would have been conducted sooner, but this was the first point at which the FDG-PET/CT scanner was available. At the time of the FDG-PET/CT scan, the patient’s serum glucose level was 254 mg/dl, despite the fact that he had not eaten or drank anything for more than 6 hours. However, the FDG-PET/CT scan only detected significantly intense FDG uptake (maximum standardized uptake value: 3.2) in the intra-abdominal lymph nodes, even though systemic lymphadenopathies had been observed on a contrast-enhanced CT scan, and no FDG uptake was seen in the liver (Figure 2B).
Figure 1.
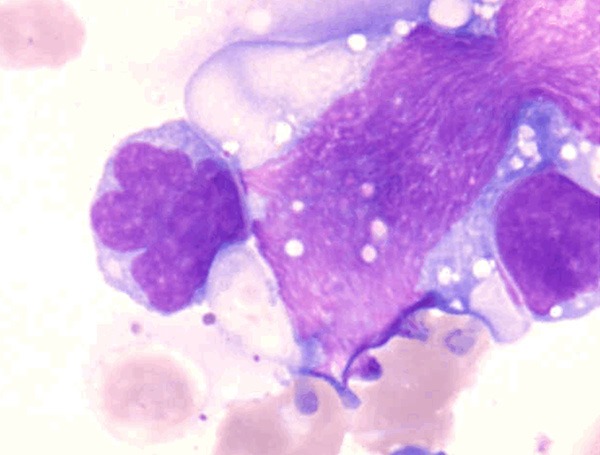
Bone marrow smear taken at the initial diagnosis. Medium to large lymphoid “flower cells” with many nuclear convolutions and lobules (May-Giemsa staining) were seen.
Figure 2.

A. A contrast-enhanced computed tomography scan did not detect any focal hepatic lesions. B. A fluorodeoxyglucose (FDG)-positron emission tomography/computed tomography scan did not detect FDG uptake in the liver.
Figure 3.

Liver biopsy specimens obtained before (A-D) and after 6 cycles of chemotherapy (E, F). (A) Abnormal proliferating T-cells were detected around the portal tracts (short arrow) and within sinusoids (long arrow) (hematoxylin-eosin (HE) stain). (B) Abnormal T-cells had infiltrated into the sinusoids (bold arrow) (HE stain). (C and D) Immunohistochemistry for CD3 detected abnormal proliferating T-cells around the portal tracts (short arrow) and within sinusoids (long arrow). (E and F) The abnormal T-cells disappeared after 6 cycles of chemotherapy (HE stain).
Figure 4.

A. Two-color flow cytometric analysis of the tumor cells in the patient’s liver. Two-color flow cytometric analysis of the tumor cells in the patient’s liver was performed using fluorescein isothiocyanate-conjugated monoclonal antibodies and phycoerythrin-conjugated monoclonal antibodies and fluorescence-activated cell sorting at the initial diagnosis. It showed that the tumor cells were negative for CD7, CD8 and CD20, but positive for CD2, CD3, CD4 and CD5. B. Southern blot analysis of TCR Cβ1. The three left-sided lanes contain the germline controls, and the right-sided lanes contain samples of the patient’s DNA collected at the initial diagnosis. The bold arrows in the right-sided lanes indicate identical T-cell clones. Lane 1, BamHI digested; Lane 2, EcoRV digested; Lane 3, HindIII digested. Southern blot analysis of TCR Cβ1 of the liver detected gene rearrangement.
Over the next few days, the patient’s clinical findings steadily improved, and the flower cells in his PB also disappeared. After 6 cycles of THP-COP, a contrast-enhanced CT scan showed that all of the lymphadenopathies had markedly reduced in size, and the patient’s sIL-2R level had decreased to within the normal range (440 U/ml). The patient’s serum ALP, AST, ALT, and LDH levels had also improved to within the normal range. A follow-up TE scan was performed, which demonstrated that his mean LS value had fallen to 4.3 kPa (IQR: 0.8, SR: 100%). A second liver biopsy was also conducted, and a pathological examination of the biopsy specimen demonstrated that proliferating abnormal T-cells were no longer present in the patient’s sinusoids or around his portal tracts (Figure 3E, 3F). Written informed consent was obtained before the latter examinations. FCM analysis did not detect any abnormal T-cell patterns, and no TCR Cβ1 gene rearrangement was observed during southern blotting analysis of the same specimen.
Discussion
We experienced a case of liver infiltration by an MTN, in which the infiltrating lesion was not detected by contrast-enhanced CT or FDG-PET/CT, but rather was indicated by a change in the patient’s TE-derived LS values after chemotherapy. This is the first report to describe the use of LS values to support a diagnosis of liver infiltration by tumor cells exhibiting a portal and sinusoidal distribution pattern (instead of a focal distribution pattern).
Since the initial report in which the use of TE-derived LS values to quantify liver fibrosis was first described [1], many studies have validated this method as a tool for diagnosing liver fibrosis and cirrhosis [2-4]. The main advantages of TE are that it is a rapid, non-invasive, and reproducible way of measuring LS. LS is increased in the acute phases of all forms of hepatitis independent of the degree of fibrosis [5]. Although such changes have been suggested to be associated with inflammation, this is disputed. In addition, LS is also increased by other conditions such as tumors, mechanical cholestasis [11], liver congestion [12], and amyloidosis [6]. Therefore, it is difficult to differentiate between the various possible differential diagnoses based on TE findings alone, and examiners should be aware that LS data can often be interpreted in multiple ways. In the present case, the patient did not have a clinical history of liver disease, e.g., viral hepatitis C, chronic cirrhosis, or alcoholic liver disease. Furthermore, findings seen in amyloidosis, for examples, proteinuria, peripheral neuropathy, refractory diarrhea, and hematochezia had not been detected. Accordingly, hepatic tumor infiltration was strongly suspected to be the cause of the patient’s high TE-derived LS values.
Using TE, Masuzaki et al. found that hepatocellular carcinoma and cholangiocellular carcinoma were associated with median LS values of 55 kPa and 73.9 kPa, respectively. In addition, a case of malignant lymphoma involving a liver tumor that measured more than 5 cm in diameter exhibited an LS value of 16.9 kPa [13]. These findings suggest that focal lesions are stiffer due to increased tumor cell proliferation. In the present case, a pathological examination of the liver specimen obtained before chemotherapy detected marked proliferation of abnormal T-cells both around the portal tracts and within sinusoids. Neoplastic infiltration into the liver usually exhibits a portal, nodular/lobular, sinusoidal, or mixed microtopographical distribution [14]. A pathological examination determined that the liver infiltration in the present case exhibited portal and sinusoidal distribution patterns. Liver infiltration involving focal lesions can be detected using US, CT, MRI, or FDG-PET/CT, but cases of liver infiltration involving portal and/or sinusoidal patterns cannot be detected using such techniques. In our case, no findings that were suggestive of liver infiltration such as focal liver lesions were detected by US or contrast-enhanced CT. As for the reasons why FDG-PET/CT did not detect the liver invasion in the present case, we suggest the following as possible explanations: 1) The FDG-PET/CT scan was conducted 3 days after the start of chemotherapy; therefore, it is possible that many of the tumor cells had already been killed. 2) The patient’s serum glucose level at the time of the FDG-PET/CT scan was 254 mg/dl despite the fact that he had not consumed anything for more than 6 hours, which might have reduced the amount of FDG taken up by the tumor. Of all of the non-invasive diagnostic methods we used, only TE was able to detect the liver invasion seen in the present case. Moreover, after 6 cycles of chemotherapy TE showed that the patient’s LS value had normalized, and FCM, southern blotting analysis, and a pathological examination confirmed the disappearance of tumor cells from the patient’s liver.
How should TE be used in clinical practice in the hemato-oncological field? First, in malignant lymphoma patients with only nodal lesions and hepatic dysfunction who do not exhibit abnormal liver findings during radiological investigations, the detection of elevated TE-derived LS values in a patient with no history of liver disease might be suggestive of liver infiltration by lymphoma, and such findings could become an indication for liver biopsy. Second, if sudden hepatic dysfunction was detected in biochemical examinations performed during the follow-up of a malignant lymphoma patient who was considered to be in complete remission, the subsequent detection of higher TE-derived LS values could lead to a suspicion of relapsed hepatic lymphoma, even in the absence of abnormal lesions on CT, Gd-EOB-DTPA-MRI or FDG-PET/CT scans. From this point of view, elevated TE-derived LS values could become an indication for liver biopsy. However, it must be noted that TE should not be used alone to determine whether liver biopsy should be performed in cases of suspected hepatic tumor infiltration because there are various other causes of elevated LS values.
In conclusion, although this report suggests that elevated TE-derived LS values before chemotherapy are indicative of tumor infiltration-induced LS, a large scale, prospective study involving patients with various types of malignant lymphoma, leukemia, or MTN is needed to substantiate our observations.
Disclosure of conflict of interest
None.
References
- 1.Sandrin L, Fourquet B, Hasquenoph JM, Yon S, Fournier C, Mal F, Christidis C, Ziol M, Poulet B, Kazemi F, Beaugrand M, Palau R. Transient elastography: a new noninvasive method for assessment of hepatic fibrosis. Ultrasound Med Biol. 2003;29:1705–13. doi: 10.1016/j.ultrasmedbio.2003.07.001. [DOI] [PubMed] [Google Scholar]
- 2.Talwalkar JA, Kurtz DM, Schoenleber SJ, West CP, Montori VM. Ultrasound-based transient elastography for the detection of hepatic fibrosis: systematic review and meta-analysis. Clin Gastroenterol Hepatol. 2007;5:1214–20. doi: 10.1016/j.cgh.2007.07.020. [DOI] [PubMed] [Google Scholar]
- 3.Castera L, Vergniol J, Foucher J, Le Bail B, Chanteloup E, Haaser M, Darriet M, Couzigou P, De Lédinghen V. Prospective comparison of transient elastography, Fibrotest, APRI, and liver biopsy for the assessment of fibrosis in chronic hepatitis C. Gastroenterology. 2005;128:343–50. doi: 10.1053/j.gastro.2004.11.018. [DOI] [PubMed] [Google Scholar]
- 4.Ziol M, Handra-Luca A, Kettaneh A, Christidis C, Mal F, Kazemi F, de Lédinghen V, Marcellin P, Dhumeaux D, Trinchet JC, Beaugrand M. Noninvasive assessment of liver fibrosis by measurement of stiffness in patients with chronic hepatitis C. Hepatology. 2005;41:48–54. doi: 10.1002/hep.20506. [DOI] [PubMed] [Google Scholar]
- 5.Arena U, Vizzutti F, Corti G, Ambu S, Stasi C, Bresci S, Moscarella S, Boddi V, Petrarca A, Laffi G, Marra F, Pinzani M. Acute viral hepatitis increases liver stiffness values measured by transient elastography. Hepatology. 2008;47:380–4. doi: 10.1002/hep.22007. [DOI] [PubMed] [Google Scholar]
- 6.Lanzi A, Gianstefani A, Mirarchi MG, Pini P, Conti F, Bolondi L. Liver AL amyloidosis as a possible cause of high liver stiffness values. Eur J Gastroenterol Hepatol. 2010;22:895–7. doi: 10.1097/MEG.0b013e3283309d5b. [DOI] [PubMed] [Google Scholar]
- 7.Masuzaki R, Tateishi R, Yoshida H, Sato S, Kato N, Kanai F, Sugioka Y, Ikeda H, Shiina S, Kawabe T, Omata M. Risk assessment of hepatocellular carcinoma in chronic hepatitis C patients by transient elastography. J Clin Gastroenterol. 2008;42:839–43. doi: 10.1097/mcg.0b013e318050074f. [DOI] [PubMed] [Google Scholar]
- 8.Masuzaki R, Tateishi R, Yoshida H, Goto E, Sato T, Ohki T, Imamura J, Goto T, Kanai F, Kato N, Ikeda H, Shiina S, Kawabe T, Omata M. Prospective risk assessment for hepatocellular carcinoma development in patients with chronic hepatitis C by transient elastography. Hepatology. 2009;49:1954–61. doi: 10.1002/hep.22870. [DOI] [PubMed] [Google Scholar]
- 9.Akima T, Tamada M, Hiraishi H. Liver stiffness measured by transient elastography is a predictor of hepatocellular carcinoma development in viral hepatitis. Hepatol Res. 2011;41:965–70. doi: 10.1111/j.1872-034X.2011.00846.x. [DOI] [PubMed] [Google Scholar]
- 10.Nakao H, Yoneda M. Liver stiffness measurement using transient elastography and hepatocellular carcinoma. Hepatol Res. 2011;41:921–24. doi: 10.1111/j.1872-034X.2011.00895.x. [DOI] [PubMed] [Google Scholar]
- 11.Millonig G, Reimann FM, Friedrich S, Fonouni H, Mehrabi A, Büchler MW, Seitz HK, Mueller S. Extrahepatic cholestasis increases liver stiffness (Fibroscan) irrespective of fibrosis. Hepatology. 2008;48:1718–23. doi: 10.1002/hep.22577. [DOI] [PubMed] [Google Scholar]
- 12.Millonig G, Friedrich S, Adolf S, Fonouni H, Golriz M, Mehrabi A, Stiefel P, Pöschl G, Büchler MW, Seitz HK, Mueller S. Liver stiffness is directly influenced by central venous pressure. J Hepatol. 2010;52:206–10. doi: 10.1016/j.jhep.2009.11.018. [DOI] [PubMed] [Google Scholar]
- 13.Masuzaki R, Tateishi R, Yoshida H, Sato T, Ohki T, Goto T, Yoshida H, Sato S, Sugioka Y, Ikeda H, Shiina S, Kawabe T, Omata M. Assessing liver tumor stiffness by transient elastography. Hepatol Int. 2007;1:394–97. doi: 10.1007/s12072-007-9012-7. [DOI] [PMC free article] [PubMed] [Google Scholar]
- 14.Baumhoer D, Tzankov A, Dirnhofer S, Tornillo L, Terracciano LM. Patterns of liver infiltration in lymphoproliferative disease. Histopathology. 2008;53:81–90. doi: 10.1111/j.1365-2559.2008.03069.x. [DOI] [PubMed] [Google Scholar]