
Fig. 6. Relationship between CXCL12/CXCR4 axis and PNI of pancreatic cancer in vivo.
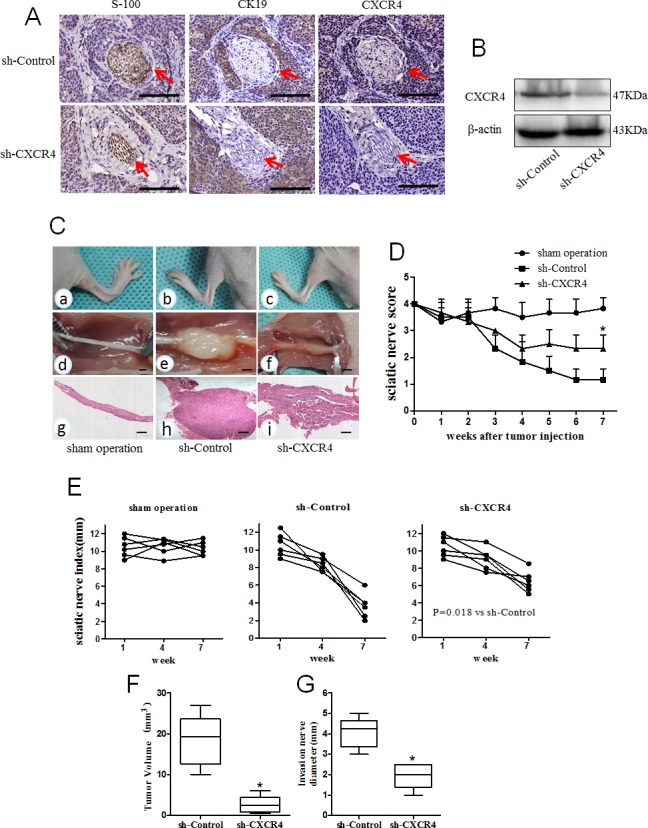
(A) Microscopic findings in mouse PNI models. Immunohistochemical staining of S100 (nerve tissue marker), CK19 (cancer cell marker) and CXCR4 were used to evaluate PNI in vivo neural invasion model. The tumor cells of sh-Control were arranged around nerves (the nerve indicated by red arrowheads). In contrast, sh-CXCR4 derived tumors exhibited no interaction between the tumor cells and nerves (Scale bar, 1mm); (B) Western blot of the resected tumors in mouse PNI models revealed a stable CXCR4 gene knockdown effect in sh-CXCR4 compared with sh-Control. MiaPaCa-2-shControl (n=6) and MiaPaCa-2-shCXCR4 (n=6) cells were implanted in a distal part of the left sciatic nerve, the right sciatic nerve served as a sham operation control (injected with saline, n=6). (C) Representative images of the spread length (in mm) between the first and fifth toes of the mouse hind limbs (a-c), xenograft tumor in situ of the sciatic nerve (d-f) and corresponding HE staining (g-i, 40× magnification) in different treatment groups (Scale bar, 1mm). (D) The mean left sciatic nerve scores in different groups were measured weekly for 7 weeks (*P< 0.05 vs. sh-Control). The sciatic nerve indexes (paw span in mm) (E) in sham operation group; (F) MiaPaCa-2-shControl group and (G) MiaPaCa-2-shCXCR4 group (P=0.018 vs. sh-Control) were measured at 1, 4, and 7 weeks after injection. The tumor volume (H) and invasion nerve diameter (I) were measured in sh-Control and the sh-CXCR4 groups (P values were determined by ANOVA, *P<0.05 vs. sh-Control).