Abstract
We report that the IgH 3′ regulatory region (3′RR) has no role on μ chain transcription and pre-BCR expression in B cell progenitors. In contrast, analysis of heterozygous IgH aΔ3′RR/bwt mice indicated that the 3′RR controls μ chain transcripts in mature splenocytes and impacts membrane IgM density without obvious effect on BCR signals (colocalisation with lipid rafts and phosphorylation of Erk and Akt after BCR crosslinking). Deletion of the 3′RR modulates the B cell fate to less marginal zone B cells. In conclusion, the 3′RR is dispensable for pre-BCR expression and necessary for optimal commitments toward the marginal zone B cell fate. These results reinforce the concept of a dual regulation of the IgH locus transcription and accessibility by 5′ elements at immature B cell stages, and by the 3′RR as early as the resting mature B cell stage and then along further activation and differentiation.
Keywords: BCR, B cell fate, IgH 3′ regulatory enhancers, knock-out mice
INTRODUCTION
Lymphopoiesis is coupled with programmed accessibility of Ig genes to transcription and to several major transcription-dependent DNA remodelling events [1, 2]. While 5′ cis-regulatory elements (Eμ and IGCR1) control V(D)J recombination [2–4], the IgH 3′ regulatory region (3′RR) controls class switch recombination (CSR) [2, 5] and IgH somatic hypermutation (SHM) [6]. B cells are continuously instructed by B cell receptor (BCR) signals to make crucial cell fate decisions at several checkpoints during their development [7, 8]. Such an important choice made by immature B cells is to become either a follicular (FO) or a marginal zone (MZ) B cell. Influence of the BCR strength on B cell fate has been investigated by various experimental approaches (such as mutations affecting BCR components and proteins implicated in BCR signalling) both affecting pre-BCR and BCR signals and thus resulting in multiple anomalies at various stages of B cell maturation [7, 8]. The commonly accepted hypothesis is that the BCR strength controls B cell fate with weak BCR signalling inducing MZ B cell development while strong BCR signalling favours the development of FO B cells [7, 8]. We studied heterozygous IgH aΔ3′RR/bwt mice. We report that the 3′RR has no role on the pre-BCR expression but governs μ gene transcription and thus BCR expression specifically in mature B cells where its deletion affects the B cell fate toward less MZ B cells.
RESULTS AND DISCUSSION
Expression of a 3′RR-deleted allele in bone marrow B cells
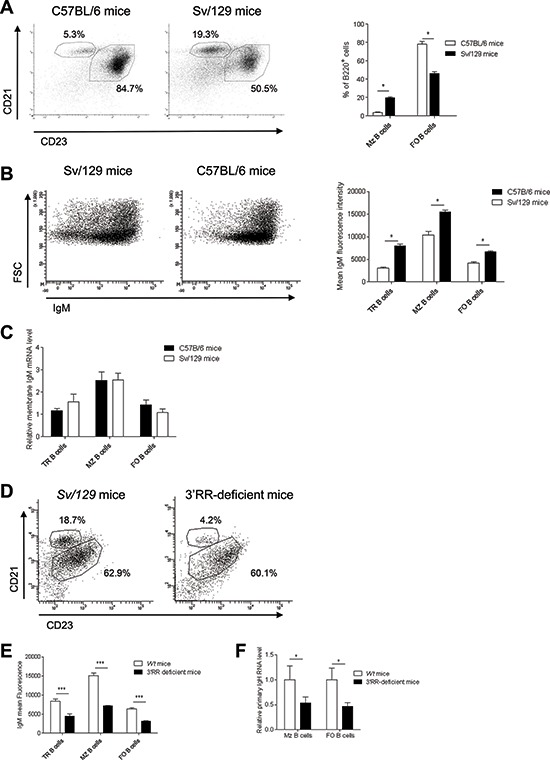
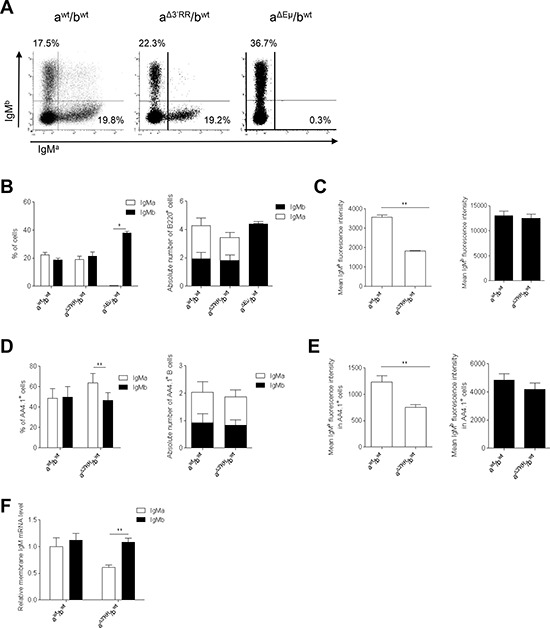
Mouse substrains have dissimilar differentiation programs culminating in different B cell fate and BCR expression [9] (Figure 1). To assess B cell differentiation issues linked to genetic background, our study was carried out in heterozygous IgH aΔ3′RR/bwt mice, compared to wt F1 IgH awt/bwt mice. Analysis of bone marrow B cells with IgM-allotype specific antibodies indicated similar percentages and numbers of B cells expressing either a or b allotype in aΔ3′RR/bwt and awt/bwt mice; as a negative control IgMa-expressing B cells were not detected in mice carrying heterozygous deletion of the Eμ region (aΔEμ/bwt) [10] (Figure 2A and 2B). The mean membrane IgMa (but not IgMb) density was reduced in heterozygous aΔ3′RR/bwt compared to awt/bwt mice (Figure 2C). Analysis of immature B220+AA4.1+ B cells indicated a slight increase of the percentage (but not the numbers) of cells expressing the a allotype in heterozygous aΔ3′RR/bwt mice (Figure 2D). A decreased membrane IgMa (but not IgMb) density was found in heterozygous aΔ3′RR/bwt mice compared to awt/bwt mice (Figure 2E). Finally, real time PCR analysis indicated a reduced transcription of the a allele (but not b) in B220+AA4.1+ sorted B cells from aΔ3′RR/bwt mice compared to awt/bwt mice (Figure 2F). Taken altogether these results are indications that the 3′RR-deficient allele underwent V(D)J recombination at a rate and a timeframe similar to the wt allele. Indeed any delay in IgH chain expression from the mutated allele would be expected to result in unbalanced expression of IgH alleles in immature B cells from heterozygous mice (as found with the aΔEμ allele) [10]. Bone marrow IgMaΔ3′RR B cells had a lower IgH transcription and membrane IgM expression confirming an early 3′RR transcriptional control immediately after the pre-B cell stage [11]. The slight accumulation of newly formed IgMaΔ3′RR B cells may imply a B cell fate decision defect.
Figure 1. B cell fate and IgM expression in C57BL/6 and Sv/129 mice.

(A) Left part - flow cytometry analysis of follicular (FO) B cells (B220+CD21lowCD23high) and marginal zone (MZ) B cells (B220+CD21highCD23low) in spleen of C57BL/6 (IgH bwt/bwt) and Sv/129 (IgH awt/awt) wt mice. Cells were gated on B220+ cells. One representative experiment of three Sv/129 and seven C57BL/6 mice is shown. Right part - percentage of splenic FO and MZ B cells. Mean ± SEM of three and seven values for Sv/129 and C57BL/6 mice, respectively. *p < 0.05 (Mann-Whitney U-test). (B) Left part - flow cytometry analysis of B220+IgM+ B cells in spleen of C57BL/6 and Sv/129 mice. One representative experiment of three Sv/129 and seven C57BL/6 mice is shown. Cells were gated on B220+ cells. The anti-IgM labelled antibody binds both the a and the b allotypes. Right part - Mean IgM intensities on FO, MZ and transitional (TR, B220+AA4.1+) B cells in spleen of Sv/129 and C57BL/6 mice. Mean ± SEM of three and seven values for Sv/129 and C57BL/6 mice, respectively. *p < 0.05 (Mann-Whitney U-test). (C) Similar μ transcription in sorted TR, FO and MZ B cells of Sv/129 and C57BL/6 mice. Mean ± SEM of 5 mice. Values were normalized to GAPDH transcripts. (D) Flow cytometry analysis of FO and MZ B cells in spleen of homozygous 3′RR-deficient mice (IgH aΔ3′RR/aΔ3′RR) and Sv/129 (IgH awt/awt) mice. Cells were gated on B220+ cells. One representative experiment out of six is shown. (E) Percentages of splenic TR, FO and MZ B cells in 3′RR-deficient mice and Sv/129 mice. Mean ± SEM of six mice. *p < 0.001 (Mann-Whitney U-test). (F) Real time PCR analysis of primary IgH transcripts in sorted FO and MZ B cells of 3′RR-deficient mice and Sv/129 mice. Mean ± SEM of five mice. *p < 0.05 (Mann-Whitney U-test). Values were normalised to GAPDH transcripts.
Figure 2. Expression of a 3′RR-deleted allele in bone marrow B cells.

(A) Flow cytometry analysis of IgMa and IgMb on B220+ bone marrow cells of heterozygous aΔ3′RR/bwt, awt/bwt and aΔEμMARs/bwt mice. One representative experiment out of ten is shown for aΔ3′RR/bwt and awt/bwt mice. One representative experiment out of four is shown for aΔEμMARs/bwt mice. Cells were gated on B220+ cells. (B) Percentages (left part) and numbers (right part) of B220+ bone marrow B cells expressing the a or b allele in aΔ3′RR/bwt, awt/bwt and aΔEμMARs/bwt mice. Mean ± SEM of ten aΔ3′RR/bwt mice, ten awt/bwt and four aΔEμMARs/bwt mice. Millions of bone marrow B cells are reported. *p < 0.05 (Mann-Whitney U-test). (C) IgMa and IgMb fluorescence intensity on B220+ B cells of aΔ3′RR/bwt and awt/bwt mice. Mean ± SEM of ten mice. **p < 0.01 (Mann-Whitney U-test). (D) Percentages (left part) and numbers (right part) of B220+AA4.1+ bone marrow B cells in aΔ3′RR/bwt and awt/bwt mice. Mean ± SEM of ten mice. **p < 0.01 (Mann-Whitney U-test). (E) IgMa and IgMb fluorescence intensity on B220+AA4.1+ bone marrow B cells in aΔ3′RR/bwt and awt/bwt mice. Mean ± SEM of ten mice. **p < 0.01 (Mann-Whitney U-test). (F) Real time PCR analysis of μ membrane transcripts in sorted B220+AA4.1+ bone marrow B cells of aΔ3′RR/bwt and awt/bwt mice. Values were normalized to GAPDH transcripts. Mean ± SEM of six mice. *p < 0.05 (Mann-Whitney U-test).
Expression of a 3′RR-deleted allele in peripheral B cells
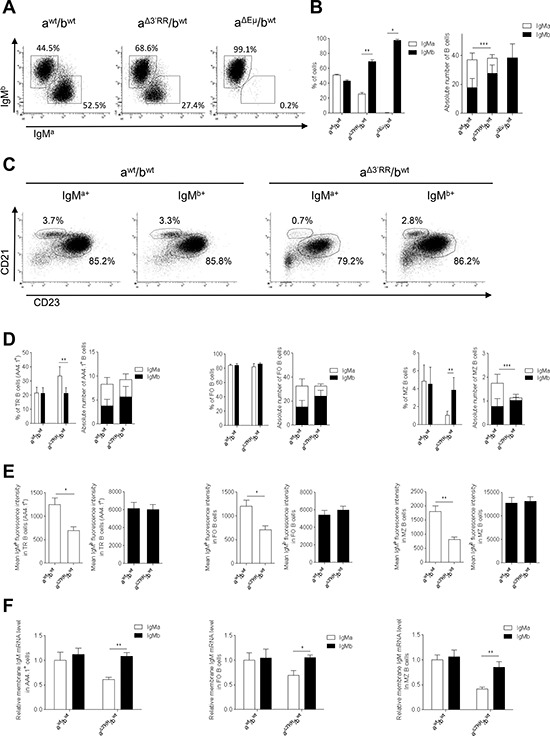
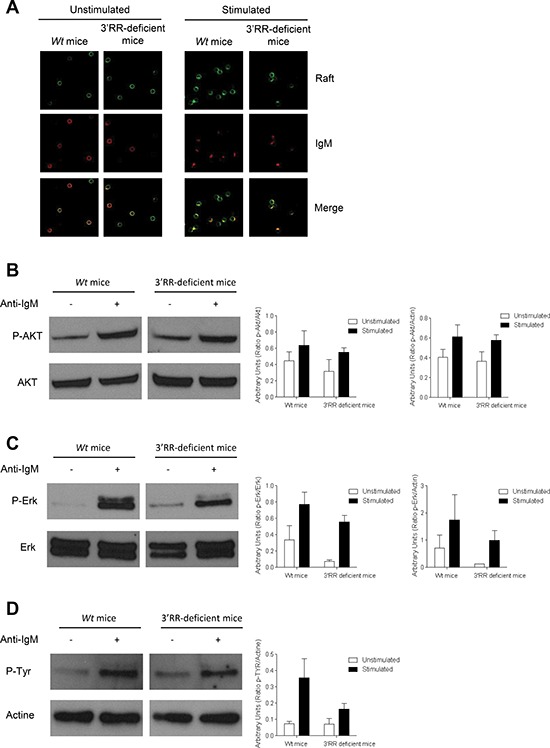
In contrast to bone marrow B-lineage cells, a strong disadvantage of the mutated a allotype finally manifested in mature splenic B cells of IgH aΔ3′RR/bwt mice (Figure 3A–3C). This precisely identified the transition from immature to mature B cells as the time point where the 3′RR-deficiency altered B cell differentiation and introduced a biased representation of the mutant IgH allele. In aΔ3′RR/bwt mice, proportion (but not numbers) of splenic IgMaAA4.1+ transitional (TR) B cells was increased when compared to awt/bwt mice (Figure 3D, left part). Deletion of the 3′RR had no effect on FO B cells (B220+CD21lowCD23high) (Figure 3D, middle part) while a marked reduction of MZ B cells (B220+CD21highCD23low) was found (Figure 3E, right part). The mean IgMa (but not IgMb) intensity was significantly reduced in aΔ3′RR/bwt compared to awt/bwt mice in TR, FO and MZ B cells (Figure 3E). Real time PCR analysis showed a reduced IgMa (but not IgMb) transcription in sorted TR, FO and MZ B cells from aΔ3′RR/bwt (Figure 3F). Thus, deletion of the 3′RR affected membrane IgM expression in mature B cell and the B cell fate toward the MZ phenotype. These results markedly contrast with the lower FO phenotype resulting from hypomorphic expression of either Igα or of an IgH-chain allele, both affecting pre-BCR and BCR expression and resulting in multiple anomalies at various stages of B cell maturation [12, 13]. The cell fate decision made by immature B cells to become a FO or a MZ B cell is controlled by the BCR strength [7, 8]. We investigated BCR signalling in homozygous aΔ3′RR/aΔ3′RR mice that had lower levels of MZ B cells and IgM density than in awt/awt Sv/129 mice (Figure 1). Engagement of BCR with anti-IgM stimulation efficiently induced the co-localisation between BCR and lipid rafts in 3′RR-deficient splenocytes (Figure 4) that is a prerequisite for an efficient BCR signalling [14, 15]. We show that surface Ig cross-linking induces amounts of BCR signalling (Erk and Akt phosphorylations) in 3′RR-deficient B cells without obvious differences to wt mice (Figure 4).
Figure 3. Expression of a 3′RR-deleted allele in splenic B cells.

(A) Flow cytometry analysis of IgMa and IgMb in spleen of heterozygous aΔ3′RR/bwt, awt/bwt and aΔEμMARs/bwt mice. One representative experiment out of ten is shown for aΔ3′RR/bwt and awt/bwt mice. One representative experiment out of four is shown for aΔEμMARs/bwt mice. Cells were gated on B220+ cells. (B) Percentages (left part) and numbers (right part) of B220+ splenic B cells expressing the a or b allele in aΔ3′RR/bwt, awt/bwt and aΔEμMARs/bwt mice. Mean ± SEM of ten aΔ3′RR/bwt mice, ten awt/bwt and four aΔEμMARs/bwt mice. Millions of splenic B cells are reported. The significance is for IgMa cells in the right part. *p < 0.05, **p < 0.01, **p < 0.01 (Mann-Whitney U-test). (C) Flow cytometry analysis of follicular (FO) B cells (B220+CD21lowCD23high) and marginal zone (MZ) B cells (B220+CD21highCD23low) in aΔ3′RR/bwt and awt/bwt mice. One representative experiment out of ten is shown. Cells were gated on B220+ cells. (D) Percentages and numbers (in millions) of TR (AA4.1+), FO and MZ B cells in aΔ3′RR/bwt and awt/bwt mice. Mean ± SEM of ten mice. Million numbers of cells are reported. The significance is for MZ IgMa cells in the right part. **p < 0.01 (Mann-Whitney U-test). (E) IgMa and IgMb densities on TR, FO and MZ B cells in aΔ3′RR/bwt and awt/bwt mice. Mean ± SEM of ten mice. *p < 0.05, **p < 0.01 (Mann-Whitney U-test). (F) μ transcription in sorted TR, FO and MZ B cells of aΔ3′RR/bwt and awt/bwt mice. Mean ± SEM of 6 mice. Values were normalized to GAPDH transcripts. *p < 0.05, **p < 0.01 (Mann-Whitney U-test).
Figure 4. BCR signalling response in 3′RR-deficient B splenocytes.

(A) BCR and lipid rafts colocalization experiments. 3′RR deficient mice (aΔ3′RR/aΔ3′RR) and Sv/129 wt mice (awt/awt) were investigated. CD43− B cells were stained with cholera toxin Alexa 488 followed by stimulation with anti-IgM Alexa 594 labelled antibodies. Arrows point to areas where lipid rafts colocalise with membrane BCR. One representative experiment out of four is shown. (B) BCR signalling in 3′RR-deficient mice. CD43− splenic B cells (3 × 10⁶ cells/ml) from wt Sv/129 mice (awt/awt) and 3′RR-deficient mice (aΔ3′RR/aΔ3′RR) (were stimulated with 15 μg/ml of anti-IgM at 37°C for 10 min. Western Blot experiments were performed with 30 μg of proteins. Actin was used as an internal loading control. phosphor-Akt and Akt were investigated with specific anti-phosphor-Akt and anti-Akt antibodies, respectively. One representative experiments out of 3. Relative intensity of phosphor-Akt bands were related to Akt and actin bands (located in D). (C) phosphor-Erk and Erk were investigated with specific anti-phosphor-Erk and anti-Erk antibodies, respectively. One representative experiments out of 3. Relative intensity of phosphor-Erk bands were related to Erk and actin bands (located in D). (D) Total phosphor-Tyr was investigated with specific anti-phosphor-Tyr antibodies. One representative experiments out of 3. Relative intensity of phosphor-Tyr bands were related to actin bands. No significant differences for p-Akt, Akt, p-Erk, Erk and p-Tyr between 3′RR-deficient mice and wt mice (Mann-Whitney U-test).
CONCLUSION
Deletion of the 3′RR had no impact on bone marrow B cell populations on the use of a 3′RR-deficient allele in competition with a wt allele. This reinforced studies highlighting the key role of 5′ IgH locus regulatory elements in recombination and transcription at immature stages leading to pre-BCR expression [2, 3, 10, 16]. In contrast, a late developmental defect appears in peripheral B lymphocytes with an impact of the 3′RR deletion on IgH chain expression. Whether several models reported that lowered tonic BCR signalling alters B cell fate by favouring the development of MZ B cells in the detriment of FO B cells [7, 8], other studies do not [17, 18]. We show that deletion of the 3′RR lowered IgH transcription, BCR density, and BCR signalling with consequences on B cell fate, disadvantaging MZ subset in favour to FO B cells. This suggests that B cell fate might not be only governed by the BCR tonic signal but relies on fine IgH chain tuning, by multiple regulatory elements including the 3′RR, at specific stages of B cell development. While 5′ IgH elements solely control IgH (and thus pre-BCR) expression at immature stages, the 3′RR comes into IgH (and thus BCR) transcriptional control in mature B cells.
MATERIALS AND METHODS
Mice
Our research has been approved by our local ethics committee review board (Comité Régional d'Ethique sur l'Expérimentation Animale du Limousin, Limoges, France) and carried according the European guidelines for animal experimentation. The disruption of the 3′RR was carried out in a Sv/129 embryonic stem cell line [5]. Mice were bred and maintained under specific pathogen-free conditions. Age-matched littermates (8 weeks old) were used in all experiments.
Cell cytometry analysis
Cells were incubated with anti-B220-BV510, anti-CD21-BV650, anti-CD23-PC7, anti-IgM-APC, anti-IgMa-FITC, anti-IgMb-PE, anti-CD19-APCH7 and anti-AA4.1-APC antibodies (Southern Biotechnologies and Beckton Dickinson) and analysed on a Fortessa LSR2 (Beckton Dickinson) [19–21]. Heterozygous IgH aΔ3′RR/bwt mice generated by crossing homozygous 3′RR-deficient mice (IgH aΔ3′RR/aΔ3′RR) with C57BL/6 mice (IgH bwt/bwt) were investigated. Mixed Sv/129 × C57BL/6 mice (IgH awt/bwt) were used as control mice.
Transcript analysis
Bone marrow B220+AA4.1+IgMa+ and B220+ AA4.1+IgMb+ cells were sorted with specific anti-B220, anti-IgMa, anti-IgMb and anti-AA4.1 labelled antibodies using a BD FACSAria III. Splenic follicular (FO) B cells (B220+CD21lowCD23high), marginal zone (MZ) B cells (B220+CD21highCD23low) and transitional (TR) B cells (B220+AA4.1+) were sorted with specific anti-B220-, anti-CD21-, anti-CD23 and anti-AA4.1 labelled antibodies. Total RNA was extracted and real time PCR was performed in duplicate by using TaqMan and SYBR assay reagents and analysed on an ABI Prism 7000 system (Applied Biosystems) [22]. μ membrane forward (in exon μ 4): 5′-TGGAACTCCGGAGAGACCTA-3′; μ membrane reverse (in exon μ membrane 1): 5′-TTCCTCCTCAGCATTCACCT-3′. GAPDH was used for normalization of gene expression levels (reference Mm99999915-g1). Heterozygous IgH aΔ3′RR/bwt mice and mixed Sv/129 × C57BL/6 mice (IgH awt/bwt) were used for cell sorting experiments.
Western blot analysis
CD43− B splenocytes (15 × 106) were stimulated with 15 μg of goat anti-mouse κ (Southern Biotech) for 10 min at 37°C. Cell lysates (30 μg) were analysed by SDS-PAGE and transferred onto polyvinylidene difluoride membranes (Millipore) as previously reported [22, 23]. After blocking, membranes were incubated with anti-phosphor-Tyr (Cell signalling), anti-phosphor-Erk (Cell signalling), anti-Erk (Cell signalling), anti-phosphor-Akt (Cell signalling), anti-Akt (Cell signalling) and anti-actin antibodies (Sigma), and revealed with HRP-labelled goat anti-rabbit Ig (Biorad) by chemoluminescence (ECL plus, Amersham). Results were analysed with the Java-based image processing program ImageJ that can calculate area and pixel value statistics of user-defined selections and intensity thresholded objects. Homozygous IgH aΔ3′RR/aΔ3′RR and Sv/129 mice (IgH awt/awt) were used for western blot experiments.
Lipid raft aggregation
For BCR and lipid raft colocalization experiments, splenic B cells were purified by hypotonic lysis of red blood cells followed by incubation with anti-CD43-coated MicroBeads (Miltenyi Biotec), which bind to all splenic cells except resting mature B cells. B cells were obtained by passing the cells through a negative depletion column attached to an OctoMACS magnet (Miltenyi Biotec). 1 × 10⁶ CD43− B splenocytes (100 μl) were stained with 80 ng of cholera toxin B, a marker of lipid rafts, conjugated to Alexa 488 and 20 μg of goat anti-mouse IgM conjugated to Alexa 594 (Molecular Probes) for 30 min on ice then 5 min at 37°C for the stimulated conditions. Cells were then fixed with 4% PFA. For non stimulated conditions cells were incubated 30 min with an anti-IgM-PE on ice and analysed with a Zeiss LSM 510 META confocal microscope. Homozygous IgH aΔ3′RR/aΔ3′RR and Sv/129 mice (IgH awt/awt) were used for experiments.
Acknowledgments
This work was supported by grants from Conseil Régional du Limousin, Association pour la Recherche sur le Cancer (ARC SL 220100601332), Ligue Contre le Cancer de la Corrèze, ANR (Projets Blanc 2011) and “Lions Club de la Corrèze, Zone 33 district 103 Sud”. P. Rouaud has a fellowship from ARC (DOC20130606964). We thank S. Desforges and B. Remerand for help with animal care.
Footnotes
CONFLICT OF INTEREST
The authors declare that they have no conflicts of interest.
Editorial note
This paper has been accepted based in part on peer-review conducted by another journal and the authors' response and revisions as well as expedited peer-review in Oncotarget.
REFERENCES
- 1.Henderson A, Calame K. Transcription regulation during B cell development. Annu Rev Immunol. 1998;16:163–200. doi: 10.1146/annurev.immunol.16.1.163. [DOI] [PubMed] [Google Scholar]
- 2.Pinaud E, Marquet M, Fiancette R, Péron S, Vincent-Fabert C, Denizot Y, Cogné M. The IgH locus 3′ regulatory region: pulling the strings from behind. Adv Immunol. 2011;110:27–70. doi: 10.1016/B978-0-12-387663-8.00002-8. [DOI] [PubMed] [Google Scholar]
- 3.Perlot T, Alt FW, Bassing CH, Suh H, Pinaud E. Elucidation of IgH intronic enhancer functions via germ-line deletion. Proc Natl Acad Sci. USA. 2005;42:14362–14367. doi: 10.1073/pnas.0507090102. [DOI] [PMC free article] [PubMed] [Google Scholar]
- 4.Guo C, Yoon HS, Franklin A, Jain S, Ebert A, Cheng HL, Hansen E, Despo O, Bossen C, Vettermann C, Bates JG, Richards N, Myers D, et al. CTCF-binding elements mediate control of V(D)J recombination. Nature. 2011;477:424–430. doi: 10.1038/nature10495. [DOI] [PMC free article] [PubMed] [Google Scholar]
- 5.Vincent-Fabert C, Fiancette R, Pinaud E, Truffinet V, Cogné N, Cogné M, Denizot Y. Genomic deletion of the whole IgH 3′ regulatory region (hs3a, hs1,2, hs3b, hs4) dramatically affects class switch recombination and Ig secretion to all isotypes. Blood. 2010;116:1895–1898. doi: 10.1182/blood-2010-01-264689. [DOI] [PubMed] [Google Scholar]
- 6.Rouaud P, Vincent-Fabert C, Saintamand A, Fiancette R, Marquet M, Robert I, Reina-San-Martin B, Pinaud E, Cogné M, Denizot Y. The IgH 3′ regulatory region controls AID-induced somatic hypermutation in germinal centre B-cells in mice. J Exp Med. 2013;210:1501–1507. doi: 10.1084/jem.20130072. [DOI] [PMC free article] [PubMed] [Google Scholar]
- 7.Niiro H, Clark EA. Regulation of B-cell fate by antigen-receptor signals. Nat Rev Immunol. 2002;2:945–956. doi: 10.1038/nri955. [DOI] [PubMed] [Google Scholar]
- 8.Pillai S, Cariappa A. The follicular versus marginal zone B lymphocyte cell fate decision. Nat Rev Immunol. 2009;9:767–777. doi: 10.1038/nri2656. [DOI] [PubMed] [Google Scholar]
- 9.Kaminski DA, Stavnezer J. Antibody class switching differs among SJL, C57BL/6 and 129 mice. Int Immunol. 2007;19:545–556. doi: 10.1093/intimm/dxm020. [DOI] [PubMed] [Google Scholar]
- 10.Marquet M, Garot A, Bender S, Carrion C, Rouaud P, Lecardeur S, Denizot Y, Cogné M, Pinaud E. The Eμ enhancer region influences H chain expression and B cell fate without impacting IgVH repertoire and immune response in vivo. J Immunol. 2014;193:1171–1183. doi: 10.4049/jimmunol.1302868. [DOI] [PubMed] [Google Scholar]
- 11.Guglielmi L, Le Bert M, Truffinet V, Cogné M, Denizot Y. Insulators to improve expression of a 3′IgH LCR-driven reporter gene in transgenic mouse models. Biochem Biophys Res Commun. 2003;307:466–471. doi: 10.1016/s0006-291x(03)01185-9. [DOI] [PubMed] [Google Scholar]
- 12.Rowland SL, DePersis CL, Torres RM, Pelanda R. Ras activation of Erk restores impaired tonic BCR signalling and rescues immature B cell differentiation. J Exp Med. 2010;207:607–621. doi: 10.1084/jem.20091673. [DOI] [PMC free article] [PubMed] [Google Scholar]
- 13.Brenner S, Drewel D, Steinbart T, Weisel F, Härtel E, Pötzsch H, Yu P, Mudde GC, Schweizer A, Nitschke L, Winkler TH. A hypomorphic IgH-chain allele affects development of B-cell subsets and favours receptor editing. EMBO J. 2011;30:2705–2718. doi: 10.1038/emboj.2011.168. [DOI] [PMC free article] [PubMed] [Google Scholar]
- 14.Sedwick CA, Altman A. Ordered just so: lipid rafts and lymphocyte function. Sci STKE. 2002;122:re2. doi: 10.1126/stke.2002.122.re2. [DOI] [PubMed] [Google Scholar]
- 15.Cheng PC, Cherukuri A, Dykstra M, Malapati S, Sproul T, Chen MR, Pierce SK. Floating the raft hypothesis: the roles of lipid rafts in B cell antigen receptor function. Semin Immunol. 2001;13:107–114. doi: 10.1006/smim.2000.0302. [DOI] [PubMed] [Google Scholar]
- 16.Peng C, Eckhardt LA. Role of the Igh intronic enhancer Eμ in clonal selection at the pre-B to immature B cell transition. J Immunol. 2013;191:4399–411. doi: 10.4049/jimmunol.1301858. [DOI] [PMC free article] [PubMed] [Google Scholar]
- 17.Liu X, Manser T. Antinuclear antigen B cells that down-regulate sueface B cell receptor during development to mature, follicular phenotype do not display features of anergy in vitro. J Immunol. 2005;174:4505–4515. doi: 10.4049/jimmunol.174.8.4505. [DOI] [PubMed] [Google Scholar]
- 18.Martin F, Kearney JF. Marginal zone B cells. Nature Rev. 2002;2:323–335. doi: 10.1038/nri799. [DOI] [PubMed] [Google Scholar]
- 19.Rouaud P, Vincent-Fabert C, Fiancette R, Cogné M, Pinaud E, Denizot Y. Enhancers located in heavy chain regulatory region (hs3a, hs1,2, hs3b and hs4) are dispensable for diversity of VDJ recombination. J Biol Chem. 2012;287:8356–8360. doi: 10.1074/jbc.M112.341024. [DOI] [PMC free article] [PubMed] [Google Scholar]
- 20.Truffinet V, Pinaud E, Cogné N, Petit B, Guglielmi L, Cogné M, Denizot Y. The 3′ IgH locus control region is sufficient to deregulate a c-myc transgene and promote mature B cell malignancies with a predominant Burkitt-like phenotype. J Immunol. 2007;179:6033–6042. doi: 10.4049/jimmunol.179.9.6033. [DOI] [PubMed] [Google Scholar]
- 21.Vincent-Fabert C, Truffinet V, Fiancette R, Cogné N, Cogné M, Denizot Y. Ig synthesis and class switching do not require the presence of the hs4 enhancer in the 3′ IgH regulatory region. J Immunol. 2009;182:6926–6932. doi: 10.4049/jimmunol.0900214. [DOI] [PubMed] [Google Scholar]
- 22.Rouaud P, Fiancette R, Vincent-Fabert C, Magnone V, Cogné M, Dubus P, Denizot Y. Mantle cell lymphoma-like lymphomas in c-myc-3′RR/p53+/− mice and c-myc-3′RR/Cdk4R24C mice: differential oncogenic mechanisms but similar cellular origin. Oncotarget. 2012;3:586–593. doi: 10.18632/oncotarget.474. [DOI] [PMC free article] [PubMed] [Google Scholar]
- 23.Vincent-Fabert C, Fiancette R, Rouaud P, Baudet C, Truffinet V, Magnone V, Guillaudeau A, Cogné M, Dubus P, Denizot Y. A defect of the INK4-Cdk4 checkpoint and c-myc collaborate in blastoid mantle cell lymphoma (MCL)-like lymphoma formation in mice. Am J Pathol. 2012;180:1688–1701. doi: 10.1016/j.ajpath.2012.01.004. [DOI] [PubMed] [Google Scholar]


