

Abstract
Although there are strong genetic determinants of multiple sclerosis, the results of migration studies support a role for the environment, and through rigorous epidemiological investigation, Epstein-Barr virus infection, vitamin D nutrition, and cigarette smoking have been identified as likely causal factors for multiple sclerosis. In this review, we discuss the strength of this evidence, as well as the potential biological mechanisms underlying these associations. Both vitamin D nutrition and cigarette smoking are modifiable and as such, increasing vitamin D levels and smoking avoidance have the potential to substantially reduce MS risk and influence its progression.
Introduction
Multiple sclerosis (MS), like virtually all diseases 1, is caused by multiple contingencies, the relative importance of which vary according to people, time, and space. The purpose of epidemiological research is to identify these contingencies, particularly those that may be modifiable in a way that will improve health. Examples of recent successes are the prevention of neural tube defects 2, sudden infant death 3, and hepatocellular carcinoma.4 In each case, a general hypothesis initially suggested by clinical observations or ecological data has been pursued in increasingly rigorous observational studies, culminating with experimental evidence or a broad public health intervention. In MS, there are now three environmental factors that stand out for the strength of the evidence supporting their causal role: infection with the Epstein-Barr virus, low levels of vitamin D, and cigarette smoking. Although not exhaustive, these factors could account for a large proportion of cases in the regions of highest MS incidence, and thus provide a promising foundation for MS prevention.
Genes and environment
MS is primarily a disease of young adults; incidence starts rising in late adolescence, reaches a peak in the late 20’s and early 30’s, and then slowly declines, becoming rare at age 50 and above. 5, 6 Among white non-Hispanics the lifetime risk is about 1 in 400 7; risk tends to be lower in Hispanics, blacks, and Asians, 8, 9 though a recent report suggests risk may be increasing in non-Hispanic blacks 10 The high degree of heritability of MS was well established by studies of twins and siblings 11, 12, which concluded that sharing of genes rather than environment explains the clustering of MS within families. The concordance rate is about 5-fold higher in monozygotic twins (~25%) than in dizygotic twins (~5%), and having a sibling with MS increases the risk by 20–40 folds 13, as compared with individuals with no MS in their close relatives. The strongest genetic risk is conferred by the HLA-DRB1*1501 allele, which has a 14%–30% frequency in countries at high MS risk,14 and it increases MS risk by an average of 3 folds in heterozygous carriers and 6 folds in homozygous individuals. 15 Other HLA-DRB1 alleles, notably DR3 (DRB1*0301) and DR4 (DRB1*0405-DQA1*0301-DQB1*0302), are also associated with a strong MS risk.16 The main effects of these alleles still only explain about 20–60% of the estimated heritability of MS. 17 Numerous large scale genome-wide studies as well as studies of multiplex families have attempted to identify the missing genetic contributions to MS. The main findings include the likely existence of strong gene*gene interactions in the HLA region18, and the identification of numerous (~ 25) loci associated with modest increases in risk (relative risks ranging between 0.8 and 1.2).19 Most of these findings are consistent with a broad role of the immune system in MS, but do not provide specific insights on the disease etiology, except for the discovery that rare variants of CYP27B1, the gene encoding the 1-α-hydroxylase that converts 25-dihydroxyvitamin D (25(OH)D) to its active form, increase MS risk. 20 This finding will be discussed in more detail in the vitamin D section.
The high relative risks associated with having a twin or sibling with MS notwithstanding, about 80–90% of individuals with MS have a negative family history 21, 22, a paradox easily explained by the overall relatively low MS prevalence. The fact that most individuals with MS do not have a positive family history would be insufficient to incriminate the environment, but a role of the latter is strongly supported by the geographical distribution of MS and related changes in risk with migration, and the results of analytical studies implicating specific risk factors.
Geography and migration
It has been known for many years that MS is rare between the tropics, and increases in frequency with increasing latitude in both hemispheres (“latitude gradient”). 23 The overall gradient is remarkable, despite several exceptions, likely due to genetic influence, such as the low rates of MS in the northernmost regions, largely inhabited by Inuit and other indigenous populations, and high MS rates in Sardinia. Notably, among migrants from regions of high MS risk (British islands) to regions of low risk (South Africa or Australia), MS incidence appears to decrease in a graded manner -- the younger the age at immigration, the lower the risk, suggesting that environmental exposures early in life may be important in determining MS risk. 24, 25 A change in risk with migration was confirmed in a large study within the U.S., which demonstrated a two-fold reduction in MS risk among men and women who were born in the North (> 41–42° N), but entered military service in the South (< 37 N). 26 In contrast, the effects of migration from low to high risk areas have remained uncertain, partly because small sample sizes and methodological limitations reduced the strength of the evidence. 24 A marked attenuation of this latitude gradient, however, has been observed in the U.S. 9, 27 and Europe. 28 For example, among white U.S. women, there was a three-fold latitude gradient among those born in 1921–46, but virtually no gradient among those born after 1946. 27 The disappearance of the latitude gradient is most likely due to an increased incidence of MS in the south, as there is no evidence that MS incidence is decreasing in the north. 6 In contrast, a strong latitude gradient persists in the southern hemisphere. 29, 30 The reason for this difference is unknown.
Specific risk factors
Epstein-Barr Virus (EBV)
Epidemiological evidence of causality
EBV, or human herpesvirus 4, is a ubiquitous double stranded DNA virus that is transmitted primarily via saliva. Infection is common and usually asymptomatic in the first years of life, but often causes an acute febrile illness, known as infectious mononucleosis (IM), when primary infection is delayed to adolescence or adulthood, as often occurs in countries with higher socio-economic status and hygiene.31 IM incidence in each population, therefore, reflects the distribution of age at EBV infection. Early EBV infection is the rule (and thus IM rare) in the tropics and, more generally, in low income populations, but also in Japan, probably because of the custom of sharing food from the same plate. 32 In the U.S. and Europe the proportion of individuals who escape early infection displays a remarkable latitude gradient – for example, among cadets at the West Point military academy, in the 1970’s the proportion of EBV positive ranged from ~80% for those born in the South to ~50% for those born in the north. 33 As a result, the epidemiology of IM is strikingly similar to that of MS 34; further, MS risk is two to three folds higher among individuals with a history of IM. 35 These observations provided the earliest evidence that a late age at EBV infection is a risk factor for MS, but are open to the alternative interpretation that high hygiene in childhood is the common cause of both IM and MS (hygiene hypothesis). 36
According to the general formulation of the hygiene hypothesis, EBV negative individuals, having been under exposed to early life infections, should have a high MS risk. However, MS risk, as inferred from cross-sectional studies, appears to be extremely low in EBV negative individuals. 37–41 Only recently we have been able to conduct a prospective investigation, relying on a repository of over 50 million serum samples collected from US military recruits. 42 As expected, only ~5% of military personnel were EBV negative at the time of the first blood collection, but because of the large source population, the absolute number of uninfected individuals was sufficiently high to estimate the incidence of MS.
Further, because each individual provided a new blood sample every 1–2 years during their time on active duty, we were able to determine the approximate time of primary EBV infection. 42 The results were striking – only 10 cases of MS occurred among those individuals who were EBV negative at the beginning of the follow-up, and all of them developed the first symptoms of MS several months after serological evidence of EBV infection (Figure 1). 42 This finding virtually rules out reverse causation (MS increasing the probability of EBV infection), as well as the hypothesis that a genetic resistance to both EBV infection and MS could explain the cross-sectional data. A common cause for both EBV infection and MS cannot be excluded, but there are no known plausible candidates. This finding does not necessarily contradict the hygiene hypothesis – it is quite possible that increasing hygiene and thus reducing exposure to infections in early childhood increases susceptibility to MS, but this susceptibility becomes apparent only after EBV infection, and is amplified by a late age at EBV infection. 38
Figure 1.

Time of Epstein-Barr virus seroconversion and multiple sclerosis onset in the 10 cases who were seronegative at baseline. Adapted from 42. These data are identical to, but presented in a different order than, origninal figure in 42. Vertical lines represent time of serum collection, blue circles mark the time of MS onset. The yellow bars represent the period of EBV seronegativity, and transition to green bars indicate seroconversion to EBV positivity.
In epidemiological terms, the relation between EBV and MS resembles the relation between hepatitis B virus and liver cancer 43 – infection increases disease risk by many folds, but most carriers of the virus never develop the disease, and the disease can occur among those who are not infected. As discussed in the next section, however, the mechanisms that relate EBV to MS are still uncertain. A still unexploited epidemiological clue is that the risk of developing MS among apparently healthy young adults is strongly related to their serum titers of anti-EBV nuclear antigen (EBNA) IgG antibodies,44–48 (Figure 2) which primarily recognize two latent EBV proteins, EBNA-1 and EBNA-2. In the study among US military personnel discussed above, among those individuals who were EBV positive at the time of recruitment, the relative risk of MS over an average follow-up of 5 years was 36 times higher among those with anti-EBNA titers > =320 as compared to those with titers <20. 48 Anti-EBNA-1 antibodies are considered a marker of a good immune response to EBV (in immunosuppression, EBNA-1 titers decrease and EBNA-2 tend to increase, thus reverting the EBNA-1/EBNA-2 ratio which is normally > 1), and tend to be higher among individuals with a history of IM. 49
Figure 2.

Relative risk of multiple sclerosis by levels of EBNA IgG antibody titers. From 48
EBV and MS: Potential Mechanisms
The mechanistic underpinnings of the aforementioned epidemiological associations are far from understood. Possible scenarios include the activation and expansion of autoreactive T and B cells during IM, a syndrome characterized by strong immune activation, or the ability of EBV to immortalize B cells for autoantibody production and antigen presentation to pathogenic T cells 50. (Figure 3)
Figure 3.
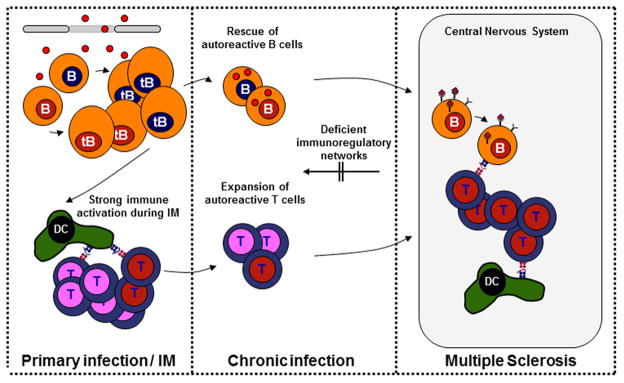
Potential mechanisms by which Epstein-Barr virus infection might contribute to the development of multiple sclerosis. Patients with MS show higher frequencies and activation states of self-reactive lymphocytes (red nuclei), in addition to impaired functions of regulatory immune compartments indicating a lower threshold for breakdown of self-tolerance to central nervous system (CNS) antigens. Strong innate immune activation during primary EBV infection (virions and viral DNA are depicted as red dots) could facilitate the activation and expansion of autoreactive and polyspecific (i.e. both autoantigen and viral antigen specific) T and B cells. These cells could be maintained in the presence of continuous antigen exposure. In addition, latent EBV infection confers B cell survival advantages and could rescue autoreactive B cells from apoptotic deletion during B cell development and differentiation. Homing of these rescued autoreactive lymphocytes, which have immunomodulatory and antigen-presenting functions on T cells, to the inflamed CNS might contribute to the immunopathology of MS.
Patients with MS show higher frequencies and activation states and/or less co-stimulatory requirements of self-reactive lymphocytes, in addition to impaired functions of regulatory immune compartments, 51–53 indicating a lower threshold for breakdown of self-tolerance to central nervous system (CNS) antigens. Strong innate immune activation during primary EBV infection could facilitate the activation and expansion of autoreactive and polyspecific (i.e. both autoantigen and viral antigen specific) T and B cells. For example, patients with MS show predominant clonal expansions of T cells that are specific for EBNA1 54, the EBV antigen that is most commonly targeted by CD4+ T cells in healthy virus carriers 55, and EBNA1-specific T cells recognize myelin antigens more frequently than other autoantigens that are not associated with MS 56. Continuous restimulation of these cells caused by autoimmune tissue inflammation might contribute to the development of MS.
The profound and rapid clinical efficacy of B-cell depleting therapies reinforced the notion that B cell functions contribute to the pathogenesis of MS 57. EBV persists in memory B cells and modulates their differentiation and function 58. Autoreactive B cells are normally neutralized or controlled by several tolerance checkpoints during B cell development and differentiation. Because latent EBV infection confers B cell survival advantages required to pass these tolerance checkpoints 58–60, EBV could assist in the survival of autoreactive B cell species in patients with MS. So far, there is no experimental evidence supporting such a hypothesis.
Due to its immune-modifying functions in the periphery, EBV could contribute to MS development without crossing the blood–brain barrier. Whether EBV infection drives local CNS inflammation through the presence of EBV-infected B cells and expression of viral gene products within the CNS is a matter of debate. Previous studies on this topic provided highly discordant results, showing EBV-infected B cells expressing viral lytic and latent proteins in the vast majority of MS cases and lesions or only exceptional EBV-positive B cells in rare cases 61. A more recent study showed that EBV-infected B cells are present in active MS lesions while they do not express lytic viral gene products 62. Further collaborative studies are needed to clarify whether and by which mechanisms EBV might contribute to local tissue inflammation within the CNS.
The flip side of the idea that MS development is driven by EBV infection is that autoreactive immune responses, or even only a predisposition to the development of these responses, have an influence on antiviral immune responses 63. The latter probably accounts for the occurrence of polyspecific antiviral humoral immune responses in the cerebrospinal fluid (CSF) compartment in patients with MS. These responses are characterized by intrathecal synthesis of antibodies against a variety of viruses 64–68. However, the consistent finding that symptomatic primary EBV infection increases MS susceptibility, the rarity of MS among EBV-negative individuals and the higher seroprevalence in children and adults with MS compared with age-matched peers, argues against an epiphenomenal function of EBV in MS. Studies that address potential mechanisms responsible for the reported associations are much needed and might lead to concepts of how EBV interferes with MS development and how alterations in EBV immunobiology could be targeted for MS therapy.
EBV and MS progression
In contrast to the compelling evidence linking EBV infection and the titers of anti-EBNA antibodies to MS risk, the role of EBV in MS progression remains unclear. Higher rate of conversion from CIS to MS and MRI evidence of disease activity have been reported in individuals with higher anti-EBNA-1 titers 69, 70, but lytic EBV replication, as inferred by the presence of EBV DNA in plasma samples, was not associated with MS activity. 71 Further, the association between anti-EBNA-1 titers and conversion to MS may in part reflect the fact that among patients presenting with CIS, those with low anti-EBNA titers are less likely to have MS.
Implications
In theory, a vaccine conferring permanent sterile immunity to EBV could protect against MS, but, to our knowledge, such a vaccine is not under development. Whether the only existing vaccine, shown in a phase 2 trial to protect against IM, but not against EBV infection 72, would reduce MS risk is uncertain. The rarity of MS among populations in which EBV infection occurs early in life, and the consistent finding of an increased MS risk in individuals with IM, suggest that MS risk could be reduced by voluntary early exposure of infants to EBV. A study to test this hypothesis, however, would take at least two decades, and it is probably infeasible. Available anti-viral medications such as DNA-polymerase inhibitors target lytic EBV infection, i.e. viral replication, but have limited effects on latent EBV infection, and trials in MS have been inconclusive. 36, 73, 74 Thus at this time the only practical implications may be diagnostic – EBV negativity or low anti-EBNA titers in an individual with CIS would suggest a diagnosis other than MS. 70
Vitamin D
Epidemiological evidence of causality
The geography of MS correlates strongly not only with age at EBV infection, but also with the duration and intensity of UV radiation from sunlight 75, which is the primary source of vitamin D in most populations. Further, at high latitudes, where during most of the year sunlight does not support vitamin D synthesis, MS is less common among coastal populations with high intake of fatty fish, the major dietary source of vitamin D. 76 Early attempts to demonstrate an association between UV light exposure or vitamin D intake and MS have produced mixed results, probably because of the difficulty of recalling diet or sun exposure many years in the past and of recruiting representative control groups. 77–80 These limitations have been more recently overcome by a combination of approaches that include longitudinal studies of dietary vitamin D intake or serum 25(OH)D, and the use of skin actinic damage as a marker of cumulative UV light exposure. Further, genetic studies are contributing to support the causality of these associations. 81
The relation between vitamin D intake and MS risk has been examined among women in two cohorts comprising 182,000 female nurses who were followed prospectively for over 20 years.82 Average vitamin D intake was assessed every four years using a food frequency questionnaire, and was validated by correlation with plasma 25(OH)D and inverse relation to risk of fractures. 83 During the follow-up, 173 MS cases were documented. After adjustment for age, smoking, and other potential risk factors, MS risk was 40% lower among those women who reported regular use of at least 400 IU/day of vitamin D from supplements (RR=0.60, 95% CI: 0.39–0.92). Similarly, MS risk was 31% lower among women in the highest quintile of total vitamin D intake (from food and supplements) as compared with those in the lowest.
Vitamin D intake, however, is a relatively minor contributor to overall vitamin D status as compared to UV light exposure, and it was thus important to obtain longitudinal data based on serum 25(OH)D levels, which directly reflects vitamin D status. In rickets, levels are usually < 30 nmol/L; levels between 30 and 50 nmol/L are considered deficient because of clear associations with an increased level of circulating parathyroid hormone, osteoporosis and fractures 84, 85, but there is an emerging consensus that optimal levels are at least 75 nmol/L.85 For comparison, mean 25(OH)D levels among young adults in the U.S. are about 62 nmol/L, and much lower levels have been found in most studies in Europe and Canada.86–89 The relation between serum 25(OH)D levels in apparently healthy young adults and their future risk of developing MS has so far been reported in only one investigation -- a nested case-control study among active duty military personnel, which included 257 MS cases and 514 controls matched by age, gender, race/ethnicity, and military branch (Army or Navy/Marines).90 The long term vitamin D status was estimated as the average of the deseasonalized serum 25(OH)D level in two or three consecutive blood samples, collected from each individual over an average period of 5 years. The average age of study participants at the time of collection of the first blood sample was 23 years, and the mean time to MS onset was 5 years. Among non-Hispanic whites, the risk of developing MS was 62% lower among individuals in the highest quintiles of 25(OH)D levels (> 99 nmol/L) as compared with those in the lowest quintiles (<= 63 nmol/L; RR: 0.38, 95% CI: 0.19–0.75; p for trend = 0.02) -- results were similar in men and women. In contrast, no association was found among non-Hispanic blacks or Hispanics, whose 25(OH)D levels were, as expected, markedly lower. The strong inverse association between serum 25(OH)D and MS risk among non-Hispanic whites was not explained by differences in latitude of residence at time of recruitment, which was not itself a significant predictor of risk, consistent with previous findings supporting the disappearance of a latitude gradient of MS within the U.S. Whereas confounding by unmeasured factors cannot be excluded, the results of this investigation strongly suggest that high levels of serum 25(OH)D in young adults may reduce MS risk, independently from vitamin D status during childhood. If this association reflected a protective effect of vitamin D, a substantial proportion of MS cases in North America could be prevented by vitamin D supplementation. This proportion would be even higher in the U.K. and other European countries, where average 25(OH)D levels are much lower. 89
The results of the longitudinal studies described above were further corroborated by an investigation in Australia using the degree of actinic damage in the dorsum of the hand as a marker of cumulative lifetime sun exposure. 91 A lower degree of actinic damage was found at the time of onset of a first demyelinating event (FDE) among 216 cases as compared with 395 appropriately matched controls selected at the same latitude; the odds ratio of a FDE comparing individuals in the highest with those in the lowest category of actinic damage was 0.39 (95% CI: 0.17–0.92). In the same study, an inverse association was found between serum 25(OH)D levels and FDE (OR:0.92 for a 10 nmol/L increase in 25(OH)D, 95% CI: 0.86–1.00). Both actinic damage and 25(OH)D contributed to FDE risk in the same model, suggesting that the two measures may provide complementary information on the relevant period of exposure (25(OH)D levels reflecting recent exposure, and actinic damage cumulative long term exposure). 92
UV light exposure, in addition to being the strongest determinant of serum 25(OH)D levels in most populations, also has direct effects on the immune system. 93 These effects have not been extensively investigated in humans, and it is thus uncertain to what extent they may contribute to the lower risk of MS. Two important pieces of evidence, however, suggest that the lower MS risk among individuals with high levels of 25(OH)D is mediated by vitamin D, rather than other effects of UV light. One is the longitudinal study described above of a lower MS risk among women who are regular users of vitamin D supplements 82, the other is the association between mutations in CYP27B1 and MS risk.20, 94, 95 CYP27B1 encodes the 1-α hydroxylase that converts 25(OH)D to its active form. Rare non-functional variants of CYP27B1 have been identified that, when present in homozygous form, cause vitamin D-dependent rickets type-1 (VDDR-1). 96 An increased MS risk has been reported not only among individuals with VDDR-1 97, but also among heterozygotes for these mutations. 20
The results above support the importance of vitamin D levels up to the time of MS onset, but do not exclude the possible importance of vitamin D in childhood or even in utero. Consistent with effects in childhood are the results of migration studies 24, 25 and the increased risk of MS associated with obesity (a cause of vitamin D insufficiency) in adolescence.98, 99 The potential importance of vitamin D in utero is suggested by preliminary findings of a lower MS risk among women whose mothers used vitamin D supplements during pregnancy 100, and by variations in MS risk according to month of birth. 101, 102 These results, however, are far from conclusive, and do not affect the strong evidence supporting the importance of vitamin D levels in adulthood.
Mechanisms
How vitamin D may exert a protective effect on MS risk is not known, but there is a growing body of literature on the immunomodulatory effects of vitamin D, which may be relevant for MS. The vast majority of research in this area, however, has been in animal models or in vitro, and may or may not be reflective of the effects of vitamin D in vivo in humans. There have been a few randomized clinical trials where individuals were supplemented with vitamin D (in cholecalciferol form) and immunological changes studied; only one of these was in healthy individuals 103, the remaining being in people with MS,104–106 obesity,107 or congestive heart failure.108 These studies varied with respect to the dose and duration of vitamin D given and average levels of 25(OH)D achieved (Figure 4). The upper bound of the physiological range of 25(OH)D is around 150 nmol/L. 109, 110 Collectively, four of the trials examined immunological changes where supplementation achieved 25(OH)D levels, on average, between 70–145 nmol/L 103, 104, 107, 108. In healthy individuals 103, a significant 5–6% increase in the percent of regulatory T cells (in 20,000 CD4+T cells) was observed in the vitamin D supplemented group (140,000 IU/month for 3 months) whereas no increase was seen in the placebo group. In MS patients given 1,000 IU/day for 6 months,104 there was an increase in serum levels of TGF-β1, but no statistically significant changes in mRNA levels of IL-2, TNF-α, IFN-γ, or IL-13 in PBMC A decrease in serum TNF-α and an increase in serum IL-10 were observed in a study of congestive heart failure patients receiving 2,000 IU/day for 9 months 108, but IL-10 levels did not significantly change in a trial of obese individuals given either 40,000 IU or 20,000 IU/week for 1 year 107. Immunological responses were also measured in two trials among MS patients given doses of cholecalciferol that pushed the average 25(OH)D into the supraphysiological range (average ~400 nmol/L) for a brief period of time. 105, 106, 111 In one, there was no difference in serum cytokine levels over 12 weeks, but T cell proliferation in response to stimulation with MS-related and dietary antigens was decreased. 105 In the other the total number of circulating total or regulatory T cells was unchanged after 12 weeks with supplementation of 20,000 IU cholecalciferol/day, but the number ofIL-10+CD4+ T cells was increased and the IFN-γ+/IL4+CD4+ T cell ratio was decreased.106 Further, lower plasma levels of B-cell activating factor were observed. (Figure 4) Other immunomodulatory effects of vitamin D that have been observed in vitro or in animal models include anti-inflammatory cytokine production and reduced MHC presentation by antigen presenting cells, decreases in Th1 and Th17 cell populations and reduced expression of related cytokines including IFN-γ and IL-17, and decrease in plasma cell conversion and antibody production by B cells. These observations have recently been reviewed in detail. 112 More in vivo studies of these effects and associated 25(OH)D levels in humans are needed to fully understand the mechanism behind vitamin D and MS risk reduction. It is also possible that vitamin affects MS risk indirectly, through its effect on microbicidal responses 113 risk of respiratory infections 114, 115, which are known triggers of MS relapses116–118 and may have some influence on MS risk. 119
Figure 4.

In vivo effects in humans of vitamin D on the immune system observed in clinical trials. 25(OH)D level is that achieved with the vitamin D3 supplementation given in the trial. Yellow: 105; Red: 106, 111; Blue: 103; Green: 107; Pink: 108; Orange: 104.
Vitamin D and MS progression
In children presenting with a clinically isolated syndrome (CIS), serum 25(OH)D levels are inversely associated with the rate of conversion to MS. 120 Further, in individuals with MS, higher 25(OH)D levels are associated with fewer relapses 121–125. The interpretation of these findings, however, is complex, because 25(OH)D levels fluctuate with season and depend on time spent outdoors at different times of day, which can in turn be affected by relapses and disability status. 126 Randomized controlled clinical trials of vitamin D and MS have been underpowered to adequately study the effects of vitamin on clinical and MRI parameters, and one 105 was also unblinded. However, in a high-dose escalation trial,105 participants were given increasing amounts of vitamin D3 per week, up to 280,000 IU after which the dosage was incrementally reduced. Average 25(OH)D levels reached a high of 413 nmol/L and there was a suggestion of fewer relapses in the vitamin D supplemented group, as compared to placebo, over the course of a year. In a Finnish randomized controlled trial evaluating 20,000 IU vitamin D3/week over 1 year as an add-on therapy to interferon β-1b127, there was no difference in relapse rates between those taking vitamin D and those not. Among MRI parameters, only a lower number of enhancing T1 lesions in the vitamin D supplemented group was statistically significant. Collectively, these results are consistent with a continuing beneficial effect of high vitamin D levels after the onset of MS, particularly on the inflammatory component. Insufficient data are available on the relation between 25(OH)D and neurodegenerative changes.
Implications for prevention and treatment
Can MS incidence be reduced by vitamin D supplementation, and if so, what doses should be given, and to whom? The answers to these questions should take into account not only the expected effects on MS, but also the potential benefits for the prevention of other diseases, such as type 1 diabetes 128, asthma 129, and respiratory infections 115, as well as the potential risks. 130 Available data suggest that MS risk is minimized at an average serum 25(OH)D level above 100 nmol/L,90 which is currently achieved by only one fifth of the population at risk in the U.S., and a smaller proportion in most of Europe. 89 This level could be reached in most adolescents and adults by taking 2,000 to 4,000 IU/day of vitamin D3 131, 132, a dose that is well above current recommendations, but considered safe.133 There is currently little specific information on genetic interactions, and because of the safety and low cost of vitamin D, dose individualization is probably unnecessary. Most importantly, because of the uncertainties and the high stakes involved, experimental evidence of benefit should be pursued before implementing nationwide universal supplementation programs, or at least in parallel with such implementation. In contrast, for individuals at high MS risk because of their family history, those who experienced a CIS, and those with MS, use of vitamin D supplements is, arguably, a rational choice, considering the strength of the evidence, the small risk, and the years required to reach more conclusive evidence.
Cigarette smoking
MS risk in ever smokers is about 50% higher than in never smokers, and, among smokers, it increases with smoking duration and intensity. 134–138 In a longitudinal study in two large cohorts of nurses, 134 MS risk was about two folds higher among women who smoked >=25 pack-years as compared with never smokers. The adverse effect of smoking on MS risk seems even higher among men, with some studies reporting a nearly three-folds increase in ever smokers as compared to never smokers. 138–140 Differential changes in smoking behavior between men (decreasing) and women (relatively constant) over the last several decades (Figure 5A) can explain most, if not all, the increase in the female to male ratio in MS incidence noted in Canada 141 and Denmark 142, and other populations. 143 Assuming that the relative risk of smoking in men is ~2.7, the change in smoking behavior could, by itself, explain most of the increase in the female-to-male ratio in MS incidence. 143(Figure 5B) An important caveat, however, is that the changes in smoking behavior would predict a decrease in MS incidence in men, rather than the increase in women that seems to be driving the increasing female to male ratio. 142 Together, these results suggest that the decrease in smoking behavior among men is offsetting the adverse effects of some other factor acting on both genders. 143 A contributing factor could be increased hygiene 36 and age at EBV infection.
Figure 5.


A) Change in prevalence of smoking behavior in men and women in Canada by birth cohort; B) Changing female:male sex ratio of multiple sclerosis by birth cohort observed in Canada and that expected from changing smoking behaviors, assuming a relative risk of smoking on MS among men=2.7. Adapted from 143.
Numerous mechanisms have been proposed to explain the adverse effects of smoking on MS risk, including demyelination 144, 145, disruption of the blood-brain barrier 146, immunomodulatory effects 147, 148, and increased nitric oxide and nitric oxide metabolites 149, but all remain speculative. The observation that tobacco smoking, but not Swedish tobacco snuff, is strongly associated with an increased MS risk, suggests that combustion or inhalation are required for toxicity. 138 There is also evidence that MS progresses at a faster rate among smokers, based on both clinical and radiological findings. 135, 150 Although the direct adverse effect of smoking on MS progression is likely to be moderate at best, there is no doubt that smoking cessation should be part of a sound treatment plan for MS, to reduce risk of comorbidity.
Integration of environmental and genetic risk factors
The results of epidemiological studies suggests that EBV infection or markers of immune response to EBV infection (IM and anti-EBNA titers), vitamin D insufficiency, and smoking, act independently from each other 48, 151 and from genetic susceptibility152 to increase MS risk. In this context, independently means that the relative risk associated with each factor remains constant across levels of the remaining factors. Thus, the expected risk of an individual who smoked >=25 pack-years, is vitamin D deficient, and has a history of IM, would be 1.7 × 2 × 2.3 = ~ 8 times higher than that of an individuals without any risk factor. The strongest non-genetic risk factor, however, remains the level of anti-EBNA antibodies, with about a 30 fold increase between the lowest and highest EBNA IgG titer levels among individuals who are EBV positive. In the extreme, risk of MS may thus vary more than 200 folds (8 × 30) according to the presence or absence of known non -genetic risk factors, and more than 400 folds if the HLA-DRB1*1501 genotype is considered. This high relative risk, however, is driven by the fact that individuals without any risk factors have an extremely low risk of MS, and it remains therefore difficult to identify individuals at high absolute risk of MS, with the exception of monozygotic twins of individuals with MS.
Conclusions and future directions
During the last decade, substantial progress has been made in understanding the risk factors for MS. Vitamin D supplementation and smoking cessation are immediately available interventions that are likely to reduce MS risk and to improve the outcomes of individuals with CIS or MS. Further benefits could be achieved by exposing infants to EBV infection, but remaining uncertainty and current societal norms do not favor this type of intervention. In the short term, further observational studies as well as randomized trials of vitamin D should provide more definitive evidence on whom should take supplements, when, and how much for both primary prevention, secondary prevention, and treatment. In the long term, an in depth elucidation of how EBV interferes with the development of MS could lead to new approaches to prevention and treatment.
Key Points.
The etiology of MS is multifactorial with both genetic and environmental contributors.
There is strong evidence supporting a causal role for Epstein-Barr virus infection in MS development including the observation that a primary infection with EBV strongly increases the risk for MS, history of infectious mononucleosis (late age at EBV infection) increases MS risk, and elevation of pre-MS onset antibody titers to EBV nuclear antigen.
Longitudinal studies of supplemental vitamin D intake and pre-onset serum levels of 25-hydroxyvitamin D support a protective effect of vitamin D on MS risk and variants in the CYP27B1 gene (which encode the 1-α hydroxylase necessary in vitamin D activation) have been associated with MS risk, further supporting a potential causal role.
Cigarette smoking has been associated with an increased risk of MS in men and women, and changes in smoking patterns in both sexes may partially explain the increasing female:male sex ratio in MS.
Less is known about the mechanisms of how EBV infection, vitamin D metabolism, and cigarette smoking influences MS risk, and additional studies in this area are needed.
Acknowledgments
This work was funded by grants R01 NS046635, R01 NS073633 and R01 NS071082 from the National Institutes of Health. The authors would like to thank Ms. Leslie Unger, Harvard School of Public Health, for her technical assistance in preparing this manuscript.
References
- 1.MacMahon B, Trichopolous D. Epidemiology: principles and methods. Little, Brown, & Co; Boston: 1996. [Google Scholar]
- 2.Czeizel AE, Dudas I. Prevention of the first occurrence of neural-tube defects by periconceptional vitamin supplementation. N Engl J Med. 1992;327:1832–5. doi: 10.1056/NEJM199212243272602. [DOI] [PubMed] [Google Scholar]
- 3.Dwyer T, Ponsonby AL, Blizzard L, Newman NM, Cochrane JA. The contribution of changes in the prevalence of prone sleeping position to the decline in sudden infant death syndrome in Tasmania. JAMA. 1995;273:783–9. [PubMed] [Google Scholar]
- 4.McMahon BJ, et al. Elimination of hepatocellular carcinoma and acute hepatitis B in children 25 years after a hepatitis B newborn and catch-up immunization program. Hepatology. 2011;54:801–7. doi: 10.1002/hep.24442. [DOI] [PubMed] [Google Scholar]
- 5.Koch-Henriksen N. The Danish Multiple Sclerosis Registry: a 50-year follow-up. Mult Scler. 1999;5:293–6. doi: 10.1177/135245859900500418. [DOI] [PubMed] [Google Scholar]
- 6.Mayr WT, et al. Incidence and prevalence of multiple sclerosis in Olmsted County, Minnesota, 1985–2000. Neurology. 2003;61:1373–1377. doi: 10.1212/01.wnl.0000094316.90240.eb. [DOI] [PubMed] [Google Scholar]
- 7.Compston A, Coles A. Multiple sclerosis. Lancet. 2002;359:1221–31. doi: 10.1016/S0140-6736(02)08220-X. [DOI] [PubMed] [Google Scholar]
- 8.Kurtzke JF, Beebe GW, Norman JE. Epidemiology of multiple sclerosis in U.S. veterans: 1. Race, sex, and geographic distribution. Neurology. 1979;29:1228–1235. doi: 10.1212/wnl.29.9_part_1.1228. [DOI] [PubMed] [Google Scholar]
- 9.Wallin MT, Page WF, Kurtzke JF. Multiple sclerosis in US veterans of the Vietnam era and later military service: Race, sex, and geography. Ann Neurol. 2004;55:65–71. doi: 10.1002/ana.10788. [DOI] [PubMed] [Google Scholar]
- 10.Wallin MT, et al. The Gulf War era multiple sclerosis cohort: age and incidence rates by race, sex and service. Brain. 2012;135:1778–1785. doi: 10.1093/brain/aws099. [DOI] [PubMed] [Google Scholar]
- 11.Hansen T, et al. Concordance for multiple sclerosis in Danish twins: an update of a nationwide study. Mult Scler. 2005;11:504–10. doi: 10.1191/1352458505ms1220oa. [DOI] [PubMed] [Google Scholar]
- 12.Willer CJ, Dyment DA, Risch NJ, Sadovnick AD, Ebers GC. Twin concordance and sibling recurrence rates in multiple sclerosis. Proc Natl Acad Sci U S A. 2003;100:12877–82. doi: 10.1073/pnas.1932604100. [DOI] [PMC free article] [PubMed] [Google Scholar]
- 13.Ebers GC, Sadovnick AD, Risch NJ. A genetic basis for familial aggregation in multiple sclerosis. Canadian Collaborative Study Group. Nature. 1995;377:150–1. doi: 10.1038/377150a0. [DOI] [PubMed] [Google Scholar]
- 14.Schmidt H, Williamson D, Ashley-Koch A. HLA-DR15 Haplotype and Multiple Sclerosis: A HuGE Review. Am J Epidemiol. 2007;165:1097–109. doi: 10.1093/aje/kwk118. [DOI] [PubMed] [Google Scholar]
- 15.Sadovnick AD. Genetic background of multiple sclerosis. Autoimmun Rev. 2012;11:163–6. doi: 10.1016/j.autrev.2011.05.007. [DOI] [PubMed] [Google Scholar]
- 16.Marrosu MG, et al. Multiple sclerosis in Sardinia is associated and in linkage disequilibrium with HLA-DR3 and -DR4 alleles. Am J Hum Genet. 1997;61:454–7. doi: 10.1016/S0002-9297(07)64074-9. [DOI] [PMC free article] [PubMed] [Google Scholar]
- 17.Haines JL, et al. Linkage of the MHC to familial multiple sclerosis suggests genetic heterogeneity. The Multiple Sclerosis Genetics Group. Hum Mol Genet. 1998;7:1229–34. doi: 10.1093/hmg/7.8.1229. [DOI] [PubMed] [Google Scholar]
- 18.Lincoln MR, et al. Epistasis among HLA-DRB1, HLA-DQA1, and HLA-DQB1 loci determines multiple sclerosis susceptibility. Proc Natl Acad Sci U S A. 2009;106:7542–7. doi: 10.1073/pnas.0812664106. [DOI] [PMC free article] [PubMed] [Google Scholar]
- 19.Patsopoulos NA, de Bakker PI. Genome-wide meta-analysis identifies novel multiple sclerosis susceptibility loci. Ann Neurol. 2011;70:897–912. doi: 10.1002/ana.22609. [DOI] [PMC free article] [PubMed] [Google Scholar]
- 20.Ramagopalan SV, et al. Rare variants in the CYP27B1 gene are associated with multiple sclerosis. Ann Neurol. 2011;70:881–6. doi: 10.1002/ana.22678. [DOI] [PubMed] [Google Scholar]
- 21.Alonso A, Hernan MA, Ascherio A. Allergy, family history of autoimmune diseases, and the risk of multiple sclerosis. Acta Neurol Scand. 2008;117:15–20. doi: 10.1111/j.1600-0404.2007.00898.x. [DOI] [PubMed] [Google Scholar]
- 22.Zorzon M, et al. Risk factors of multiple sclerosis: a case-control study. Neurol Sci. 2003;24:242–7. doi: 10.1007/s10072-003-0147-6. [DOI] [PubMed] [Google Scholar]
- 23.Acheson ED, Bachrach CA, Wright FM. Some comments on the relationship of the distribution of multiple sclerosis to latitude, solar radiation, and other variables. Acta Psychiatr Scand. 1960;147:132–147. doi: 10.1111/j.1600-0447.1960.tb08674.x. [DOI] [PubMed] [Google Scholar]
- 24.Gale CR, Martyn CN. Migrant studies in multiple sclerosis. Prog Neurobiol. 1995;47:425–448. [PubMed] [Google Scholar]
- 25.McLeod JG, Hammond SR, Kurtzke JF. Migration and multiple sclerosis in immigrants to Australia from United Kingdom and Ireland: a reassessment. I. Risk of MS by age at immigration. J Neurol. 2011;258:1140–9. doi: 10.1007/s00415-010-5898-4. [DOI] [PMC free article] [PubMed] [Google Scholar]
- 26.Kurtzke JF, Beebe GW, Norman JE. Epidemiology of multiple sclerosis in US veterans: III. Migration and the risk of MS. Neurology. 1985;35:672–678. doi: 10.1212/wnl.35.5.672. [DOI] [PubMed] [Google Scholar]
- 27.Hernán MA, Olek MJ, Ascherio A. Geographic variation of MS incidence in two prospective studies of US women. Neurology. 1999;53:1711–1718. doi: 10.1212/wnl.53.8.1711. [DOI] [PubMed] [Google Scholar]
- 28.Koch-Henriksen N, Sorensen PS. Why does the north-south gradient of incidence of multiple sclerosis seem to have disappeared on the Northern hemisphere? J Neurol Sci. 2011;311:58–63. doi: 10.1016/j.jns.2011.09.003. [DOI] [PubMed] [Google Scholar]
- 29.Simpson S, Jr, Blizzard L, Otahal P, Van der Mei I, Taylor B. Latitude is significantly associated with the prevalence of multiple sclerosis: a meta-analysis. J Neurol Neurosurg Psychiatry. 2011;82:1132–41. doi: 10.1136/jnnp.2011.240432. [DOI] [PubMed] [Google Scholar]
- 30.Taylor BV, et al. Latitudinal variation in incidence and type of first central nervous system demyelinating events. Mult Scler. 2010;16:398–405. doi: 10.1177/1352458509359724. [DOI] [PubMed] [Google Scholar]
- 31.Henle W, Henle G. In: The Epstein Barr Virus. Epstein MA, Achong BG, editors. Springer; Berlin Heidelberg New York: 1979. –61.pp. 78 [Google Scholar]
- 32.Takeuchi K, et al. Prevalence of Epstein-Barr virus in Japan: Trends and future prediction. Pathol Int. 2006;56:112–6. doi: 10.1111/j.1440-1827.2006.01936.x. [DOI] [PubMed] [Google Scholar]
- 33.Hallee TJ, Evans AS, Niederman JC, Brooks CM, Voegtly JH. Infectious mononucleosis at the United States Military Academy. A prospective study of a single class over four years. Yale J Biol Med. 1974;3:182–195. [PMC free article] [PubMed] [Google Scholar]
- 34.Warner HB, Carp RI. Multiple sclerosis and Epstein-Barr virus (letter) Lancet. 1981;2:1290. doi: 10.1016/s0140-6736(81)91527-0. [DOI] [PubMed] [Google Scholar]
- 35.Thacker EL, Mirzaei F, Ascherio A. Infectious mononucleosis and risk for multiple sclerosis: A meta-analysis. Ann Neurol. 2006;59:499–503. doi: 10.1002/ana.20820. [DOI] [PubMed] [Google Scholar]
- 36.Bach JF. The effect of infections on susceptibility to autoimmune and allergic diseases. N Engl J Med. 2002;347:911–20. doi: 10.1056/NEJMra020100. [DOI] [PubMed] [Google Scholar]
- 37.Ascherio A, Munch M. Epstein-Barr Virus and Multiple Sclerosis. Epidemiology. 2000;11:220–224. doi: 10.1097/00001648-200003000-00023. [DOI] [PubMed] [Google Scholar]
- 38.Ascherio A, Munger KL. Environmental risk factors for multiple sclerosis. Part I: The role of infection. Ann Neurol. 2007;61:288–299. doi: 10.1002/ana.21117. [DOI] [PubMed] [Google Scholar]
- 39.Alotaibi S, Kennedy J, Tellier R, Stephens D, Banwell B. Epstein-Barr virus in pediatric multiple sclerosis. JAMA. 2004;291:1875–9. doi: 10.1001/jama.291.15.1875. [DOI] [PubMed] [Google Scholar]
- 40.Pohl D, et al. High seroprevalence of Epstein-Barr virus in children with multiple sclerosis. Neurology. 2006;67:2063–5. doi: 10.1212/01.wnl.0000247665.94088.8d. [DOI] [PubMed] [Google Scholar]
- 41.Banwell B, et al. Clinical features and viral serologies in children with multiple sclerosis: a multinational observational study. Lancet Neurol. 2007;6:773–81. doi: 10.1016/S1474-4422(07)70196-5. [DOI] [PubMed] [Google Scholar]
- 42.Levin LI, Munger KL, O’Reilly EJ, Falk KI, Ascherio A. Primary infection with the Epstein-Barr virus and risk of multiple sclerosis. Ann Neurol. 2010;67:824–30. doi: 10.1002/ana.21978. [DOI] [PMC free article] [PubMed] [Google Scholar]
- 43.Beasley RP. Hepatitis B virus. The major etiology of hepatocellular carcinoma. Cancer. 1988;61:1942–56. doi: 10.1002/1097-0142(19880515)61:10<1942::aid-cncr2820611003>3.0.co;2-j. [DOI] [PubMed] [Google Scholar]
- 44.Ascherio A, et al. Epstein-barr virus antibodies and risk of multiple sclerosis: A prospective study. JAMA. 2001;286:3083–3088. doi: 10.1001/jama.286.24.3083. [DOI] [PubMed] [Google Scholar]
- 45.Levin LI, et al. Temporal relationship between elevation of Epstein Barr virus antibody titers and initial onset of neurological symptoms in multiple sclerosis. JAMA. 2005;293:2496–2500. doi: 10.1001/jama.293.20.2496. [DOI] [PubMed] [Google Scholar]
- 46.Sundstrom P, et al. An altered immune response to Epstein-Barr virus in multiple sclerosis: a prospective study. Neurology. 2004;62:2277–82. doi: 10.1212/01.wnl.0000130496.51156.d7. [DOI] [PubMed] [Google Scholar]
- 47.DeLorenze GN, et al. Epstein-Barr virus and multiple sclerosis: evidence of association from a prospective study with long-term follow-up. Arch Neurol. 2006;63:839–44. doi: 10.1001/archneur.63.6.noc50328. [DOI] [PubMed] [Google Scholar]
- 48.Munger KL, Levin LI, O’Reilly EJ, Falk KI, Ascherio A. Anti-Epstein-Barr virus antibodies as serological markers of multiple sclerosis: a prospective study among United States military personnel. Mult Scler. 2011;17:1185–93. doi: 10.1177/1352458511408991. [DOI] [PMC free article] [PubMed] [Google Scholar]
- 49.Simon KC, Saghafian-Hedengren S, Sverremark-Ekstrom E, Nilsson C, Ascherio A. Age at Epstein-Barr virus infection and Epstein-Barr virus nuclear antigen-1 antibodies in Swedish children. Multiple Sclerosis and Related Disorders. 2012 doi: 10.1016/j.msard.2012.03.002. In press. [DOI] [PubMed] [Google Scholar]
- 50.Lunemann JD, Munz C. EBV in MS: guilty by association? Trends Immunol. 2009;30:243–8. doi: 10.1016/j.it.2009.03.007. [DOI] [PubMed] [Google Scholar]
- 51.Lovett-Racke AE, et al. Decreased dependence of myelin basic protein-reactive T cells on CD28-mediated costimulation in multiple sclerosis patients. A marker of activated/memory T cells. J Clin Invest. 1998;101:725–30. doi: 10.1172/JCI1528. [DOI] [PMC free article] [PubMed] [Google Scholar]
- 52.Markovic-Plese S, Cortese I, Wandinger KP, McFarland HF, Martin R. CD4+CD28− costimulation-independent T cells in multiple sclerosis. J Clin Invest. 2001;108:1185–94. doi: 10.1172/JCI12516. [DOI] [PMC free article] [PubMed] [Google Scholar]
- 53.Viglietta V, Baecher-Allan C, Weiner HL, Hafler DA. Loss of functional suppression by CD4+CD25+ regulatory T cells in patients with multiple sclerosis. J Exp Med. 2004;199:971–9. doi: 10.1084/jem.20031579. [DOI] [PMC free article] [PubMed] [Google Scholar]
- 54.Lunemann JD, et al. Increased frequency and broadened specificity of latent EBV nuclear antigen-1-specific T cells in multiple sclerosis. Brain. 2006;129:1493–506. doi: 10.1093/brain/awl067. [DOI] [PubMed] [Google Scholar]
- 55.Munz C, et al. Human CD4(+) T lymphocytes consistently respond to the latent Epstein- Barr virus nuclear antigen EBNA1. J Exp Med. 2000;191:1649–60. doi: 10.1084/jem.191.10.1649. [DOI] [PMC free article] [PubMed] [Google Scholar]
- 56.Lunemann JD, et al. EBNA1-specific T cells from patients with multiple sclerosis cross react with myelin antigens and co-produce IFN-{gamma} and IL-2. J Exp Med. 2008;205:1763–73. doi: 10.1084/jem.20072397. [DOI] [PMC free article] [PubMed] [Google Scholar]
- 57.Hauser SL, et al. B-cell depletion with rituximab in relapsing-remitting multiple sclerosis. N Engl J Med. 2008;358:676–88. doi: 10.1056/NEJMoa0706383. [DOI] [PubMed] [Google Scholar]
- 58.Thorley-Lawson DA. Epstein-Barr virus: exploiting the immune system. Nat Rev Immunol. 2001;1:75–82. doi: 10.1038/35095584. [DOI] [PubMed] [Google Scholar]
- 59.Caldwell RG, Wilson JB, Anderson SJ, Longnecker R. Epstein-Barr virus LMP2A drives B cell development and survival in the absence of normal B cell receptor signals. Immunity. 1998;9:405–11. doi: 10.1016/s1074-7613(00)80623-8. [DOI] [PubMed] [Google Scholar]
- 60.Pender MP. Infection of autoreactive B lymphocytes with EBV, causing chronic autoimmune diseases. Trends Immunol. 2003;24:584–8. doi: 10.1016/j.it.2003.09.005. [DOI] [PubMed] [Google Scholar]
- 61.Lassmann H, Niedobitek G, Aloisi F, Middeldorp JM. Epstein-Barr virus in the multiple sclerosis brain: a controversial issue--report on a focused workshop held in the Centre for Brain Research of the Medical University of Vienna, Austria. Brain. 2011;134:2772–86. doi: 10.1093/brain/awr197. [DOI] [PMC free article] [PubMed] [Google Scholar]
- 62.Tzartos JS, et al. Association of innate immune activation with latent Epstein-Barr virus in active MS lesions. Neurology. 2012;78:15–23. doi: 10.1212/WNL.0b013e31823ed057. [DOI] [PubMed] [Google Scholar]
- 63.Munz C, Lunemann JD, Getts MT, Miller SD. Antiviral immune responses: triggers of or triggered by autoimmunity? Nat Rev Immunol. 2009;9:246–58. doi: 10.1038/nri2527. [DOI] [PMC free article] [PubMed] [Google Scholar]
- 64.Salmi AA, Panelius M, Halonen P, Rinne UK, Penttinen K. Measles virus antibody in cerebrospinal fluids from patients with multiple sclerosis. Br Med J. 1972;1:477–9. doi: 10.1136/bmj.1.5798.477. [DOI] [PMC free article] [PubMed] [Google Scholar]
- 65.Vartdal F, Vandvik B, Norrby E. Viral and bacterial antibody responses in multiple sclerosis. Ann Neurol. 1980;8:248–55. doi: 10.1002/ana.410080305. [DOI] [PubMed] [Google Scholar]
- 66.Derfuss T, Hohlfeld R, Meinl E. Intrathecal antibody (IgG) production against human herpesvirus type 6 occurs in about 20% of multiple sclerosis patients and might be linked to a polyspecific B-cell response. J Neurol. 2005;252:986–71. doi: 10.1007/s00415-005-0794-z. [DOI] [PubMed] [Google Scholar]
- 67.Jacobi C, Lange P, Reiber H. Quantitation of intrathecal antibodies in cerebrospinal fluid of subacute sclerosing panencephalitis, herpes simplex encephalitis and multiple sclerosis: discrimination between microorganism-driven and polyspecific immune response. J Neuroimmunol. 2007;187:139–46. doi: 10.1016/j.jneuroim.2007.04.002. [DOI] [PubMed] [Google Scholar]
- 68.Jarius S, et al. Polyspecific, antiviral immune response distinguishes multiple sclerosis and neuromyelitis optica. J Neurol Neurosurg Psychiatry. 2008;79:1134–6. doi: 10.1136/jnnp.2007.133330. [DOI] [PubMed] [Google Scholar]
- 69.Farrell RA, et al. Humoral immune response to EBV in multiple sclerosis is associated with disease activity on MRI. Neurology. 2009;73:32–8. doi: 10.1212/WNL.0b013e3181aa29fe. [DOI] [PMC free article] [PubMed] [Google Scholar]
- 70.Lunemann JD, et al. Elevated Epstein-Barr virus-encoded nuclear antigen-1 immune responses predict conversion to multiple sclerosis. Ann Neurol. 2010;67:159–169. doi: 10.1002/ana.21886. [DOI] [PMC free article] [PubMed] [Google Scholar]
- 71.Lunemann JD, Ascherio A. Immune responses to EBNA1. Biomarkers in MS? Neurology. 2009;73:13–4. doi: 10.1212/WNL.0b013e3181aa2a5f. [DOI] [PubMed] [Google Scholar]
- 72.Sokal EM, et al. Recombinant gp350 vaccine for infectious mononucleosis: a phase 2, randomized, double-blind, placebo-controlled trial to evaluate the safety, immunogenicity, and efficacy of an Epstein-Barr virus vaccine in healthy young adults. J Infect Dis. 2007;196:1749–53. doi: 10.1086/523813. [DOI] [PubMed] [Google Scholar]
- 73.Lycke J, et al. Acyclovir treatment of relapsing-remitting multiple sclerosis. A randomized, placebo-controlled, double-blind study. J Neurol. 1996;243:214–224. doi: 10.1007/BF00868517. [DOI] [PubMed] [Google Scholar]
- 74.Friedman JE, et al. A randomized clinical trial of valacyclovir in multiple sclerosis. Mult Scler. 2005;11:286–95. doi: 10.1191/1352458505ms1185oa. [DOI] [PubMed] [Google Scholar]
- 75.van der Mei IA, Ponsonby AL, Blizzard L, Dwyer T. Regional variation in multiple sclerosis prevalence in Australia and its association with ambient ultraviolet radiation. Neuroepidemiology. 2001;20:168–74. doi: 10.1159/000054783. [DOI] [PubMed] [Google Scholar]
- 76.Swank RL, Lerstad O, Strøm A, Backer J. Multiple sclerosis in rural Norway. Its geographic and occupational incidence in relation to nutrition. N Engl J Med. 1952;246:721–728. doi: 10.1056/NEJM195205082461901. [DOI] [PubMed] [Google Scholar]
- 77.Antonovsky A, et al. Epidemiologic study of multiple sclerosis in Israel. Arch Neurol. 1965;13:183–193. doi: 10.1001/archneur.1965.00470020073010. [DOI] [PubMed] [Google Scholar]
- 78.Cendrowski W, et al. Epidemiological study of multiple sclerosis in Western Poland. Eur Neurol. 1969;2:90–108. doi: 10.1159/000113777. [DOI] [PubMed] [Google Scholar]
- 79.van der Mei IAF, et al. Past exposure to sun, skin phenotype and risk of multiple sclerosis: a case-control study. BMJ. 2003;327:316–21. doi: 10.1136/bmj.327.7410.316. [DOI] [PMC free article] [PubMed] [Google Scholar]
- 80.Kampman MT, Wilsgaard T, Mellgren SI. Outdoor activities and diet in childhood and adolescence relate to MS risk above the Arctic Circle. J Neurol. 2007;254:471–7. doi: 10.1007/s00415-006-0395-5. [DOI] [PubMed] [Google Scholar]
- 81.Ascherio A, Munger KL, Simon KC. Vitamin D and multiple sclerosis. Lancet Neurol. 2010;9:599–612. doi: 10.1016/S1474-4422(10)70086-7. [DOI] [PubMed] [Google Scholar]
- 82.Munger KL, et al. Vitamin D intake and incidence of multiple sclerosis. Neurology. 2004;62:60–65. doi: 10.1212/01.wnl.0000101723.79681.38. [DOI] [PubMed] [Google Scholar]
- 83.Feskanich D, Willett WC, Colditz GA. Calcium, vitamin D, milk consumption, and hip fractures: a prospective study among postmenopausal women. Am J Clin Nutr. 2003;77:504–11. doi: 10.1093/ajcn/77.2.504. [DOI] [PubMed] [Google Scholar]
- 84.Hollis BW. Circulating 25-hydroxyvitamin D levels indicative of vitamin D sufficiency: implications for establishing a new effective dietary intake recommendation for vitamin D. J Nutr. 2005;135:317–22. doi: 10.1093/jn/135.2.317. [DOI] [PubMed] [Google Scholar]
- 85.Bischoff-Ferrari HA, Giovannucci E, Willett WC, Dietrich T, Dawson-Hughes B. Estimation of optimal serum concentrations of 25-hydroxyvitamin D for multiple health outcomes. Am J Clin Nutr. 2006;84:18–28. doi: 10.1093/ajcn/84.1.18. [DOI] [PubMed] [Google Scholar]
- 86.Yetley EA. Assessing the vitamin D status of the US population. Am J Clin Nutr. 2008;88:558S–564S. doi: 10.1093/ajcn/88.2.558S. [DOI] [PubMed] [Google Scholar]
- 87.Looker AC, et al. Serum 25-hydroxyvitamin D status of the US population: 1988–1994 compared with 2000–2004. Am J Clin Nutr. 2008;88:1519–27. doi: 10.3945/ajcn.2008.26182. [DOI] [PMC free article] [PubMed] [Google Scholar]
- 88.Gozdzik A, et al. Low wintertime vitamin D levels in a sample of healthy young adults of diverse ancestry living in the Toronto area: Associations with vitamin D intake and skin pigmentation. BMC Public Health. 2008;8:336. doi: 10.1186/1471-2458-8-336. [DOI] [PMC free article] [PubMed] [Google Scholar]
- 89.Gonzalez-Gross M, et al. Vitamin D status among adolescents in Europe: the Healthy Lifestyle in Europe by Nutrition in Adolescence study. Br J Nutr. 2012;107:755–64. doi: 10.1017/S0007114511003527. [DOI] [PubMed] [Google Scholar]
- 90.Munger KL, Levin LI, Hollis BW, Howard NS, Ascherio A. Serum 25-hydroxyvitamin D levels and risk of multiple sclerosis. JAMA. 2006;296:2832–8. doi: 10.1001/jama.296.23.2832. [DOI] [PubMed] [Google Scholar]
- 91.Lucas RM, et al. Sun exposure and vitamin D are independent risk factors for CNS demyelination. Neurology. 2011;76:540–8. doi: 10.1212/WNL.0b013e31820af93d. [DOI] [PubMed] [Google Scholar]
- 92.Ascherio A, et al. Sun exposure and vitamin D are independent risk factors for CNS demyelination. Neurology. 2011;77:1405–1406. doi: 10.1212/WNL.0b013e3182294610. [DOI] [PubMed] [Google Scholar]
- 93.Lucas RM, Ponsonby AL. Considering the potential benefits as well as adverse effects of sun exposure: can all the potential benefits be provided by oral vitamin D supplementation? Prog Biophys Mol Biol. 2006;92:140–9. doi: 10.1016/j.pbiomolbio.2006.02.019. [DOI] [PubMed] [Google Scholar]
- 94.Sundqvist E, et al. Confirmation of association between multiple sclerosis and CYP27B1. Eur J Hum Genet. 2010;18:1349–52. doi: 10.1038/ejhg.2010.113. [DOI] [PMC free article] [PubMed] [Google Scholar]
- 95.Simon KC, et al. Genetic predictors of 25-hydroxyvitamin D levels and risk of multiple sclerosis. J Neurol. 2011;258:1676–82. doi: 10.1007/s00415-011-6001-5. [DOI] [PMC free article] [PubMed] [Google Scholar]
- 96.Wang JT, et al. Genetics of vitamin D 1alpha-hydroxylase deficiency in 17 families. Am J Hum Genet. 1998;63:1694–702. doi: 10.1086/302156. [DOI] [PMC free article] [PubMed] [Google Scholar]
- 97.Torkildsen O, Knappskog PM, Nyland HI, Myhr KM. Vitamin D-dependent rickets as a possible risk factor for multiple sclerosis. Arch Neurol. 2008;65:809–11. doi: 10.1001/archneur.65.6.809. [DOI] [PubMed] [Google Scholar]
- 98.Munger KL, Chitnis T, Ascherio A. Body size and risk of MS in two cohorts of US women. Neurology. 2009;73:1543–50. doi: 10.1212/WNL.0b013e3181c0d6e0. [DOI] [PMC free article] [PubMed] [Google Scholar]
- 99.Hedstrom AK, Olsson T, Alfredsson L. High body mass index before age 20 is associated with increased risk for multiple sclerosis in both men and women. Mult Scler. 2012 doi: 10.1177/1352458512436596. [DOI] [PubMed] [Google Scholar]
- 100.Mirzaei F, et al. Gestational Vitamin D and the Risk of Multiple Sclerosis in Offspring. Ann Neurol. 2011;70:30–40. doi: 10.1002/ana.22456. [DOI] [PMC free article] [PubMed] [Google Scholar]
- 101.Willer CJ, et al. Timing of birth and risk of multiple sclerosis: population based study. BMJ. 2005;330:120. doi: 10.1136/bmj.38301.686030.63. [DOI] [PMC free article] [PubMed] [Google Scholar]
- 102.Staples J, Ponsonby AL, Lim L. Low maternal exposure to ultraviolet radiation in pregnancy, month of birth, and risk of multiple sclerosis in offspring: longitudinal analysis. BMJ. 2010;340 doi: 10.1136/bmj.c1640. [DOI] [PMC free article] [PubMed] [Google Scholar]
- 103.Bock G, et al. The effect of vitamin D supplementation on peripheral regulatory T cells and beta cell function in healthy humans: a randomized controlled trial. Diabetes Metab Res Rev. 2011;27:942–5. doi: 10.1002/dmrr.1276. [DOI] [PubMed] [Google Scholar]
- 104.Mahon BD, Gordon SA, Cruz J, Cosman F, Cantorna MT. Cytokine profile in patients with multiple sclerosis following vitamin D supplementation. J Neuroimmunol. 2003;134:128–32. doi: 10.1016/s0165-5728(02)00396-x. [DOI] [PubMed] [Google Scholar]
- 105.Burton JM, et al. A phase I/II dose-escalation trial of vitamin D3 and calcium in multiple sclerosis. Neurology. 2010;74:1852–9. doi: 10.1212/WNL.0b013e3181e1cec2. [DOI] [PMC free article] [PubMed] [Google Scholar]
- 106.Smolders J, et al. Safety and T cell modulating effects of high dose vitamin D3 supplementation in multiple sclerosis. PLoS One. 2010;5:e15235. doi: 10.1371/journal.pone.0015235. [DOI] [PMC free article] [PubMed] [Google Scholar]
- 107.Jorde R, et al. No effect of supplementation with cholecalciferol on cytokines and markers of inflammation in overweight and obese subjects. Cytokine. 2010;50:175–80. doi: 10.1016/j.cyto.2009.12.006. [DOI] [PubMed] [Google Scholar]
- 108.Schleithoff SS, et al. Vitamin D supplementation improves cytokine profiles in patients with congestive heart failure: a double-blind, randomized, placebo-controlled trial. Am J Clin Nutr. 2006;83:754–9. doi: 10.1093/ajcn/83.4.754. [DOI] [PubMed] [Google Scholar]
- 109.Haddad JG, Chyu KJ. Competitive protein-binding radioassay for 25-hydroxycholecalciferol. J Clin Endocrinol Metab. 1971;33:992–5. doi: 10.1210/jcem-33-6-992. [DOI] [PubMed] [Google Scholar]
- 110.Better OS, et al. In: Phosphate and minerals in health and disease. Massry SG, Ritz E, Jahreis G, editors. Plenum Press; New York: 1980. pp. 467–72. [Google Scholar]
- 111.Knippenberg S, et al. Effect of vitamin D3 supplementation on peripheral B cell differentiation and isotype switching in patients with multiple sclerosis. Mult Scler. 2011;17:1418–23. doi: 10.1177/1352458511412655. [DOI] [PubMed] [Google Scholar]
- 112.Peelen E, et al. Effects of vitamin D on the peripheral adaptive immune system: a review. Autoimmun Rev. 2011;10:733–43. doi: 10.1016/j.autrev.2011.05.002. [DOI] [PubMed] [Google Scholar]
- 113.Liu PT, et al. Toll-Like Receptor Triggering of a Vitamin D-Mediated Human Antimicrobial Response. Science. 2006;311:1770–3. doi: 10.1126/science.1123933. [DOI] [PubMed] [Google Scholar]
- 114.Laaksi I, et al. An association of serum vitamin D concentrations < 40 nmol/L with acute respiratory tract infection in young Finnish men. Am J Clin Nutr. 2007;86:714–7. doi: 10.1093/ajcn/86.3.714. [DOI] [PubMed] [Google Scholar]
- 115.Ginde AA, Mansbach JM, Camargo CA., Jr Association between serum 25-hydroxyvitamin D level and upper respiratory tract infection in the Third National Health and Nutrition Examination Survey. Arch Intern Med. 2009;169:384–90. doi: 10.1001/archinternmed.2008.560. [DOI] [PMC free article] [PubMed] [Google Scholar]
- 116.Andersen O, Lygner PE, Bergstrom T, Andersson M, Vahlne A. Viral infections trigger multiple sclerosis relapses: a prospective seroepidemiological study. J Neurol. 1993;240:417–22. doi: 10.1007/BF00867354. [DOI] [PubMed] [Google Scholar]
- 117.Panitch HS. Influence of infection on exacerbations of multiple sclerosis. Ann Neurol. 1994;36:S25–8. doi: 10.1002/ana.410360709. [DOI] [PMC free article] [PubMed] [Google Scholar]
- 118.Buljevac D, et al. Prospective study on the relationship between infections and multiple sclerosis exacerbations. Brain. 2002;125:952–60. doi: 10.1093/brain/awf098. [DOI] [PubMed] [Google Scholar]
- 119.Norgaard M, et al. Use of Penicillin and Other Antibiotics and Risk of Multiple Sclerosis: A Population-based Case-Control Study. Am J Epidemiol. 2011;174:945–8. doi: 10.1093/aje/kwr201. [DOI] [PubMed] [Google Scholar]
- 120.Banwell B, et al. Clinical, environmental, and genetic determinants of multiple sclerosis in children with acute demyelination: a prospective national cohort study. Lancet Neurol. 2011;10:436–45. doi: 10.1016/S1474-4422(11)70045-X. [DOI] [PubMed] [Google Scholar]
- 121.Smolders J, Menheere P, Kessels A, Damoiseaux J, Hupperts R. Association of vitamin D metabolite levels with relapse rate and disability in multiple sclerosis. Mult Scler. 2008;14:1220–4. doi: 10.1177/1352458508094399. [DOI] [PubMed] [Google Scholar]
- 122.Mowry EM, et al. Vitamin D status is associated with relapse rate in pediatric-onset multiple sclerosis. Ann Neurol. 2010;67:618–24. doi: 10.1002/ana.21972. [DOI] [PubMed] [Google Scholar]
- 123.Simpson S, Jr, et al. Higher 25-hydroxyvitamin D is associated with lower relapse risk in multiple sclerosis. Ann Neurol. 2010;68:193–203. doi: 10.1002/ana.22043. [DOI] [PubMed] [Google Scholar]
- 124.Runia TF, Hop WCJ, De Rijke YB, Buljevac D, Hintzen RQ. Lower serum vitamin D levels are associated with a higher relapse risk in multiple sclerosis. Neurology. 2012 doi: 10.1212/WNL.0b013e31825fdec7. In press. [DOI] [PubMed] [Google Scholar]
- 125.Stewart N, et al. Vitamin D and disease activity in multiple sclerosis before and during interferon beta treatment. Neurology. 2012 doi: 10.1212/WNL.0b013e31825fdf01. In press. [DOI] [PubMed] [Google Scholar]
- 126.Ascherio A, Marrie RA. Vitamin D in MS: A vitamin for four seasons. Neurology. 2012 doi: 10.1212/WNL.0b013e31825fe131. In press. [DOI] [PubMed] [Google Scholar]
- 127.Soilu-Hanninen M, et al. A randomised, double blind, placebo controlled trial with vitamin D3 as an add on treatment to interferon beta-1b in patients with multiple sclerosis. J Neurol Neurosurg Psychiatry. 2012;83:565–71. doi: 10.1136/jnnp-2011-301876. [DOI] [PubMed] [Google Scholar]
- 128.Munger KL, et al. Pre-clinical serum 25-hydroxyvitamin D levels and risk of type 1 diabetes in a cohort of US military personnel. Am J Epidemiol. 2012 doi: 10.1093/aje/kws243. In press. [DOI] [PMC free article] [PubMed] [Google Scholar]
- 129.Camargo CA, Jr, et al. Maternal intake of vitamin D during pregnancy and risk of recurrent wheeze in children at 3 y of age. Am J Clin Nutr. 2007;85:788–95. doi: 10.1093/ajcn/85.3.788. [DOI] [PMC free article] [PubMed] [Google Scholar]
- 130.Wallace RB, et al. Urinary tract stone occurrence in the Women’s Health Initiative randomized clinical trial of calcium and vitamin D supplements. Am J Clin Nutr. 2011;94:270–7. doi: 10.3945/ajcn.110.003350. [DOI] [PMC free article] [PubMed] [Google Scholar]
- 131.Heaney RP, Davies KM, Chen TC, Holick MF, Barger-Lux MJ. Human serum 25-hydroxycholecalciferol response to extended oral dosing with cholecalciferol. Am J Clin Nutr. 2003;77:204–10. doi: 10.1093/ajcn/77.1.204. [DOI] [PubMed] [Google Scholar]
- 132.Vieth R. Vitamin D supplementation, 25-hydroxyvitamin D concentrations and safety. Am J Clin Nutr. 1999;69:842–856. doi: 10.1093/ajcn/69.5.842. [DOI] [PubMed] [Google Scholar]
- 133.IOM (Institute of Medicine) The National Academies Press; Washington, DC: 2011. [Google Scholar]
- 134.Hernán MA, Olek MJ, Ascherio A. Cigarette smoking and incidence of multiple sclerosis. Am J Epidemiol. 2001;154:69–74. doi: 10.1093/aje/154.1.69. [DOI] [PubMed] [Google Scholar]
- 135.Hernan MA, et al. Cigarette smoking and the progression of multiple sclerosis. Brain. 2005;128:1461–5. doi: 10.1093/brain/awh471. [DOI] [PubMed] [Google Scholar]
- 136.Villard-Mackintosh L, Vessey MP. Oral contraceptives and reproductive factors in multiple sclerosis incidence. Contraception. 1993;47:161–168. doi: 10.1016/0010-7824(93)90088-o. [DOI] [PubMed] [Google Scholar]
- 137.Thorogood M, Hannaford PC. The influence of oral contraceptives on the risk of mulitple sclerosis. Br J Obstet Gynaecol. 1998;105:1296–1299. doi: 10.1111/j.1471-0528.1998.tb10008.x. [DOI] [PubMed] [Google Scholar]
- 138.Hedstrom AK, Baarnhielm M, Olsson T, Alfredsson L. Tobacco smoking, but not Swedish snuff use, increases the risk of multiple sclerosis. Neurology. 2009;73:696–701. doi: 10.1212/WNL.0b013e3181b59c40. [DOI] [PubMed] [Google Scholar]
- 139.Riise T, Nortvedt MW, Ascherio A. Smoking is a risk factor for multiple sclerosis. Neurology. 2003;61:1122–4. doi: 10.1212/01.wnl.0000081305.66687.d2. [DOI] [PubMed] [Google Scholar]
- 140.Sundstrom P, Nystrom L, Hallmans G. Smoke exposure increases the risk for multiple sclerosis. Eur J Neurol. 2008;15:579–83. doi: 10.1111/j.1468-1331.2008.02122.x. [DOI] [PubMed] [Google Scholar]
- 141.Orton SM, et al. Sex ratio of multiple sclerosis in Canada: a longitudinal study. Lancet Neurol. 2006;5:932–6. doi: 10.1016/S1474-4422(06)70581-6. [DOI] [PubMed] [Google Scholar]
- 142.Koch-Henriksen N, Sorensen PS. The changing demographic pattern of multiple sclerosis epidemiology. Lancet Neurol. 2010;9:520–32. doi: 10.1016/S1474-4422(10)70064-8. [DOI] [PubMed] [Google Scholar]
- 143.Palacios N, Alonso A, Bronnum-Hansen H, Ascherio A. Smoking and Increased Risk of Multiple Sclerosis: Parallel Trends in the Sex Ratio Reinforce the Evidence. Ann Epidemiol. 2011;21:536–42. doi: 10.1016/j.annepidem.2011.03.001. [DOI] [PMC free article] [PubMed] [Google Scholar]
- 144.Bass NH. Pathogenesis of myelin lesions in experimental cyanide encephalopathy. A microchemical study. Neurology. 1968;18:167–77. doi: 10.1212/wnl.18.2.167. [DOI] [PubMed] [Google Scholar]
- 145.Lessell S. Experimental cyanide optic neuropathy. Arch Ophthalmol. 1971;86:194–204. doi: 10.1001/archopht.1971.01000010196014. [DOI] [PubMed] [Google Scholar]
- 146.Chen JL, et al. Nicotine raises the influx of permeable solutes across the rat blood-brain barrier with little or no capillary recruitment. J Cereb Blood Flow Metab. 1995;15:687–98. doi: 10.1038/jcbfm.1995.85. [DOI] [PubMed] [Google Scholar]
- 147.Sopori ML, Kozak W. Immunomodulatory effects of cigarette smoke. J Neuroimmunol. 1998;83:148–56. doi: 10.1016/s0165-5728(97)00231-2. [DOI] [PubMed] [Google Scholar]
- 148.Francus T, Klein RF, Staiano-Coico L, Becker CG, Siskind GW. Effects of tobacco glycoprotein (TGP) on the immune system. II. TGP stimulates the proliferation of human T cells and the differentiation of human B cells into Ig secreting cells. J Immunol. 1988;140:1823–9. [PubMed] [Google Scholar]
- 149.Rejdak K, et al. CSF nitric oxide metabolites are associated with activity and progression of multiple sclerosis. Neurology. 2004;63:1439–45. doi: 10.1212/01.wnl.0000142043.32578.5d. [DOI] [PubMed] [Google Scholar]
- 150.Healy BC, et al. Smoking and disease progression in multiple sclerosis. Arch Neurol. 2009;66:858–64. doi: 10.1001/archneurol.2009.122. [DOI] [PMC free article] [PubMed] [Google Scholar]
- 151.Simon KC, et al. Combined effects of smoking, anti-EBNA antibodies, and HLA-DRB1*1501 on multiple sclerosis risk. Neurology. 2010;74:1365–71. doi: 10.1212/WNL.0b013e3181dad57e. [DOI] [PMC free article] [PubMed] [Google Scholar]
- 152.De Jager PL, et al. Integrating risk factors: HLA-DRB1*1501 and Epstein-Barr virus in multiple sclerosis. Neurology. 2008;70:1113–8. doi: 10.1212/01.wnl.0000294325.63006.f8. [DOI] [PubMed] [Google Scholar]