Figure 4. Anatomy and function of input from VG3-ACs to W3-RGCs.
(A) Orthogonal projections of a confocal image stack through a representative W3-retinal ganglion cell (RGC) labeled biolistically with cyan fluorescent protein (CFP). W3-RGCs were identified by their characteristic morphology (Kim et al., 2010; Zhang et al., 2012) with small dendritic fields (territory size: 10,783 ± 409 μm2, n = 25) filled by densely branched neurites stratifying in the center of the IPL with a secondary arborization near the border between the inner plexiform and inner nuclear layers (INLs). The fluorescent signal is colored to represent depth in the IPL. Inset bar graph shows the mean ± SEM territory size of W3-RGCs (n = 15) measured as the areas of the smallest convex polygons to encompass their arbors in a z-projection. (B, C) Overview projections (B) and single plane excerpts (C) of a W3-RGC biolistically labeled with CFP (red) and PSD95-YFP (green) in a VG3-Cre Ai9 mouse (tdTomato shown in blue). (D) Summary data indicating the fraction of PSD95-YFP puncta apposed by VG3-AC boutons (‘Materials and methods’) in the obtained images (real) or when positions of PSD95-YFP puncta were randomized within the synaptic layer (random) in Monte Carlo simulations (n = 9 cells, p < 10−6). Gray lines indicate data from individual cells; circles (error bars) show the mean (±SEM) of the population. (E–H) Representative EPSC (E) and spike response (G) traces to the texture motion stimulus illustrated in Figure 2A recorded from W3-RGCs (wild-type [WT] black, vesicular glutamate transporter 3 [VGluT3−/−] blue), and bar plots summarizing differences in excitatory conductance (F) and spike rates (H) during different segments of the stimulus in WT (left, black) and VGluT3−/− mice (right, blue). Bars (error bars) indicate the mean (±SEM) of the respective data sets. W3-RGC EPSCs in VGluT3−/− mice were significantly reduced compared to WT littermates during differential center motion (WT n = 8, VGluT3−/− n = 9, p < 0.02), but not global or differential surround motion (p > 0.1 for both). A similar pattern was observed in the spike responses of W3-RGCs, which were decreased for differential center motion (WT n = 13, VGluT3−/− n = 9, p < 0.001), but not altered during global image motion (p > 0.9). (I–L) Representative EPSC (I) and spike response (K) traces, and summary data (excitation in J, spikes in L, mean ± SEM) recorded in W3-RGCs during stimulation with dark bars of different heights (indicated by color saturation) moving at 400 μm/s in WT (left, black) and VGluT3−/− mice (right, blue). Whereas excitatory inputs and spike responses were reduced for narrow bars (excitation at 100 μm, WT n = 6, VGluT3−/− n = 6, p < 0.03, spikes at 100 μm, WT n = 14, VGluT3−/− n = 8, p < 0.01), they did not differ significantly for bars of greater heights (excitation at 600 μm, WT n = 6, VGluT3−/− n = 6, p > 0.6, spikes at 600 μm, WT n = 14, VGluT3−/− n = 8, p < 0.2). See also Figure 2—figure supplement 1, Figure 4—figure supplement 1 and Figure 4—figure supplement 2.

Figure 4—figure supplement 1. Detection of object motion by W3-RGCs.

Figure 4—figure supplement 2. Lamination patterns of cells and neurites are preserved in VGluT3−/− mice.

Figure 4—figure supplement 3. Dendritic morphology of W3-RGCs is unchanged in VGluT3−/− mice.

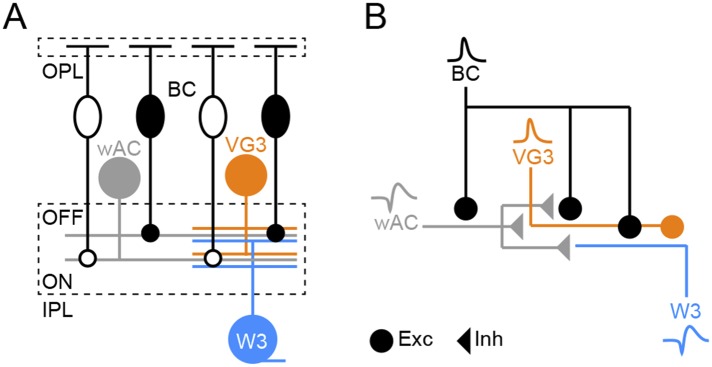
Figure 4—figure supplement 4. Schematic of object motion detection circuit.