

Abstract
The study investigated the efficacy and safety of a combination therapy of 1,000 mg aspirin (ASA) and 60 mg pseudoephedrine (PSE) on the symptoms of pain (combined score for headache and sore throat) and nasal congestion in 833 patients with acute upper respiratory tract viral infection (URTI), over 4 hours after a single dose in the clinic and over 3 days with multiple doses at home. The study demonstrated that over 4 hours in the clinic the combination ASA plus PSE was superior to PSE or placebo for relief of pain symptoms measured subjectively with pain scores, and was superior to ASA or placebo for relief of nasal congestion as measured objectively with rhinomanometry and subjectively with congestion scores. After 3 days of treatment, ASA plus PSE was superior to PSE but not to placebo or ASA for global pain assessments, and ASA plus PSE was superior to ASA and placebo but not to PSE for congestion assessments. No unexpected adverse events occurred and no serious adverse events were attributed to study medicines. This study demonstrates that a combination therapy of ASA plus PSE provides safe and effective relief of both common cold pain related symptoms and nasal congestion.
Keywords: acetylsalicylic acid, aspirin, pseudoephedrine, acute pain, headache, sore throat pain, upper respiratory tract infection, common cold, pharyngitis, nasal congestion, rhinomanometry
Acute upper respiratory tract viral infections (URTI) are one of the most common human diseases with adults suffering 2–5 symptomatic infections a year and most school children having 7–10 URTI.1 Even with the most conservative estimate of two URTI a year per person this would indicate at least 600 million cases of URTI (colds and flu) each year in the USA. Over 200 serologically different viral types from eight different groups of viruses are responsible for human URTI's with the rhinoviruses being the most common cause.1,2 The symptoms of URTI's are so common that self-diagnosis is normal amongst the general public3 and symptomatic self-treatments with non-prescription medicines are the most common therapy.
Symptoms of URTI are caused by the immune response to viral infection,4 which generates a complex mix of pro-inflammatory mediators with bradykinin prostaglandins and numerous cytokines causing vasodilation of blood vessels, glandular secretion, pain, and fever.3 Vasodilation of nasal blood vessels causes the symptom of nasal congestion by swelling venous sinuses in the nasal epithelium and this causes nasal obstruction.3,5 The inflammatory mediators bradykinin and prostaglandins cause pain related symptoms such as sore throat, headache, sinus pain, muscle aches, and ear ache.3 Nasal congestion can be treated by sympathomimetics such as pseudoephedrine that cause a constriction of the nasal venous sinuses.5,6 The nasal blood vessels are the most sensitive blood vessels in the body to circulating sympathomimetics being five times more sensitive than the heart7 and this allows sympathomimetics such as pseudoephedrine to cause nasal decongestion without any significant cardiovascular side effects. Pain related symptoms can be treated by analgesics such as aspirin that inhibit prostaglandin synthesis.8,9 The syndrome of symptoms occurring with URTI involves the simultaneous occurrence of several symptoms and nasal congestion and pain related symptoms commonly occur together.9–11
This study investigates the safety and efficacy of a symptomatic treatment for nasal congestion and pain symptoms associated with URTI, containing a fixed combination of both aspirin and pseudoephedrine. The rationale for the combination treatment is that both symptoms of congestion and pain commonly occur simultaneously and that a combination treatment provides a simplification of therapy compared to use of aspirin and pseudoephedrine as mono-therapies.
Methods
Patients
The study was performed on patients with nasal congestion and pain associated with URTI of no more than 3 days duration. The study was conducted at a single study center, at the Common Cold Centre, Cardiff University, UK. Patients were required to have an overall pain symptom (composite score for sore throat and/or headache) of at least moderate intensity, as recorded on a 4-point categorical scale consisting of no pain = 0, mild pain = 1, moderate pain = 2, and severe pain = 3, and at the same time nasal obstruction with a total nasal air flow resistance (NAR) of >0.25 Pa/cm3 second as determined by posterior rhinomanometry.12 Patients with a nasal resistance within the normal range at screening were excluded (≤0.25 Pa/cm3).13 The main reasons for exclusion were, allergic rhinitis, chronic respiratory disease, hyperthyroidism, cardiovascular disease, severe hypertension, peptic ulcer, and hypersensitivity to acetylsalicylic acid (ASA, aspirin) or pseudoephedrine (PSE). Some medications were not allowed prior to the study entry: for example, monoamine-oxidase inhibitors (30 days), antihistamines and antibiotics (7 days), analgesics and antipyretics (24 hours), nasal decongestants (12 hours), lozenges and throat sprays (6 hours), menthol containing products (6 hours). Patients under anti-coagulation therapy and pregnant or lactating females were also excluded from the study.
The study was conducted in compliance with Good Clinical Practice and approved by the South East Wales Research Ethics Committee in Cardiff.
Study Design
According to the European Medicines Agency Guideline “Guideline on Clinical Development of Fixed Combination Medicinal Products” fixed combination medicinal products containing two or more active substances, it is required to justify the particular combination of active substances, and to provide evidence that the combination has particular advantages in the clinical situation.14 Therefore this trial was designed to establish superiority of the combination ASA 1,000 mg and PSE 60 mg (Aspirin® Complex) versus ASA 1,000 mg and versus PSE 60 mg alone in the indications of pain and nasal congestion.
The study was designed as a randomized double-blind, placebo-controlled, four-arm, parallel group study. Treatments administered were two sachets (small disposable bags) of 500 mg ASA plus 30 mg PSE granules or two sachets of 500 mg ASA granules or 2 sachets of 30 mg PSE granules or two sachets of placebo granules. Sachets were taken orally after dissolving in a glass of water. Double blinding was guaranteed since it was not possible to distinguish between combination product, mono-therapies, and placebo granules. All treatments were dispensed as sachets containing white granules for dissolving in water, and they had the same appearance, taste, and no noticeable smell. Neither the investigators nor the patients were aware of the nature of the treatments and both were therefore blinded for any assessments. The placebo contained all the flavoring and excipients that were present in the other medications, which were sucrose, hypromellose binder, orange flavor, and citric acid.
Patients made two visits to the clinic. At visit 1, screening and baseline assessments were completed. Eligible patients received a single dose of medication, and assessment of nasal airflow resistance, pain relief, pain intensity, nasal congestion relief, and nasal congestion intensity were made at 1, 2, 3, and 4 hours after dosing. After the 4 hours assessments were completed, patients left the center and they were asked to take 1–2 more doses on Day 1 and 3 doses per day for Days 2 and 3 with a minimum dosing interval of 4 hours. At the evenings of Days 1–3, patients were asked to assess pain intensity, pain relief, nasal congestion intensity, and nasal congestion relief. At the evening of Day 3, global assessment of pain relief and global assessment of nasal congestion relief was requested in addition to the other scores. Patients were instructed to return to the center for visit 2 (follow-up visit) within 7 days of receiving the initial dose, and after completing all required assessments they ended participation in the study. Adverse event reporting was done during the whole study period and also recorded at the follow-up visit.
Assessments
The nasal airflow conductance was calculated from measurements of nasal resistance to airflow. The measurement of the combined inspiratory nasal resistance of both nasal passages was made with a rhinomanometer (NR6, GM Instruments Ltd, Glasgow, UK) according to the study site operating procedure for measurement of nasal airflow resistance by posterior rhinomanometry.12 The technique of rhinomanometry requires the patient to breathe into a face mask, and nasal airflow and pressure are displayed on a computer screen. The computer calculates a measure of nasal resistance as mean total inspiratory nasal resistance (Pa/cm3 second). This technique of rhinomanometry is well established and has been widely used over the years.6,12,15,16 Patients were asked to gently blow their nose prior to any measurement. When four breaths had been completed the computer automatically stopped recording and patients removed the face mask. After two recordings, the coefficient of variation (CV) of the batch mean inspiratory nasal resistance (Pa/cm3 second) was produced. If the CV was >10%, another two measurements were taken. This was repeated until two measurements with a CV ≤10% were achieved. This procedure helps to control errors in measurement such as air leaks around the face mask.12
In addition to rhinomanometry, subjective intensity of nasal congestion was measured, using a 4-point categorical scale (0 = no congestion, 1 = mild congestion, 2 = moderate congestion, 3 = severe congestion). Pain intensity was determined as the combination of sore throat pain and/or headache, also using a 4-point categorical scale (0 = no pain, 1 = mild pain, 2 = moderate pain, 3 = severe pain). Subjective congestion relief and pain relief were both measured by using a 5-point categorical scale (0 = no relief, 1 = a little relief, 2 = some relief, 3 = a lot of relief, 4 = complete relief). Assessment of nasal congestion relief and pain relief was measured using a 5-point categorical scale (0 = poor, 1 = fair, 2 = good, 3 = very good, 4 = excellent). The assessments were made every hour over 4 hours in the clinic and every evening at home for days 1–3. Safety was assessed by recording adverse events reported by patients in response to non-leading questioning throughout the study, and by the study physicians.
Statistical Analyses
The primary efficacy endpoints were the reduction of nasal congestion, as measured by the area under the nasal airflow conductance curve 0–4 hours post-first dose (AUC0–4h) for the comparison ASA plus PSE versus ASA, and the relief of pain as measured by the total pain relief score 0–4 hours post-first dose (TOTPAR0–4h) for the comparision ASA plus PSE versus PSE. Secondary efficacy endpoints for nasal congestion were nasal airflow conductance from baseline to 1, 2, and 3 hours, (AUC0–1h, AUC0–2h, AUC0–3h), sum of subjective nasal congestion intensity differences (SNCID) for the time-period 0–4 hours (SNCID0–4h), and 0–3 days (SNCID0–3D), total subjective nasal congestion relief (TNCR) for the time period 0–4 hours (TNCR0–4h) and 0–3 days (TNCR0–3D), and global assessment of nasal congestion relief at the evening of day 3. Secondary endpoints pain were sum of pain intensity differences (SPID) for the time period 0–4 hours (SPID0–4h) and 0–3 days (SPID0–3D), total pain relief (TOTPAR) for the time period 0-3 days (TOTPAR0–3D), and global assessment of pain relief at the evening of day 3.
In order to protect the overall type 1 error at the 0.05 level, the hierarchical testing procedure was conducted in the following order: (1) reduction of nasal congestion and (2) relief of pain.
In order to determine the sample size, the treatment difference in TOTPAR0–4h was assumed to be 0.9 between ASA plus PSE versus PSE, with a standard deviation of 3.0. The sample size needed to achieve 90% of power for the total pain relief was 235 per group. Assuming a treatment difference NAR AUC0–4h of 100 between ASA plus PSE versus ASA with a standard deviation of 249, a sample size of 235 per group would provide at least 99% of power for nasal airflow resistance. This would result in an overall power of at least 90% for both primary endpoints. Assuming the randomization ratio of 2:2:2:1 and a dropout rate of 6%, approximately 250 patients were to be randomized into each of the ASA/PSE combination, ASA alone, and PSE alone groups and 125 patients were to be randomized into the placebo group.
Analysis of variance (ANOVA) was used to test for treatment differences, and included treatment as a fixed effect. Although other pair-wise comparisons were made in order to present the complete efficacy profile, the primary treatment comparison was made between: ASA plus PSE and ASA for reduction of nasal congestion; ASA plus PSE and PSE for relief of pain. Once a pair-wise comparison was statistically non-significant, the subsequent comparisons were to be technically ineligible to be declared significant. However, all pair-wise comparisons were presented to provide a complete clinical picture. Least squares (LS) means for each treatment and the mean differences between treatments were calculated and presented, along with the associated 95% confidence intervals (CI) and P-values.
The primary efficacy endpoint (TOTPAR0–4h) and the secondary efficacy endpoints (SNCID0–4h, SNCID0–3D, TNCR0–4h, TNCR0–3D, SPID0–4h, SPID0–3D and TOTPAR0–3D) did not satisfy the assumptions of the proposed ANOVA analysis and were analyzed using a non-parametric Mann–Whitney U-test.
Trial Registration
The trial was registered on the EU Trials register June 5, 2009 and also had a EudraCT number 2009-011355-46. The first patient was entered on trial September 15, 2009 and the last patient seen March 26, 2012.
Results
Patients
There were 833 patients randomized to the study. All of them were treated, and they comprised the safety population. Four patients withdrew consent. The intent-to-treat (ITT) population consisted of 829 patients. There were no differences in the baseline demographics and clinical features of the ITT population between treatment groups. Stuffy and runny nose, as well as sore throat, headache, and general discomfort were the major symptoms of URTI at baseline.
Efficacy
Results of the statistical analysis of primary and secondary endpoints for relief of nasal congestion and relief of pain are presented in Tables1 and 2, respectively. 1, 2, 3, and 4 hours after administration of a single dose of the fixed combination of 1,000 mg ASA plus 60 mg PSE, statistically significant superiority for nasal airflow conductance was demonstrated compared to ASA 1,000 mg (primary endpoint), and compared to placebo (all P-values < .001), but not compared to PSE 60 mg. Subjective nasal congestion relief at 4 hours showed statistically significant differences for the comparisons ASA plus PSE versus ASA and versus placebo (P < .001), but not for the comparison versus PSE. Subjective nasal congestion intensity differences at 4 hours showed statistical difference of the combination product versus placebo (P = .008), but not versus ASA and versus PSE.
Table 1.
P-Values for Endpoint Nasal Congestion Relief for ASA/PSE-Comparisons
| Outcome | Comparison | 0–1 hours | 0–2 hours | 0–3 hours | 0–4 hours | Day 3 |
|---|---|---|---|---|---|---|
| Airflow conductance area under the curve (AUC) | ASA/PSE versus ASA | <0.001 | <0.001 | <0.001 | <0.001b | n.a |
| ASA/PSE versus PSE | 0.585 | 0.592 | 0.798 | 0.933 | n.a. | |
| ASA/PSE versus Placebo | <0.001 | <0.001 | <0.001 | <0.001 | n.a. | |
| Sum of subjective nasal congestion intensity differences (SNCID)a | ASA/PSE versus ASA | n.a | n.a | n.a. | 0.144 | 0.969 |
| ASA/PSE versus PSE | n.a. | n.a. | n.a | 0.647 | 0.371 | |
| ASA/PSE versus Placebo | n.a. | n.a. | n.a. | 0.008 | 0.048 | |
| Total subjective nasal congestion relief (TCNR)a | ASA/PSE versus ASA | n.a. | n.a. | n.a. | <0.001 | 0.016 |
| ASA/PSE versus PSE | n.a | n.a | n.a | 0.890 | 0.873 | |
| ASA/PSE versus Placebo | n.a. | n.a. | n.a. | <0.001 | <0.001 | |
| Global nasal congestion relief | ASA/PSE versus ASA | n.a | n.a | n.a. | n.a. | 0.040 |
| ASA/PSE versus PSE | n.a. | n.a. | n.a. | n.a. | 0.207 | |
| ASA/PSE versus Placebo | n.a. | n.a. | n.a. | n.a. | <0.001 |
n.a., not applicable.
Mann–Whitney U-test.
Primary endpoint.
Table 2.
P-Values for Endpoint Pain Relief for ASA/PSE Comparisons
| Outcome | Comparison | 0–4 hours | Day 3 |
|---|---|---|---|
| Total pain relief (TOTPAR)a | ASA/PSE versus PSE | 0.019b | 0.348 |
| ASA/PSE versus ASA | 0.326 | 0.614 | |
| ASA/PSE versus Placebo | <0.001 | 0.220 | |
| Sum of pain intensity differences (SPID)a | ASA/PSE versus PSE | 0.085 | 0.205 |
| ASA/PSE versus ASA | 0.748 | 0.876 | |
| ASA/PSE versus Placebo | 0.421 | 0.946 | |
| Global pain relief | ASA/PSE versus PSE | n.a. | 0.043 |
| ASA/PSE versus ASA | n.a. | 0.828 | |
| ASA/PSE versus Placebo | n.a. | 0.078 |
n.a. not applicable.
Mann–Whitney U-test.
Primary endpoint.
Results of the changes in nasal airflow conductance over 4 hours, after a single dose of the four treatments are presented in Figure 1. Figure 1 demonstrates that over the first hour after treatment there was a mean increase in nasal conductance in both the ASA plus PSE and PSE alone treatment groups, whereas there was a decrease airflow conductance in the ASA and the placebo treatment groups. These changes in conductance were maintained over the 4 hours study period. Figure 2 displays the changes in nasal congestion relief over 4 hours after treatment. Separation of treatments ASA plus PSE and PSE versus treatments ASA and placebo are clearly demonstrated. Nearly identical decongestion relief curves for ASA plus PSE and PSE on the one hand, and for ASA and placebo on the other hand, are apparent. All of the treatment groups, including the placebo group, exhibited nasal congestion relief.
Fig 1.
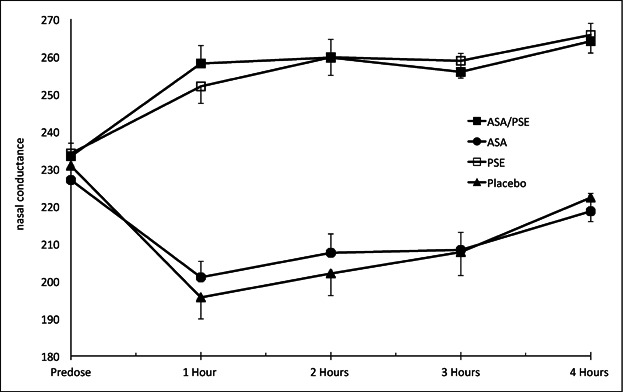
Mean (± SEM) nasal airflow conductance (cm3 second) before and up to 4 hours after dosing.
Fig 2.

Mean (± SEM) nasal congestion relief score before and up to 4 hours after dosing.
After 3 days of multiple dose treatment, subjective nasal congestion relief of the combination ASA plus PSE was significantly different versus ASA (P = .016) and versus placebo (P < .001), but not versus PSE. After 3 days of treatment subjective nasal congestion intensity differences were significant for the combination ASA plus PSE versus placebo (P = .048), but not versus ASA and versus PSE. The global assessment of nasal congestion relief determined at the end of the 3-day treatment period showed statistically significant differences of the combination product compared to ASA (P = .04) and compared to placebo (P < .001), but not compared to PSE.
Total pain relief, TOTPAR0–4h, of the combination product ASA plus PSE was statistically significant different 0–4 hours after administration of a single dose, compared to PSE (P = .019, primary endpoint) and compared to placebo (P < .001), but not compared to ASA. Comparison of the combination of ASA plus PSE with PSE, ASA and placebo with respect to sum of pain intensity differences (SPID0–4h) did not reveal any statistically significant differences. Multiple dosing after 3-days treatment did not reveal any differences for total pain relief and for sum of pain intensity differences for any comparison. The global assessment of pain relief determined at the end of the 3 days treatment period showed significant differences of the combination product compared to PSE (P = .043), but not compared to ASA and placebo. Figure 3 presents the 4 hours time curve of ASA plus PSE, ASA, PSE, and placebo for pain relief.
Fig 3.

Mean (± SEM) pain relief score before and up to 4 hours after dosing.
Safety
In this study no unexpected adverse events (AE) occurred. Overall one serious adverse event (SAE) occurred. The patient was treated with aspirin plus PSE. The SAE was a fall, and feeling faint after the fall. The subject was hospitalized and discharged the same day. No medication was given. The event fully resolved without any sequelae. The investigator considered that the fall and the faint feeling were not related to the study drug. AE were reported by 37 (15.7%) patients receiving ASA 1,000 mg plus PSE 60 mg, by 27 (11.3%) patients receiving ASA 1,000 mg, 28 (11.8%) patients receiving PSE 60 mg, and 14 (11.6%) patients receiving placebo. No patient was withdrawn from the study due to an AE. The most frequent AE were from the gastrointestinal system (ASA plus PSE: 7.7%, ASA: 7.5%, PSE: 5.1%, placebo: 4.1%) followed by nervous system disorders (ASA plus PSE: 4.3%, ASA: 0.8%, PSE: 1.7%, placebo: 5.0%). Treatment-related AE were generally less frequent. In total 6.4%, 5.4%, 3.4%, and 3.3% of AE occurred after treatment with ASA plus PSE, ASA, PSE, and placebo, respectively. The gastrointestinal system was involved in 4.7% of AE for ASA plus PSE, 3.8% of AE for ASA, 2.1% of AE for PSE, and 1.7% of AE for placebo.
Discussion
The results of this study demonstrate that a combination of ASA plus PSE can provide simultaneous relief of the symptom of nasal congestion and pain related symptoms of common cold such as headache and sore throat. The objective relief of the symptom of nasal congestion by the combination medicine is clearly apparent in Figure 1 that illustrates the objective changes in nasal conductance to airflow. The subjective relief of nasal congestion of the combination medicine is clearly shown in Figure 2. The relief of the pain related symptoms by the combination medicine is shown in Figure 3. It is interesting that the objective reductions in nasal conductance (increased congestion) seen with treatment with ASA alone and placebo in Figure 1, do not correlate with the subjective improvements in congestion relief (decreased congestion) for treatments with ASA alone and placebo seen in Figure 2. This lack of correlation between objective and subjective measures of congestion, exactly mirrors the findings of a study on a paracetamol and pseudoephedrine combination,15 and it may be explained by the subjective scores of congestion relief being more susceptible to a placebo effect than the objective measures of nasal conductance.
Nasal congestion and pain are among the most common and most severe symptoms of common cold.10 Single and multiple dose administration of the combination of ASA plus PSE provide a higher decongestant effect than placebo and the single active ASA, but not than the single active PSE. Otherwise the combination of ASA plus PSE provides a higher pain relieving effect than placebo and single active PSE, but also than the single active ASA.
In this study 4-point and 5-point categorical scales have been used. The 4-point scale was used to assess the intensity of nasal congestion and of pain at given time points, whereas assessment of congestion relief and of pain relief at given time points was utilized by using the 5-point scale. In this study, the results demonstrate statistically significant differences for pain and congestion relief at 4 hours for the comparisons ASA plus PSE versus PSE and versus ASA, respectively, but not for the corresponding measurements of pain and congestions intensity differences. It is possible that the 4-point scales are less discriminative than 5-point scales, and this would explain the non-significant differences observed between the fixed combination product and the single active ingredient ASA with respect to the measurement of nasal congestion intensity differences and the single active ingredient PSE with respect to the measurement of pain intensity differences. The same comparisons showed statistically significant differences when applying the measurements of pain and congestion relief using 5-point scales.
The observation that day-3 assessment for differences in nasal congestion relief for the comparison ASA plus PSE versus ASA was statistically significant, whereas day-3 assessment for differences in pain relief for the comparison ASA plus PSE versus PSE was not statistically significant, may be related to the rapid recovery of some patients from the common cold syndrome of symptoms, causing an increased variability of the mean data towards the end of the study period.
Conclusions
This study demonstrates that a combination therapy of ASA plus PSE provides safe and effective relief of both common cold pain related symptoms and nasal congestion. The fixed combination of ASA plus PSE is superior to the single active ingredients ASA alone and PSE alone and this study provides justification to use the fixed combination ASA plus PSE in the treatment of URTI with acute pain and nasal congestion.
Acknowledgments
Declaration of interest: This study was sponsored by Bayer HealthCare LLC, Morristown, NJ, USA. R.E. acted as a consultant for Bayer HealthCare LLC. M.V. is an employee of Bayer HealthCare. The authors acknowledge the participation of the staff at the Common Cold Centre, Cardiff University in managing and conducting the study (Dr. M. Jawad, Miss S. Jawad, Mr. B. Pope, and Miss H. Crowdy). R.E. and staff are employees of Cardiff University and they received no payment above normal university salary for conducting this clinical study.
References
- 1.Johnston S, Holgate S. Epidemiology of viral respiratory infections. In: Myint S, Taylor-Robinson D, editors. Viral and Other Infections of the Human Respiratory Tract. London: Chapman & Hall; 1996. pp. 1–38. [Google Scholar]
- 2.Weber O. The role of viruses in the etiology and pathogenesis of common cold. In: Eccles R, Webber O, editors. Common Cold. Basel: Birkhauser Verlag; 2009. pp. 107–147. [Google Scholar]
- 3.Eccles R. Understanding the symptoms of the common cold and influenza. Lancet Infect Dis. 2005;5(11):718–725. doi: 10.1016/S1473-3099(05)70270-X. [DOI] [PMC free article] [PubMed] [Google Scholar]
- 4.Hendley JO. The host response, not the virus, causes the symptoms of the common cold—comment. Clin Infect Dis. 1998;26(4):847–848. doi: 10.1086/513921. [DOI] [PubMed] [Google Scholar]
- 5.Davis SS, Eccles R. Nasal congestion: mechanisms, measurement and medications. Core information for the clinician. Clin Otolaryngol. 2004;29(6):659–666. doi: 10.1111/j.1365-2273.2004.00885.x. [DOI] [PubMed] [Google Scholar]
- 6.Eccles R, Jawad MS, Jawad SS, Angello JT, Druce HM. Efficacy and safety of single and multiple doses of pseudoephedrine in the treatment of nasal congestion associated with common cold. Am J Rhinol. 2005;19(1):25–31. [PubMed] [Google Scholar]
- 7.Malcolmson KG. The vasomotor activities of the nasal mucous membrane. J Laryngol Otologyl. 1959;37:73–98. doi: 10.1017/s0022215100054980. [DOI] [PubMed] [Google Scholar]
- 8.Eccles R, Loose I, Jawad M, Nyman L. Effects of acetylsalicylic acid on sore throat pain and other pain symptoms associated with acute upper respiratory tract infection. Pain Med. 2003;4(2):118–124. doi: 10.1046/j.1526-4637.2003.03019.x. [DOI] [PubMed] [Google Scholar]
- 9.Eccles R. Efficacy and safety of over-the-counter analgesics in the treatment of common cold and flu. J Clin Pharm Ther. 2006;31(4):309–319. doi: 10.1111/j.1365-2710.2006.00754.x. [DOI] [PubMed] [Google Scholar]
- 10.Jackson G, Dowling H, Spiesman I, Boand A. Transmission of the common cold to volunteers under controlled conditions. 1 The common cold as a clinical entity. Arch Intern Med. 1958;101:267–278. doi: 10.1001/archinte.1958.00260140099015. [DOI] [PubMed] [Google Scholar]
- 11.Tyrrell DA, Cohen S, Schlarb JE. Signs and symptoms in common colds. Epidemiol Infect. 1993;111:143–156. doi: 10.1017/s0950268800056764. [DOI] [PMC free article] [PubMed] [Google Scholar]
- 12.Eccles R. A guide to practical aspects of measurement of human nasal airflow by rhinomanometry. Rhinology. 49(1):2–10. doi: 10.4193/Rhino10.065. [DOI] [PubMed] [Google Scholar]
- 13.Morris S, Jawad M, Eccles R. Relationships between vital capacity, height and nasal airway resistance in asymptomatic volunteers. Rhinology. 1992;30:259–264. [PubMed] [Google Scholar]
- 14.European Medicines Agency. Guideline on clinical development of fixed combination medicinal products. London: 2009. Committee for medicinal products for human use. DocRef CPMP/EWP/240/95 Rev1. February 19. [Google Scholar]
- 15.Eccles R, Jawad M, Jawad S, Ridge D, North M, Jones E, et al. Efficacy of a paracetamol–pseudoephedrine combination for treatment of nasal congestion and pain-related symptoms in upper respiratory tract infection. Curr Med Res Opin. 2006;22(12):2411–2418. doi: 10.1185/030079906X154105. [DOI] [PubMed] [Google Scholar]
- 16.Eccles R, Eriksson M, Garreffa S, Chen SC. The nasal decongestant effect of xylometazoline in the common cold. Am J Rhinol. 2008;22(5):491–496. doi: 10.2500/ajr.2008.22.3202. [DOI] [PubMed] [Google Scholar]