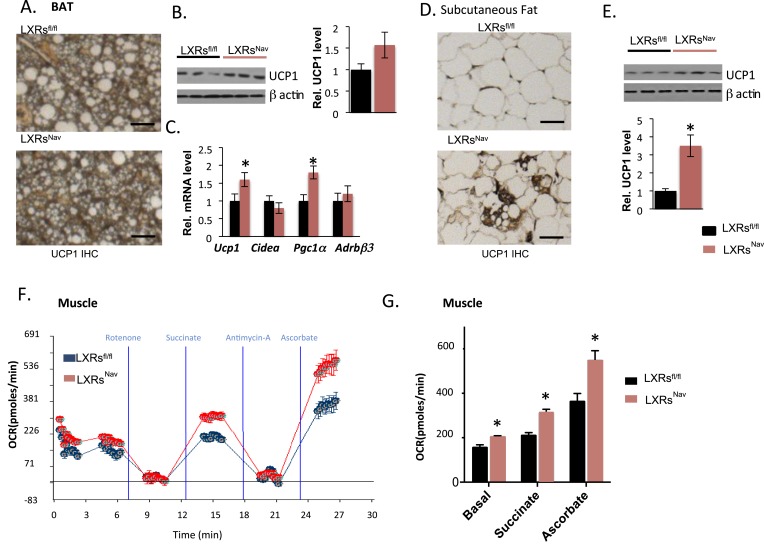
Figure 3. Adipose tissue and muscle reprogramming in LXRsNav mice vs control mice.
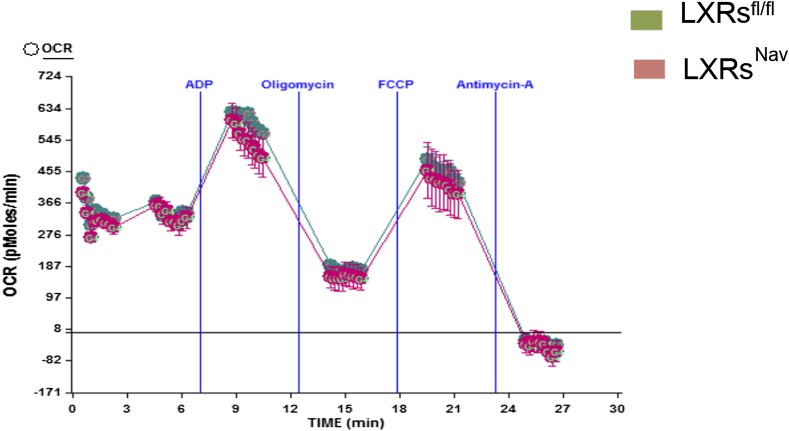
(A) Immunohistochemistry for UCP1 in BAT. (B) UCP1 Western blot on whole BAT pads (upper panel, n = 4) UCP1 molecular weight (MW) is 33 kDa, Actin served as the loading control, MW 42 kDa, the graph represents blot quantification. (C) mRNA levels in the BAT of LXR ablated mice vs control mice (lower panel, n = 4). *indicates p < 0.05. (D) UCP1 staining and (E) Western-blot analysis of UCP1 protein levels in whole, individual dorsal subcutaneous fat pads. Actin served as the loading control. The signal is quantified in the graph below (n = 4) Scale bar = 100 μm. (F,G) Oxygen-consumption rates were determined using the XF24 Extracellular Flux Analyzer following the manufacturers' protocols (n = 3). *indicates p < 0.01.


