
Figure 1. Expression of TGF-β isoforms in glioblastoma in vivo.
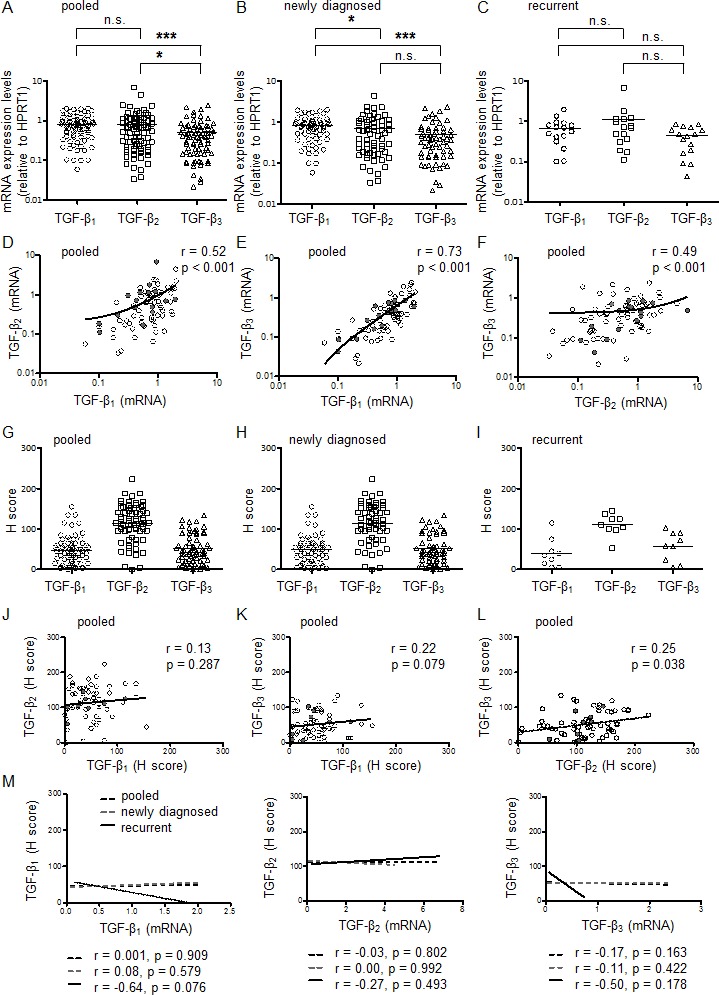
A-C, Relative mRNA expression levels for TGF-β1, TGF-β2 and TGF-β3 were assessed in all glioblastoma tissues (pooled, newly diagnosed or recurrent). The black bar marks the mean in each group. Values are represented on a logarithmic scale. Statistical significances of p < 0.05 (*) and p < 0.001 (***) were determined using the Mann-Whitney test. D-F, Correlation of TGF-β isoform mRNA expression among all samples pooled. Values are represented on a logarithmic scale. Two-tailed Spearman test coefficients (r) and significances are indicated (open circles, newly diagnosed; closed circles, recurrent). TGF-β1, TGF-β2 or TGF-β3 protein levels were assessed by immunohistochemistry and median H scores determined and presented for all patients pooled (G), newly diagnosed tumor tissues (H) and recurrent tumor tissues (I) separately. The black bar marks the mean in each group. Statistical significances of p < 0.01 (**) and p < 0.001 (***) were determined using the Mann-Whitney test. (J-L) Correlation of TGF-β protein levels among all samples pooled (open circles, newly diagnosed; closed circles, recurrent). (M) Correlation analyses of the three TGF-β protein levels with mRNA expression of the respective TGF-β isoform are shown. Two-tailed Spearman test coefficients (r) and significances are indicated.