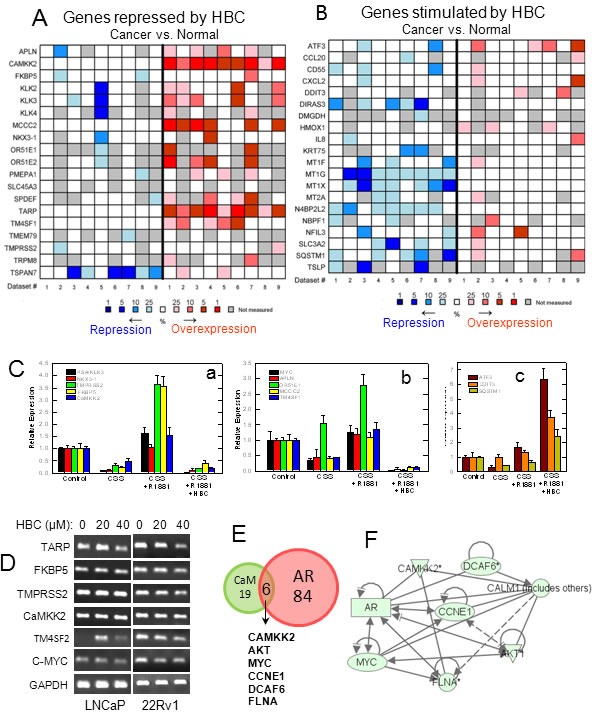
Figure 5. Analysis and validation of HBC affected androgen-regulated gene expression.

Hormone-deprived LNCaP cells were treated with 2 nM R1881 in the absence or presence of 40 μM HBC for 24 hours and androgen-regulated genes whose expression affected by HBC were identified through RNA-Seq as described in Materials and Methods. A and B) Androgen-regulated genes whose expression was significantly (p<0.002) repressed (A) or stimulated (B) by HBC were analyzed for differential expression in cancer vs. normal prostate tissues by using nine reference data sets (Supplementary Table S2) in Oncomine. The heat maps contain individual studies. The heat map intensity corresponds to percentile overexpression (red) or repression (blue) in prostate carcinoma as compared to normal prostate. C) RT-qPCR validation of representative androgen-regulated genes that were repressed (a and b) or stimulated (c) in HBC treated cells. D) HBC suppresses the expression of androgen/AR-regulated genes in 22Rv1 cells as well as in LNCaP cells. Exponentially growing LNCaP and 22Rv1 cells were treated with HBC (40 μM) for 24 hours, and RT-PCR of selected genes in total RNA was performed as described in Materials and Methods. E) Ingenuity Pathway Analysis (IPA) was used to identify AR- and/or CaM-regulated genes among the genes that were affected significantly (p<0.05) by HBC. F) IPA based identification of network interactions between the eight HBC repressed genes that are regulated both by AR and CaM.
