Abstract
We have developed a method to quickly determine tissue optical properties (absorption coefficient μa and transport scattering coefficient ) by measuring the ratio of light fluence rate to source power along a linear channel at a fixed distance (5 mm) from an isotropic point source. Diffuse light is collected by an isotropic detector whose position is determined by a computer-controlled step motor, with a positioning accuracy of better than 0.1 mm. The system automatically records and plots the light fluence rate per unit source power as a function of position. The result is fitted with a diffusion equation to determine μa and . We use an integrating sphere to calibrate each source–detector pair, thus reducing uncertainty of individual calibrations. To test the ability of this algorithm to accurately recover the optical properties of the tissue, we made measurements in tissue simulating phantoms consisting of Liposyn at concentrations of 0.23, 0.53 and 1.14% in the presence of Higgins black India ink at concentrations of 0.002, 0.012 and 0.023% (μa = 0.1–1 cm−1). For comparison, the optical properties of each phantom are determined independently using broad-beam illumination. We find that μa and can be determined by this method with a standard (maximum) deviation of 8% (15%) and 18% (32%) for μa and , respectively. The current method is effective for samples whose optical properties satisfy the requirement of the diffusion approximation. The error caused by the air cavity introduced by the catheter is small, except when μa is large (μa > 1 cm−1). We presented in vivo data measured in human prostate using this method.
1. Introduction
The in vivo determination of tissue optical properties has been an area of extensive research. The optical properties include determination of tissue absorption coefficient (μa), scattering coefficient (μs) and scattering anisotropy (g). The optical absorption and scattering properties of tissue can be used to calculate the fluence distribution of light during light-based treatments such as photodynamic therapy. In addition, the optical absorption of tissue can be used to monitor changes in the volume and oxygenation of blood and the perfusion of tissues (Liu et al 1995, Kienle et al 1996, Hull et al 1999, Rolfe 2000) and the distribution of exogenous absorbers (Doornbos et al 1999, Solonenko et al 2002). The scattering coefficient can be used to extract information about cellular structure of tissue (Mourant et al 1998, Gurjar et al 2001). In the near-infrared region (λ = 600–800 nm) where tissue scattering far exceeds tissue absorption, the diffusion approximation can be used (Star 1997). Under this approximation, only the linear term of the anisotropy in radiance is considered. A reduced scattering coefficient is, therefore, sufficient to describe all the tissue scattering properties.
Many techniques (e.g. relative fluence rate versus depth under uniform light illumination) can determine the effective attenuation coefficient, but cannot separate the effects of tissue scattering and absorption. μa and can be determined separately using ex vivo measurements of the absorbing and scattering components of the sample; however, these methods are not practical for determining the optical properties in vivo. Existing in vivo methods of determining the optical properties of tissue rely on measurement of the diffuse reflectance on tissue surface. For CW reflectance measurements (Farrell and Patterson 1992, Nichols et al 1997, Hull et al 1998, Solonenko et al 2002, Doornbos et al 1999, Swartling et al 2003), the tissue is illuminated by a pencil-beam CW light source and the diffuse reflectance is recorded at different radial distances from the source. Time-resolved measurements use subnanosecond pulses from a laser (Patterson et al 1989, Pogue and Patterson 1994, Kienle and Patterson 1997a, 1997b, Coquoz et al 2001, Torricelli et al 2001). After a pulse passes through tissue, its time dispersion can be measured. In frequency domain methods, the source is sinusoidally modulated and modulation amplitude and phase shift of the detected signal are measured to obtain information about optical properties.
The diffuse reflectance techniques outlined above, which can determine μa and simultaneously in vivo, cannot be used interstitially. Our goal is to develop an interstitial method that can be used in vivo to quickly determine both the absorption and the reduced scattering coefficients of tissue using a spatial CW method. For this, we have developed a device to quickly determine tissue optical properties by measuring the ratio of light fluence rate to the source power along a linear channel at a fixed distance (5 mm) from an isotropic point source. Diffuse light is collected by an isotropic detector whose position is determined by a computer-controlled step motor, with a positioning accuracy of better than 0.1 mm. The result is fitted with a diffusion equation, using a nonlinear optimization algorithm, to determine μa and . This method has been applied to in vivo optical property measurements in human prostate.
2. Broad beam set-up
2.1. Description of the broad beam set-up
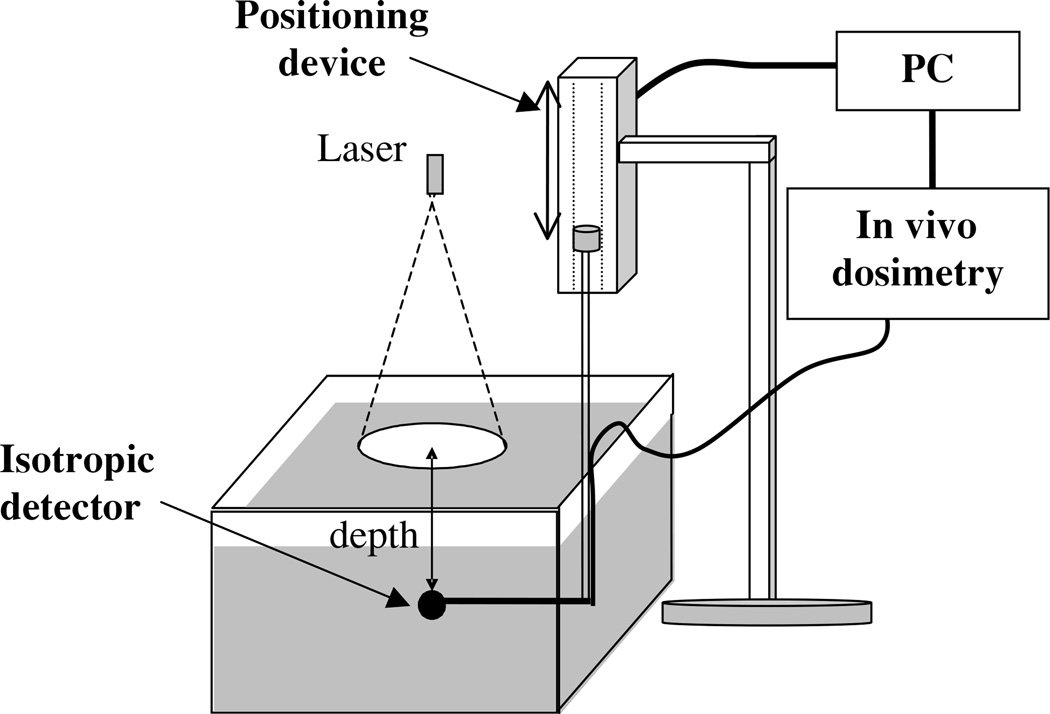
We determined the optical properties (μa and ) of each optical phantom by measuring the fluence rate as a function of depth under broad beam illumination. We used an isotropic detector manufactured by CardioFocus, Inc (West Yarmouth, MA) that consists of an optical fibre with a 1-mm-diameter spherical scattering bulb at the tip to measure the fluence rate at different depths. The light collected by this detection fibre was measured and digitized by an in vivo dosimetry system (to be described later). The detector position was controlled by a computerized positioning system (Velmex, Inc, East Bloomfield, NY). The measurement set-up is shown in figure 1. For each optical phantom (Liposyn and ink) two scans were made, under the same broad beam illumination, one in the optical phantom, the other in pure water. The ratio of the two scans was used to correct for the detector response difference between air and water. The simultaneous measurements were made for nine different conditions: three Liposyn concentrations for each of the three ink concentrations. In addition, optical properties for a Liposyn phantom without ink were measured.
Figure 1.
Experimental set-up for broad beam measurements. The optical properties of the Liposyn and ink used for the optical phantom were characterized independently using a broad parallel beam incident on the phantom. We used a 1 mm scattering tip isotropic detector to measure the fluence rate at different depths in the phantom using a step motor that has an accuracy of 0.1 mm. The measurements were made under five different conditions: one for Liposyn solution, three for Liposyn solution plus three ink concentrations with known optical properties, and one for pure water. The ratio between Liposyn (or Liposyn with ink) and water was fit to an exponential function: ϕ = k exp(−μeffd), where μeff is the effective attenuation coefficient. This ratio eliminates the effect of inverse-square law and the detector sensitivity variation between water and air for the isotropic detector.
Analysis of the depth dependence of fluence rate in phantoms illuminated from above by a broad beam requires a one-dimensional solution to the diffusion equation. In this case, the ratio between fluence rates measured in Liposyn with ink and that measured in water was fit to an exponential function:
| (1) |
where μeff is the effective attenuation coefficient. for the Liposyn and μa for water were determined from μeff and the μa of ink deduced from the known ink concentration. Since should be independent of ink concentration for a particular Liposyn concentration, we took the average of the three extrapolated values of (one for each ink concentration) as the of each Liposyn phantom. The μa for different ink concentrations was then determined from the best fit value of μeff and the mean value of using the relation . Although is an approximation of the expression , Nakai et al (1997) have shown that this expression is valid over a wider range of optical properties, especially in cases of high absorption. The values of μa determined by this method and those expected based on the known ink concentrations agreed to within 8%. The uncertainty in μeff, as determined by propagation of uncertainty based on the 1.5% uncertainty in our fluence measurements, is less than 0.1%. The true uncertainty of this measurement is, therefore, likely limited by the uncertainty in measuring the volumes of phantom components. To minimize this error, we used a pipettor which has an accuracy of 0.01 ml to accurately determine ink and Liposyn volumes of 2000 ml.
2.2. Liquid tissue-simulating phantom
The tissue simulating phantoms are made of separate scattering and absorbing components. The phantoms were placed in a plastic container that was painted in black and was large enough (18.2 × 14.6 × 7.7 cm3) to avoid scattering from the boundary. This type of phantom has been described in the literature (Madsen et al 1992). The scattering media used are phospholipid emulsions (Liposyn III, 30% Abbott Lab, North Chicago, IL). The scattering coefficient and concentration of Liposyn are related by the expression,
| (2) |
where (c%IL) is the lipid concentration used. This formula was obtained for the specific batch of Liposyn used in the experiments reported here using the broad beam measurement described above.
We used Higgins black India ink #4418 (Higgins, Bellwood, IL) as the absorbing medium. The absorption coefficient dependence on ink concentration is given by:
| (3) |
where (c%ink) is the ink concentration in per cent volume. This formula was obtained from transmission measurement of pure ink diluted in water.
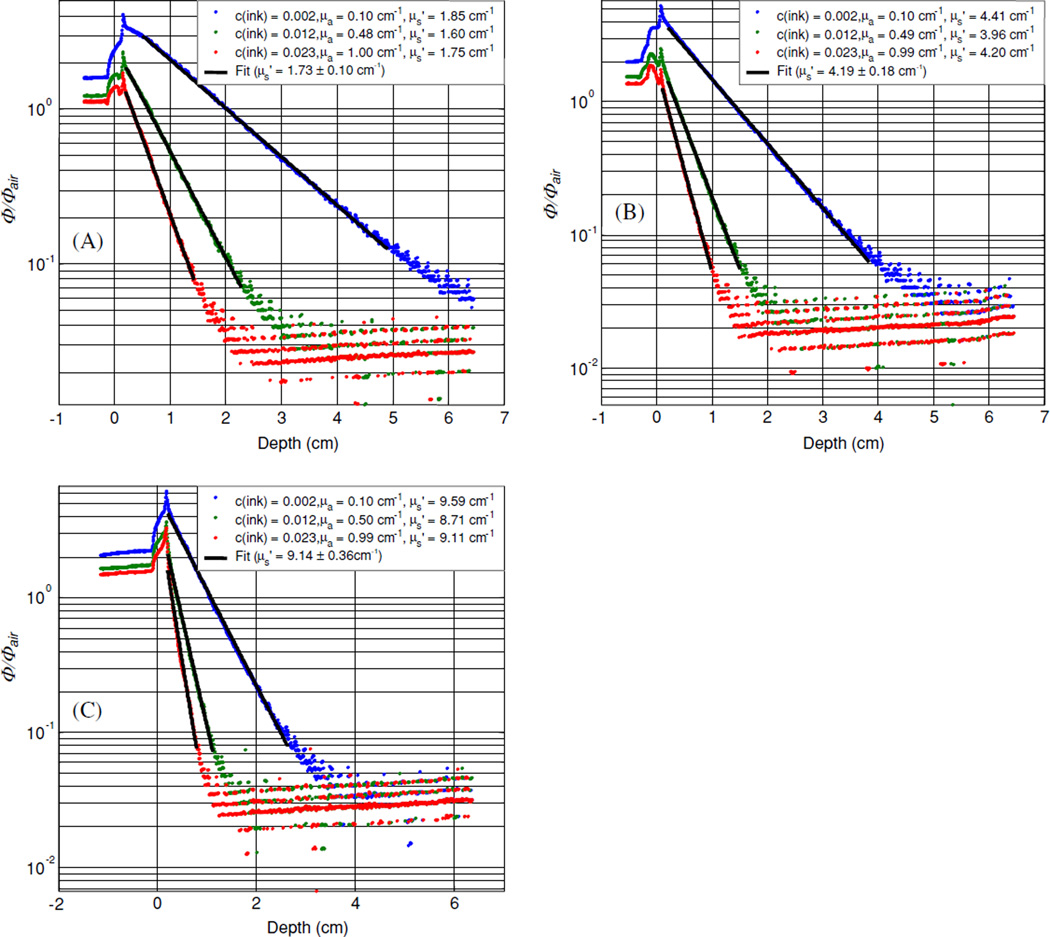
Figure 2 shows the results of all experiments using the broad beam method for nine tissue simulating phantoms with Liposyn concentrations of: (A) 0.23%, (B) 0.53% and (C) 1.14% and ink concentrations of: 0.002%, 0.012% and 0.023%. The best fit scattering coefficients were: 1.73 cm−1 (with absorption coefficients of 0.10, 0.48 and 1.00 cm−1); 4.19 cm−1 (with absorption coefficients of 0.10, 0.49 and 0.99 cm−1) and 9.14 cm−1 (with absorption coefficients of 0.10, 0.50 and 0.99 cm−1).
Figure 2.
Optical properties characterization using broad beam method. Results are shown for three tissue simulating phantoms with Liposyn concentrations of: (A) 0.23%, (B) 0.53% and (C) 1.14%. For each Liposyn concentration phantom, we added three different concentrations of black ink: 0.002%, 0.012% and 0.023%. Symbols represent measurements with an isotropic detector. Solid lines are the best fit. The resulting optical properties were: (A) and μa = 0.10, 0.49 and 1.01 cm−1, (B) and μa = 0.10, 0.50 and 0.99 cm−1, (C) and μa = 0.10, 0.50 and 1.00 cm−1. See text for details.
The optical properties of liquid tissue-simulating phantoms composed of Intralipid and ink have been extensively studied for different wavelengths by several investigators. A summary of the measured scattering and absorption coefficients measured by other people (Moes et al 1989, Driver et al 1989, Flock et al 1992, van Staveren et al 1997, Mourant et al 1997, Madsen et al 1992) and the results of this study are given in table 1.
Table 1.
A summary of μa and as a function of percentage concentration for scattering and absorbing materials used in the liquid optical phantom. c% is the percentage concentration of the scattering (or absorption) material in volume dissolved in water (in volume).
| Brand | Wavelength (nm) | μa (cm−1) | Source | ||
|---|---|---|---|---|---|
| 10% Intralipid | 633 | – | Moes et al (1989) | ||
| Nutralipid | 630 | 0.0026 | Driver et al (1989) | ||
| 10% Intralipid | 400–1100 | – | van Staveren et al (1997) | ||
| 10% Intralipid | 460–890 | 0.001–0.015 | Flock et al (1992) | ||
| 10% Intralipid | 700 | – | Mourant et al (1997) | ||
| 30% Liposyn | 730 | 0.020 | This study | ||
| Higgins Ink | 594 | – | μa = 123 × c% | Madsen et al (1992) | |
| Higgins Ink | 730 | – | μa = 42.99 × c% | This study |
3. Interstitial set-up
3.1. Description of the interstitial set-up for phantom measurement
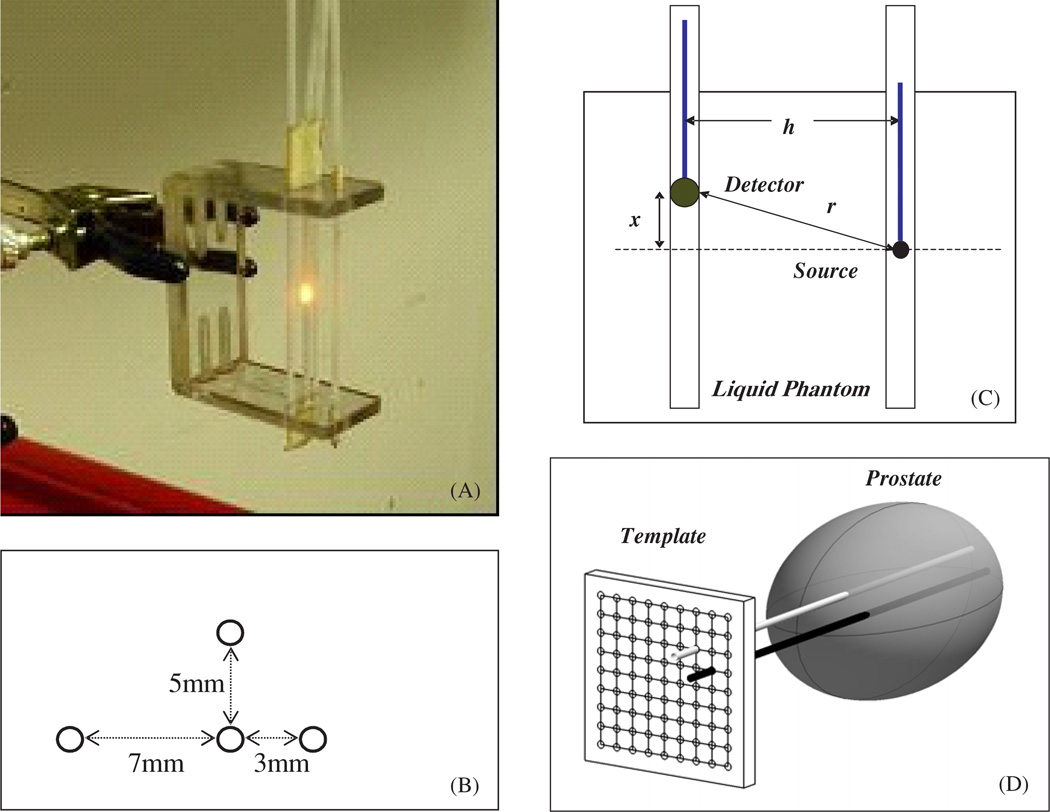
The experimental set-up for the parallel-catheter measurement system is shown in figure 3. We constructed a device consisting of 3 parallel catheters positioned at 3 distances (3, 5 and 7 mm) from a central catheter. Only one separation is required to determine μa and , but we examined the accuracy of the extrapolation for the three separations independently to find the most suitable separation. An isotropic point source was placed in the middle catheter and connected to a 730 nm diode laser (Diomed 730, Cambridge, UK). An isotropic detector was placed in one of the parallel detector channels. This detection fibre was connected to a light dosimetry system (described below). The detector’s position was controlled by computer-controlled step motors (Velmex, Inc East Bloomfield, NY), allowing the detector to be moved to different distances from the light source. Each data set was obtained by scanning the detector along its catheter while the source remained fixed and acquiring fluence rate measurements at 0.05 mm intervals along its movement. The data acquisition time for a scan of 10 cm distance with 2000 data points is about 8 s since the speed of the step motor is 12.5 mm s−1. The data acquisition board has a maximum data transfer speed of 300 kilosample/s, which can be adjusted to match the data acquisition rate of 250 samples/s in the application.
Figure 3.
(A) Picture of the optical property device consisting of 4 parallel catheters positioned at 3 different distances (3, 5 and 7 mm) from the central catheter. The light source is placed in the centre catheter, while the detector is moved along each catheter, positioned at different distances from the light source. (B) Top view of the optical property device pictured in (A). (C) Schematics of the light source and detector placement. The distance between the light source and the detector is h. The light source is placed at a distance x from the surface of the phantom, while the detector is moved along the catheter. The distance from the centre of the detector to the point source is given by . (D) Diagram of cathteter positioning during prostate PDT. The cathteters are placed at fixed distatnces (h) through a template and into the prostate. The light source is placed in one of the cathteters and the isotropic detector is placed in the other catheter.
Using the diffusion approximation, the light fluence rate ϕ per source power S at a distance r from a point source can be expressed (Jacques 1998):
| (4) |
where S is the source power of the point source (in mW), ϕ (r) is the fluence rate in mW cm−2 at r. , where x and h are parallel and perpendicular distances from the centre of the point source (figure 3(C)).
3.2. Description of the interstitial set-up for in vivo patient measurement
Optical properties (μa, and δ = 1/μeff) were also measured in 11 patients with locally recurrent prostate carcinoma using the interstitial set-up. A template with evenly spaced holes 5 mm apart was used for positioning of the catheters inside the prostate gland under ultrasound guidance. One point source and one detector were introduced in two parallel catheters (figure 3(D)). Detectors were placed at 5 or 7 mm (h) away from the light sources. The uncertainty of distance between the light source catheter and the detector catheter (h), which can be off 1–2 mm from the position determined by the template, can introduce errors in determining the optical properties of the phantom. Because of this, the optimization algorithm is designed to include the separation h, as a separate fitting parameter. Optical properties of the prostate were determined applying the diffusion theory (equation (4)) to the fluence rates measured at several distances (5–50 mm) from the light source. The isotropic detectors were calibrated under collimated 732 nm laser light in air as described in section 3.3.
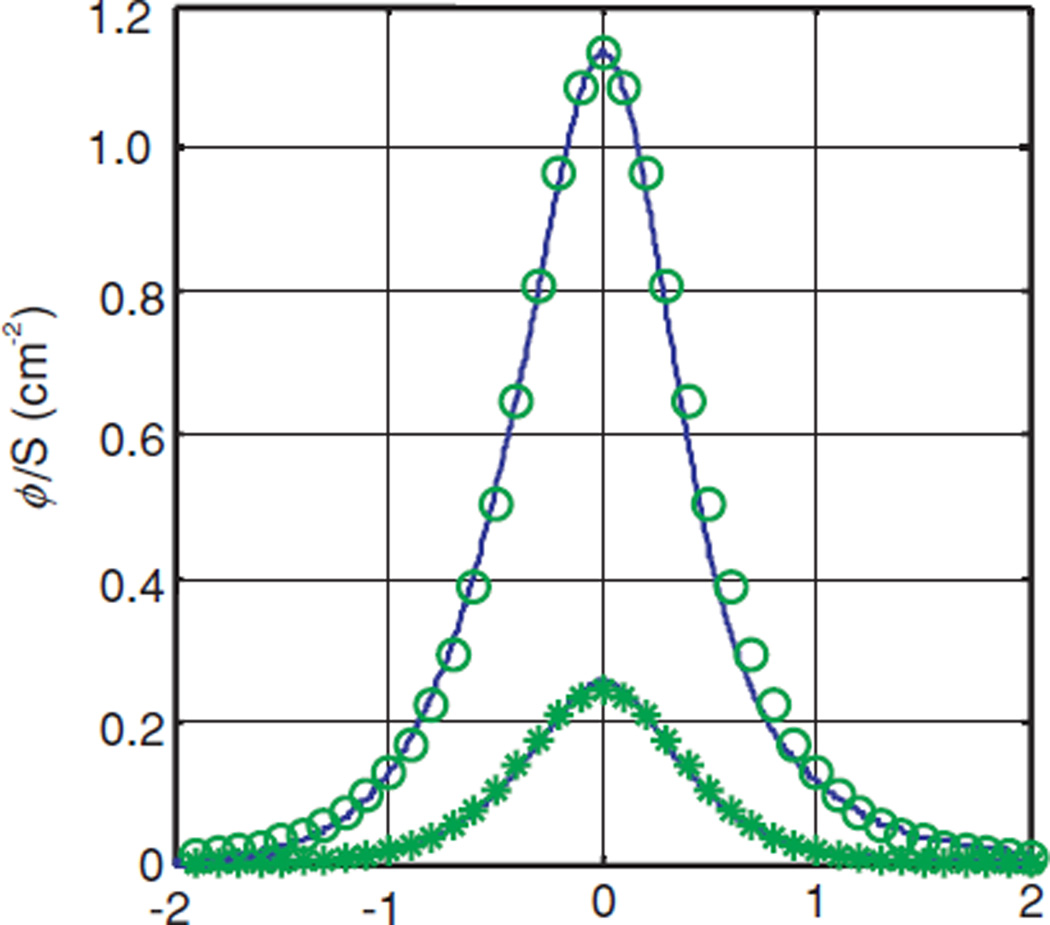
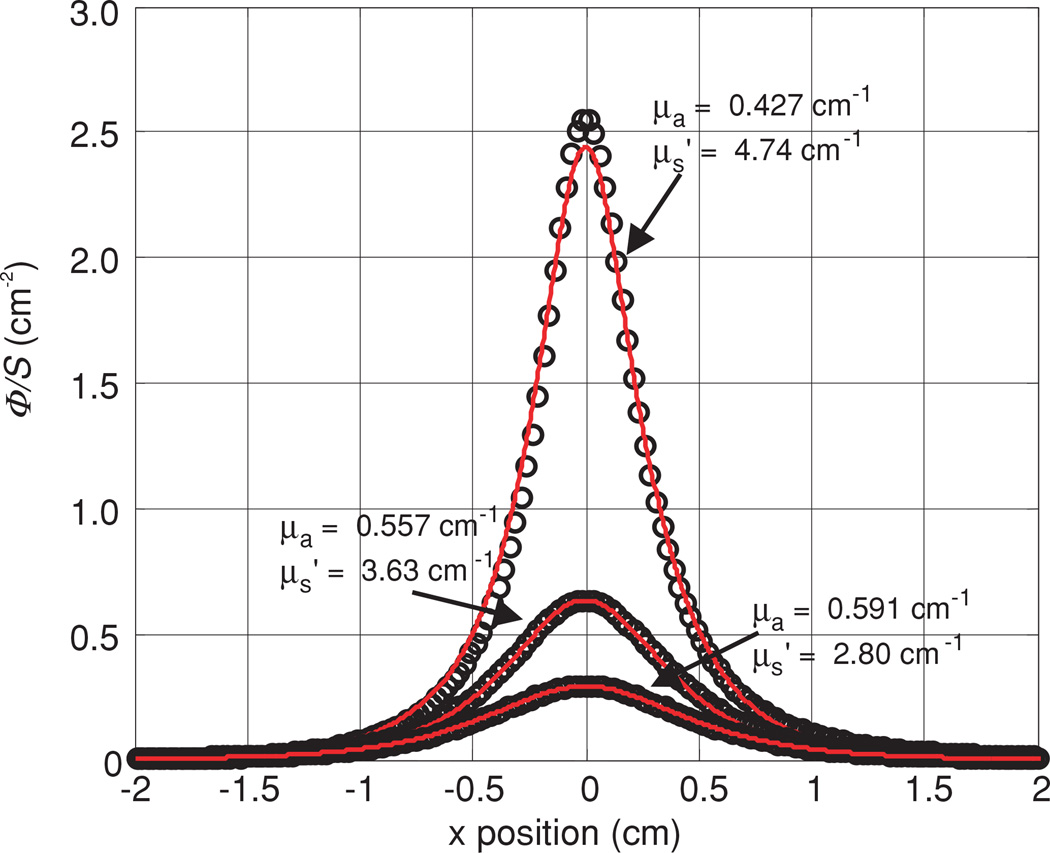
Figure 4 shows the variation of the measured light fluence rate distribution (solid lines) in different quadrants of the prostate and symbols are the fits. There are 800 measured points for each scan with a resolution of 0.05 mm in the range of (−2, 2) cm. The measured optical properties in this particular case varied from 0.23 to 0.4 cm−1 for the absorption coefficient and from 6.6 to 12 cm−1 for the scattering coefficient for different locations in prostate.
Figure 4.
Measured light fluence rate per unit source strength at distances along the catheter, x, from the point source measured in vivo in human prostate gland. Lines are measured data and symbols are the fits.
Table 2 summarizes the measured optical properties in human prostate for 11 patients (Zhu et al 2005a). Five patients were measured using a few points with manual positioning and six were measured using a motorized probe (* indicates motorized probe measurements). The first column lists the absorption coefficients, the second column lists the scattering coefficients and the last column lists the optical penetration depth, for each patient. The values in the parenthesis are the standard deviations of the mean values measured from different locations in the same prostate gland. Whenever no standard deviation is listed, only one data point was available.
Table 2.
Summary of optical properties measured in human prostate. The values in parentheses are the standard deviation of the mean values measured from different locations in the same prostate. No standard deviation is listed if only one data point is available. (* represents the measurements done with the motorized probe.)
| Patient number | μa (cm−1) | δ (cm) | ||
|---|---|---|---|---|
| 1 | 0.09 | 29.8 | 0.34 | |
| 2 | 0.15 | 22.0 | 0.31 | |
| 3 | 0.43 (0.28) | 7.69 (4.76) | 0.41 (0.14) | |
| 4 | 0.21 | 11.8 | 0.37 | |
| 5 | 0.27 (0.27) | 10.5 (11.2) | 0.50 (0.05) | |
| 6 * | 0.53 (0.36) | 6.61 (4.51) | 0.41 (0.09) | |
| 7 * | 0.63 (0.32) | 4.62 (2.87) | 0.42 (0.10) | |
| 8 * | 0.67 (0.17) | 6.39 (3.18) | 0.32 (0.10) | |
| 9 * | 0.71 (0.43) | 8.99 (6.51) | 0.32 (0.12) | |
| 10 * | 0.27 (0.14) | 18.5 (11.6) | 0.30 (0.07) | |
| 11 * | 0.72 (0.11) | 3.37 (1.37) | 0.39 (0.11) |
3.3. Calibration of detectors
We used an isotropic detector made of an optical fibre with a 0.5-mm-diameter scattering tip (CardioFocus West Yarmouth, MA) to measure the fluence rate. The fibre is connected to one port of a light dosimetry system, which consists of an array of independent photodiodes, each connected to an SMA-style fibre optic connector. The photovoltage generated by these diodes is amplified and recorded by an analog-to-digital (AD) data acquisition board (DataTranslation, Marlboro, MA). The isotropic detector was calibrated in a 15.2 cm diameter integrating sphere using 730 nm light. The measured photovoltage (V) from the isotropic detector was converted to light fluence rate using the expression,
| (5) |
where A (mW cm−2 V−1) is the conversion factor for fluence rate and B (V) characterizes the leakage of the photodiode. Since the calibration is performed in air, when the isotropic detector is used in tissue a correction factor of α = 1.9 was used. This value was measured using the response of the isotropic detector in and out of water medium for the same incident fluence rate (Vulcan et al 2000, Marijnissen and Star 2002, Zhu et al 2005a, 2005b).
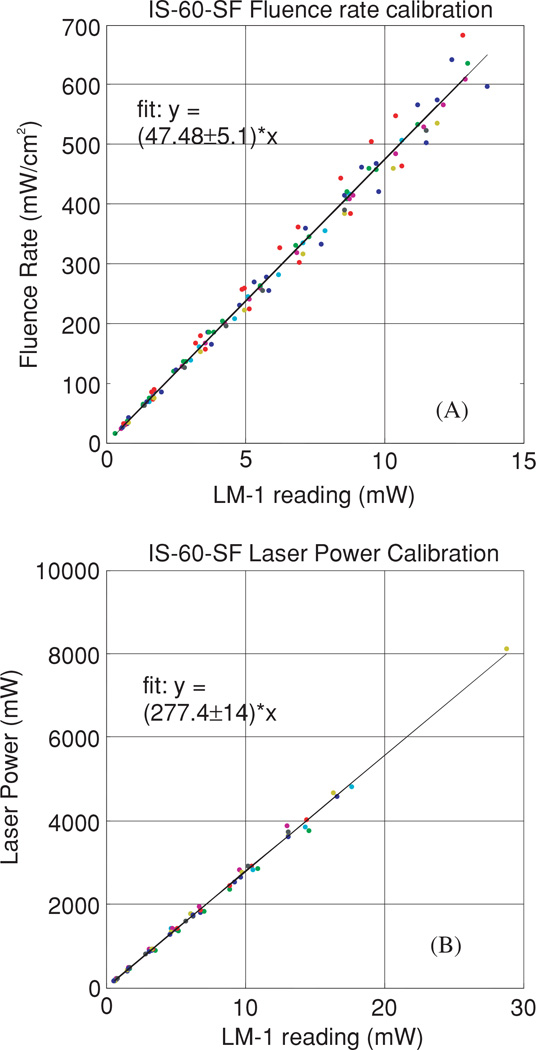
It is possible to determine the light fluence rate per unit power, ϕ/S, without independent calibrations of the isotropic detector (for ϕ) and the light source power (S). An integrating sphere with a built-in detector port and two input ports (one for the light source and the other for the isotropic detector) was used. A custom-made baffle blocked the direct light from the light source to either the built-in detector or the isotropic detector. The integrating sphere was calibrated for the light fluence rate and the light source power (figure 5) as follows. The fluence rate in air ϕ0 is plotted against the power reading I recorded by the built-in power meter and then fitted to obtain the constant a (figure 5(A)), such that ϕ0 = aI. The calibration constant b is then obtained from the fit of the power reading from the integrating sphere as a function of the actual power (figure 5(B)) such that S = bI. The fluence rate and the uncalibrated detector signal (F) are related by ϕ0 = gF0 in air and ϕ = αgF in tissue, where α is the tissue correction factor and g is a constant that converts the light fluence rate from the detector signal (with leakage correction). One can determine the ratio ϕ/S from a simultaneous measurement of the point source with the power S and the same isotropic detector in the integrating sphere using:
| (6) |
where F0 is the isotropic detector reading in the integrating sphere in air for the same point source with power S, β is the ratio of the integrating sphere calibration coefficients a/b, α is the tissue calibration factor and F is the detector signal in the phantom measurement. α = 1.9 for our isotropic detectors, calibrated in air and used in water. β = 0.172 cm−2 for our integrating sphere (see figure 5).
Figure 5.
(A) Fluence rate calibration. The constant a is determined from the fit of the fluence rate in air to that of the power meter reading. (B) The power calibration determines the constant b, from the fit of the power reading from the integrating sphere to that of the power meter.
3.4. Fitting algorithm
A Matlab-based program1 using a graphical user interface (GUI) was developed to analyse the measured data. First, the data are read into the program from the selected files. Each profile is adjusted to account for the difference in sensitivity between in-air and in-water measurements and divided by the source power according to equation (6). The program displays the measured profile and its reflection in the y-axis on a common plot along with the difference between the two. The user has the option of applying an offset to the positions recorded by the motorized positioner to place the peak of the profile at x = 0. When this is achieved, the profile and its reflection match, and the difference between them is minimized.
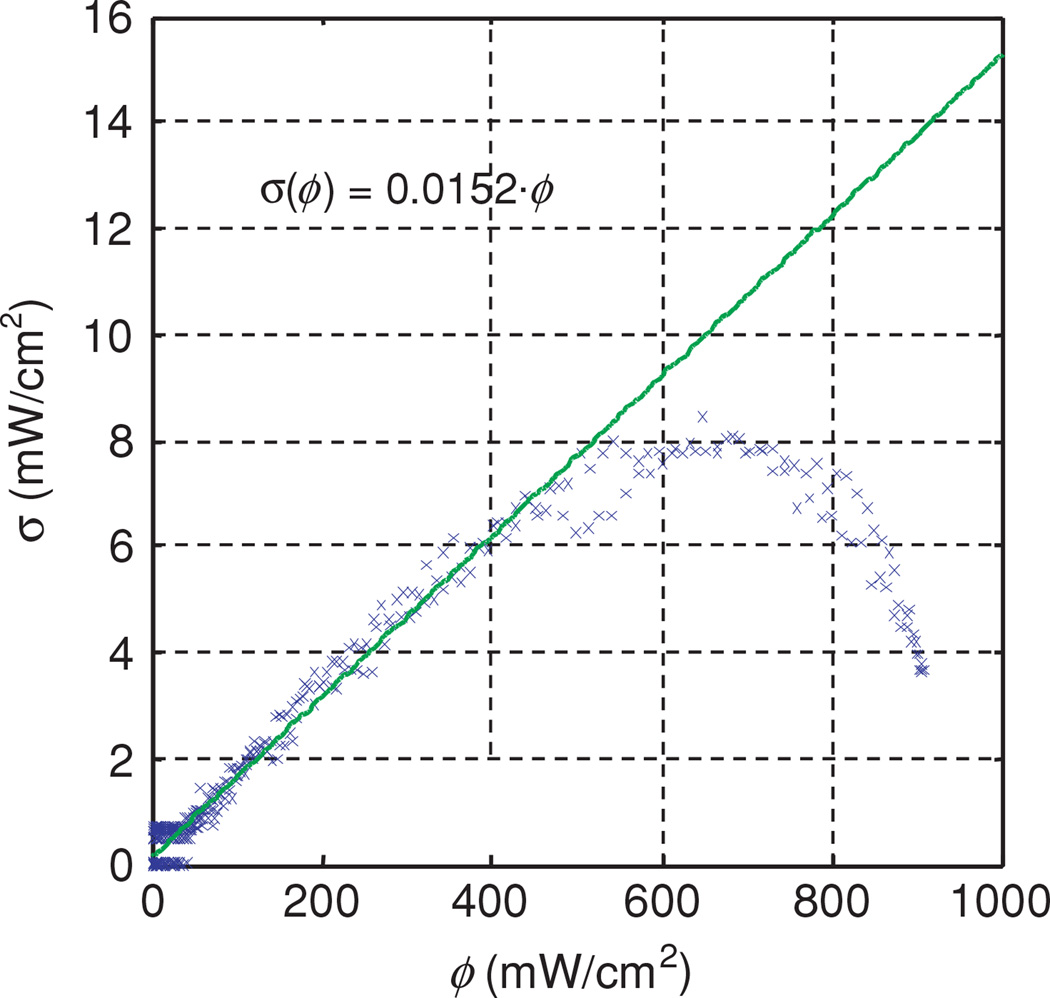
Each profile is fit using two independent optimization algorithms. Both algorithms attempt to minimize the reduced χ2, defined as
| (7) |
where the subscripts m and t denote the measured and theoretical values, respectively. The sum is over the N measured data points. The difference between N and Np, the number of fitting parameters, gives the number of degrees of freedom of the fit. The uncertainty σ at each data point is estimated based on the measured relationship between noise and signal in our photodiode detectors, which is approximately linear with a coefficient of 0.015 (figure 7). To determine the relationship between the uncertainty in the signal recorded by our dosimetry system and the signal itself, we have performed eight in-air measurements of the same point source and same parallel catheters with h = 5 mm. Figure 7 is a plot of the standard deviation in fluence rate as a function of fluence rate. The symbols indicate the measured standard deviation, and the solid line is a linear fit. The measured data for ϕ > 600 mW cm−2 was excluded from the fit. To account for the round-off error associated with conversion from analog to digital signal, we add additional uncertainty to each point equal to the value of the least significant bit of the 12 bit digital signal. In practice, this additional uncertainty is significant only for weak signals.
Figure 7.
Standard deviation of fluence rate as a function of fluence rate. The symbols were measured data obtained from eight measurements of the same point source. The solid line is a linear fit. The measured data for ϕ > 600 mW cm−2 were excluded from the fit.
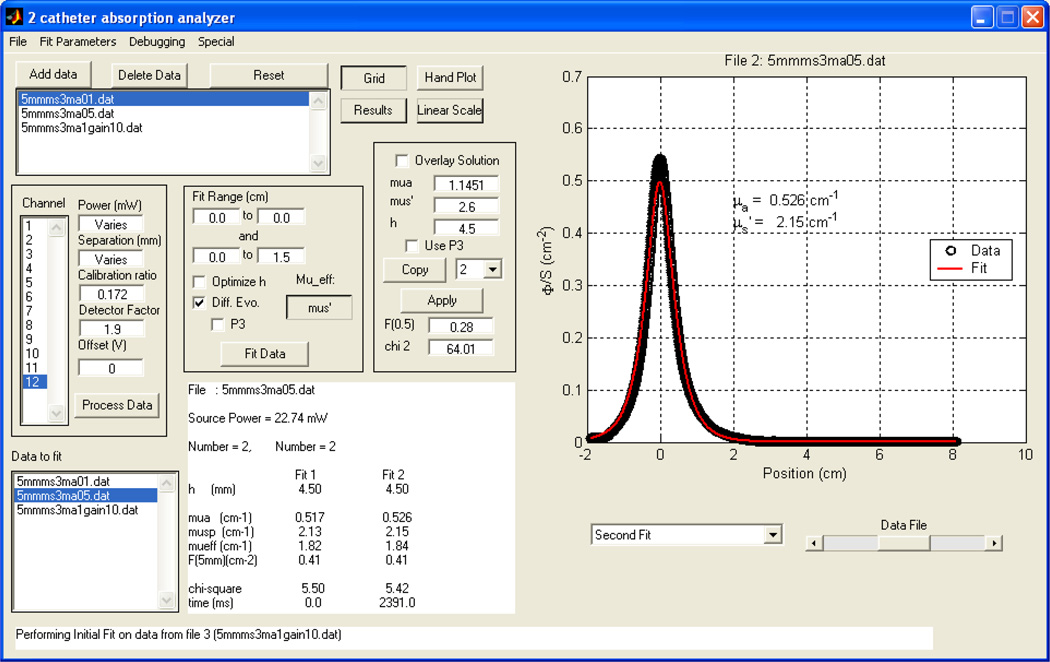
The GUI of the fitting program for the determination of optical properties is shown in figure 6. The add/delete data button enables one to choose/delete the data one needs to plot/remove. The user can enter the power, the distance between the two catheters h, calibration ratio β, the detector tissue correction factor α, as well as the fitting range for x. One has the choice of (1) using a fixed h or (2) using the ‘optimize h ’ to allow the program to find the optimal value of h. In the text, we denoted h as being the physical separation between the catheters and italic h as being the optimized separation. The overlay solution box lets one overlay a plot of the diffusion theory solution for a given set of absorption and scattering coefficients and separation h. Results are summarized in the middle lower portion showing the current file name, source power (in mW), distance h between the catheters, values of absorption, scattering, effective attenuation coefficients, error and time for fitting (in ms).
Figure 6.
The GUI of the fitting program for the determination of optical properties. The user can enter the power, the distance h calibration ratio, and the detector water correction factor, as well as the fitting range for x. One has the choice of (1) using a fixed h or (2) using the ‘optimize h’ for the program to find the optimal value of h. The overlay solution box lets one overlay a fit for a set absorption and scattering coefficient, using a constant h. Results summarized in the middle lower portion showing the current file name, source power (in mW), distance h between the catheters, values of absorption, scattering, effective coefficients, error and time for fitting (in ms). The program is available for download. (see text for details).
In the first fitting, equation (4) is linearized by multiplying by r and taking the natural log. A corresponding transformation is performed on the measured data, which is then subjected to a linear fit to determine μeff and , from which μa can be determined. To explicitly take into account uncertainty in the measured data, we have adopted the singular value decomposition algorithm of Press et al (1992). Because the linear fitting uses ln(Φr) as its independent variable, we must calculate the uncertainty in ln(Φr), given by:
| (8) |
The second fit uses the differential evolution routine adapted by Zhu et al (2001) from the work of Storn and Price (1997) with μa and as free parameters. This nonlinear algorithm minimizes χ2 directly.
The results of both fits are displayed as they are calculated, allowing the user to identify regions of the profile that contribute to poor fitting and exclude them from the fit. After the fitting is complete, the diffusion theory expression is evaluated with r equal to 0.5 cm to determine the fluence rate per unit power, and the value of χ2 of each fit is calculated.
The measurement system described here is intended for use in the measurement of intact human tissues, in which case it is rarely possible to verify the distance between individual catheters. To account to variations in catheter distance, we have implemented a variable distance version of each of the algorithms described above. In the case of linear fitting, the fitting described above is repeated inside a nonlinear fitting algorithm native to the Matlab environment, which uses h, the distance between catheters, as part of free parameters (μa, , h). The determination of optical properties is still performed by the linear algorithm. The differential evolution algorithm is modified only slightly, by allowing one additional free parameter (h). In this case, the algorithm optimizes all three parameters simultaneously.
3.5. Results
Table 3 summarizes the optical properties (μa, , μeff) obtained using the parallel catheter measurements and those obtained from broad-beam measurements in the same phantoms. Results are presented for three optical phantoms with Liposyn concentration of (A) 0.23%, (B) 0.53%, (C) 1.14% and ink concentrations of 0.002%, 0.012%, and 0.023% for three different physical separations (h) between the two catheters. The first column specifies the distance between the light source catheter and the detector catheter. The second column shows the optimized distance (h) between the catheters that gives the best agreement between the optical properties determined by parallel-catheter and broad-beam measurements. The values of the absorption, scattering and effective attenuation coefficients determined by parallel catheter measurement are shown in columns 3–5. These values are then compared to the values measured independently in a broad-beam geometry. The per cent differences between the two are listed in the last three rows.
Table 3.
A comparison between optical properties (μa, , μeff) determined by broad-beam and parallel-catheter methods for three optical phantoms with Liposyn concentrations: (A) 0.23%, (B) 0.53%, (C) 1.14% and ink concentrations (0.002%, 0.012% and 0.023%) for three different separations (h) between the catheters.
| Parallel catheters | Broad beam | Difference (%) | |||||||||||
|---|---|---|---|---|---|---|---|---|---|---|---|---|---|
| Separation | h | μa |
|
μeff | μa |
|
μeff | μa | μeff | ||||
| (A) | |||||||||||||
| h = 3 mm | 2.5 | 0.10 | 2.04 | 0.77 | 0.10 | 1.73 | 0.72 | 2.0 | 14.0 | 6.9 | |||
| 0.47 | 2.11 | 1.72 | 0.48 | 1.73 | 1.58 | 5.1 | 17.9 | 7.5 | |||||
| 0.93 | 2.49 | 2.64 | 1.00 | 1.73 | 2.28 | 8.6 | 39.1 | 15.8 | |||||
| h = 5 mm | 4.5 | 0.11 | 2.04 | 0.82 | 0.10 | 1.73 | 0.72 | 8.0 | 17.9 | 13.9 | |||
| 0.53 | 2.21 | 1.87 | 0.48 | 1.73 | 1.58 | 9.4 | 27.7 | 18.4 | |||||
| 1.10 | 2.29 | 2.75 | 1.00 | 1.73 | 2.28 | 9.9 | 32.4 | 20.6 | |||||
| h = 7 mm | 6 | 0.11 | 1.93 | 0.79 | 0.10 | 1.73 | 0.72 | 9.0 | 7.8 | 9.7 | |||
| 0.55 | 1.91 | 1.78 | 0.48 | 1.73 | 1.58 | 12.7 | 6.7 | 11.3 | |||||
| 1.18 | 1.49 | 2.29 | 1.00 | 1.73 | 2.28 | 15.2 | 16.8 | 0.4 | |||||
| (B) | |||||||||||||
| h = 3 mm | 2.5 | 0.10 | 4.35 | 1.15 | 0.10 | 4.19 | 1.11 | 1.0 | 3.8 | 3.6 | |||
| 0.43 | 4.74 | 2.47 | 0.49 | 4.19 | 2.49 | 12.9 | 13.1 | 0.8 | |||||
| 0.89 | 4.30 | 3.38 | 0.99 | 4.19 | 3.53 | 10.3 | 2.6 | 4.2 | |||||
| h = 5 mm | 4.5 | 0.09 | 3.92 | 1.05 | 0.10 | 4.19 | 1.11 | 7.0 | 6.4 | 5.4 | |||
| 0.56 | 3.63 | 2.46 | 0.49 | 4.19 | 2.49 | 13.5 | 13.4 | 1.2 | |||||
| 1.14 | 3.53 | 3.47 | 0.99 | 4.19 | 3.53 | 15.1 | 15.8 | 1.7 | |||||
| h = 7 mm | 6 | 0.08 | 3.35 | 0.92 | 0.10 | 4.19 | 1.11 | 16.0 | 20.0 | 17.1 | |||
| 0.59 | 2.80 | 2.23 | 0.49 | 4.19 | 2.49 | 20.6 | 33.2 | 10.4 | |||||
| 1.35 | 2.57 | 3.23 | 0.99 | 4.19 | 3.53 | 36.5 | 38.7 | 8.5 | |||||
| (C) | |||||||||||||
| h = 3 mm | 2.5 | 0.09 | 6.97 | 1.35 | 0.1 | 9.14 | 1.64 | 13.0 | 23.7 | 17.7 | |||
| 0.46 | 5.05 | 2.63 | 0.5 | 9.14 | 3.7 | 8.8 | 44.7 | 28.9 | |||||
| 0.81 | 5.03 | 3.49 | 0.99 | 9.14 | 5.2 | 18.4 | 45.0 | 32.9 | |||||
| h = 5 mm | 4.5 | 0.1 | 8.76 | 1.62 | 0.1 | 9.14 | 1.64 | 0 | 4.2 | 1.2 | |||
| 0.51 | 7.40 | 3.38 | 0.5 | 9.14 | 3.7 | 2.0 | 19.0 | 8.6 | |||||
| 0.92 | 8.02 | 4.70 | 0.99 | 9.14 | 5.2 | 7.3 | 12.3 | 9.6 | |||||
| h = 7 mm | 6 | 0.10 | 5.92 | 1.32 | 0.1 | 9.14 | 1.64 | 2.0 | 35.2 | 19.5 | |||
| 0.78 | 3.97 | 3.04 | 0.5 | 9.14 | 3.7 | 55.6 | 56.6 | 17.8 | |||||
| 1.85 | 3.27 | 4.26 | 0.99 | 9.14 | 5.2 | 86.9 | 64.2 | 18.1 | |||||
Figure 8 shows the results for the measurements done in an optical phantom ( and μa = 0.5 cm−1) but at different distances from the light source. From top to bottom, h = 3, 5, and 7 mm, respectively.
Figure 8.
Fluence rate per unit power measured in one phantom (0.53% Liposyn and 0.012% black ink) at source–detector distances of 3, 5 and 7 mm. Fitting parameters are listed in table 3 (B).
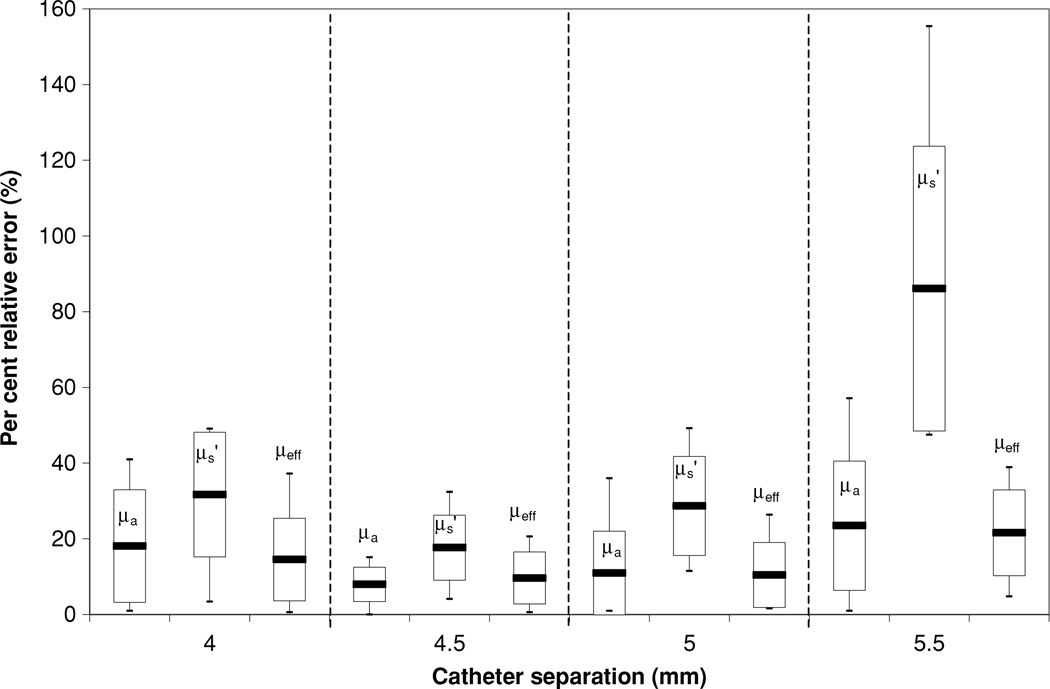
Figure 9 plots the error in the optical properties determined by parallel-catheter measurements for all optical phantoms used in the study for physical separation of 5 mm. The Liposyn concentrations are 0.23%, 0.53% and 1.14%, and ink concentrations are 0.002%, 0.012% and 0.023%. We listed fittings using h of: 4, 4.5, 5 and 5.5 mm.
Figure 9.
Error in the optical properties determined by parallel-catheter measurements for all optical phantoms used in the study for physical separation of 5 mm. The Liposyn concentrations are 0.23%, 0.53% and 1.14%. Catheter separations h of 4 mm, 4.5 mm, 5 mm and 5.5 mm were plotted.
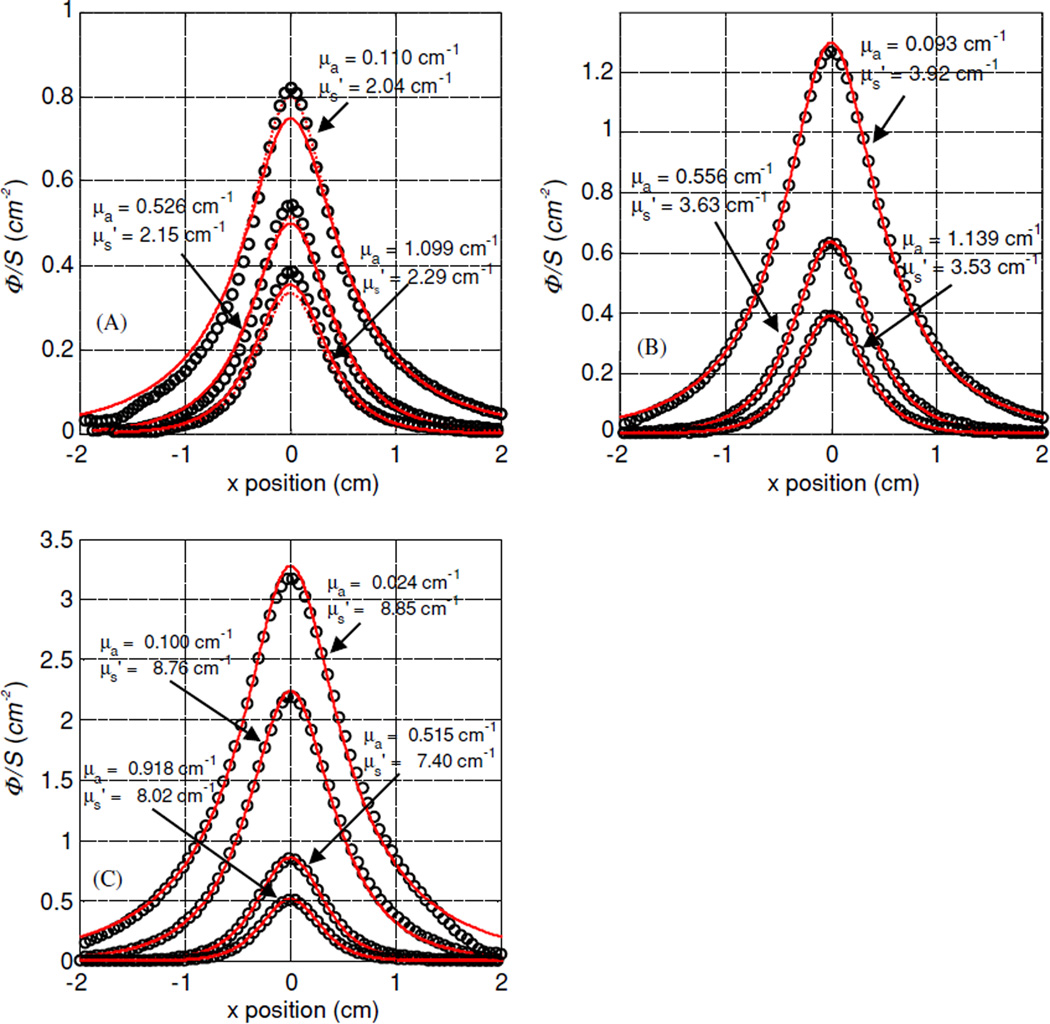
Figure 10 shows the results of the optical properties for three different scattering coefficients (A) 1.73, (B) 4.19 and (C) 9.14 cm−1 and ink concentration of 0.002, 0.012 and 0.023%, giving an absorption coefficient μa of 0.1, 0.5 and 1.0 cm−1. The distance between the light source and the detector was kept constant, at 5 mm. The scan for the phantom with optical penetration depth of δ = 1/μeff = 1.39 cm (figure 10(A)) has a significant boundary effect since the point source was placed at 1.5 cm from the boundary. For that reason, we only fit the right side of the data further away from the boundary. When the optical penetration depth is shorter than the distance to the boundary, this effect becomes negligible. We have also plotted in figure 10(A), the value of Φ/S calculated using the optical properties determined by the diffusion theory fit, but calculated using the higher-order P3 approximation (Hull and Foster 2001) (dotted lines) since the transport albedo can be significantly smaller than 0.9.
Figure 10.
Measured fluence rate per unit source power for different scattering media using 0.23, 0.53 and 1.14% Liposyn concentrations and 0.002, 0.012 and 0.023% ink concentrations at light-detector distance of 0.5 cm. (A) , (B) , (C) . The solid lines are the fit using diffusion theory. The optical properties determined using the diffusion theory are shown next to each fit. The dotted lines represent the fluence rate predicted by the P3 theory for these optical properties.
4. Interstitial set-up: advanced
4.1. Validation of the diffusion approximation
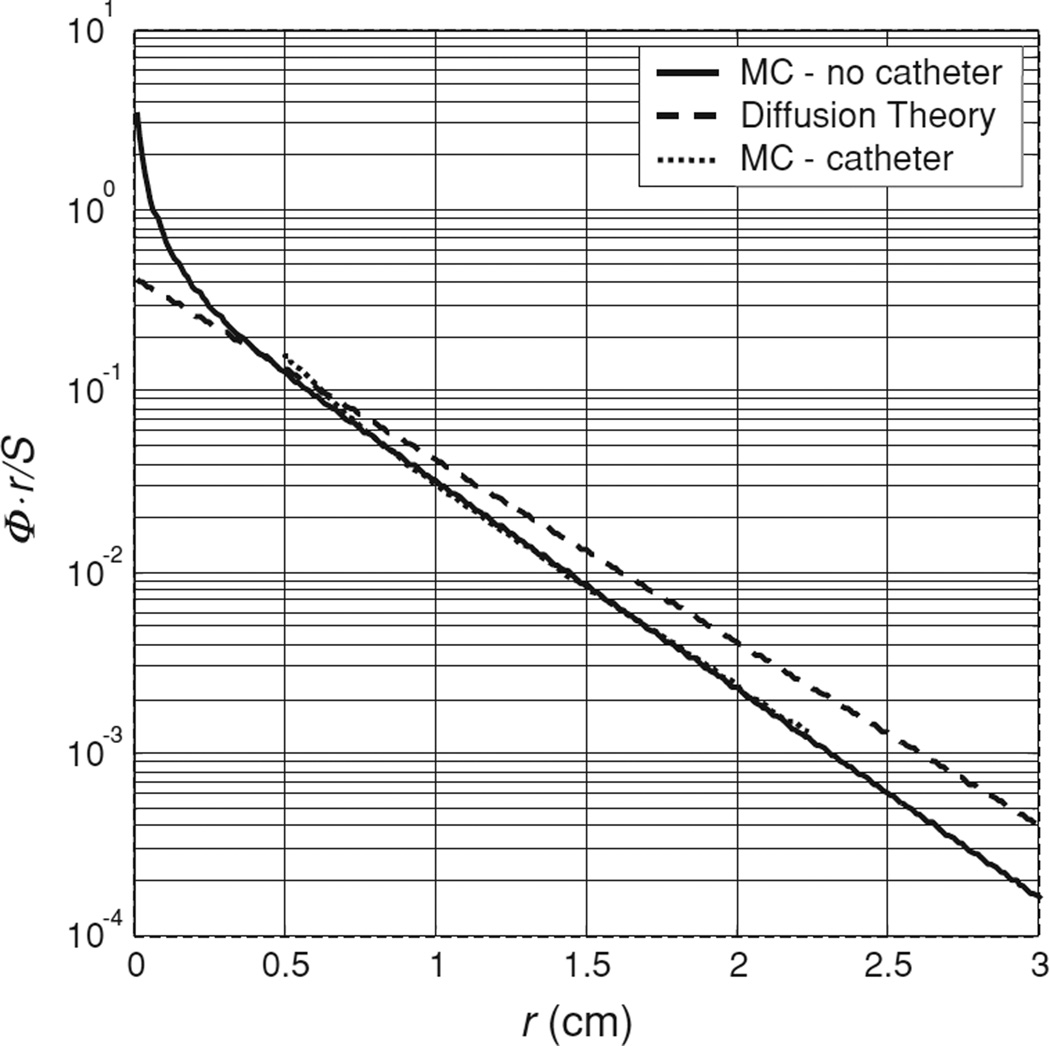
For cases where the transport albedo of the turbid medium is small (a′ < 0.8), the diffusion approximation is known to fail (Star 1997). An example corresponding to the worst case of albedo (a′ = 0.64) in our study is shown in figure 11, which plots the product of fluence rate and radial distance as a function of radial distance for a Monte Carlo simulation (solid line) of a point source in an optical phantom with μa = 1.0 cm−1 and (μeff = 2.32 cm−1). The corresponding solution of the diffusion equation is shown by the dashed line. Our Monte Carlo algorithm was implemented in Matlab using the implicit capture variance reduction technique described by Prahl et al (1989) and implemented in the commonly used MCML code by Wang et al (1995). The MC solution tends to deviate more from the diffusion solution at shorter distances (r ≤ 0.3 cm). The slopes of the two solutions are slightly different for larger distances. As a result, the best fit to this data using diffusion theory, which is indistinguishable from the data itself on the scale shown, gives an artificially higher value for μa (1.18 cm−1), (2.14 cm−1) and μeff(2.7 cm−1), respectively. For comparison, we have also plotted the results of a Monte Carlo simulation that includes the effects of a cylindrical catheter surrounding the isotropic source. A catheter diameter of 1.1 mm and an index of refraction mismatch between the catheter (air) and tissue of 1.4 were assumed. In this case, the presence of the air cavity makes less difference to the final result than the breakdown of the diffusion approximation. This is expected because μeff in this case is relatively small. However, even in cases such as this, where the diffusion theory is clearly beginning to fail, the optical properties (μa and ) determined by the two-catheter method are still within 20% of the true values. The limitation of the diffusion approximation can be addressed by the use of higher-order approximations (e.g. P3 theory) than the diffusion theory. In figure 10(A),we have shown that the use of P3 approximation (dotted line) does improve the agreement between the measurement and theory in most cases. The apparent disagreement between measurement and P3 calculation for the lowest curve results from the fact that the P3 calculation used the optical properties determined using the diffusion theory (μa = 1.1 cm−1 and ), which deviate significantly from the true optical properties (μa = 1.0 cm−1 and ). As the albedo of this phantom was only 0.63, it is not surprising that the diffusion theory failed to recover its optical properties accurately.
Figure 11.
Effect of small transport albedo on diffusion theory-based fitting. The Monte Carlo simulated data set for an isotropic emitter in an infinite medium with μa of 1.0 cm−1 and of 1.79 cm−1, measured by a detector at h = 5 mm, is indicated by the solid line. The diffusion theory solution for these optical properties is shown by the dashed line. The best fit of the diffusion theory to the simulated data is indistinguishable from the data, but gives μa of 1.18 and of 2.14 cm−1. For comparison, the dotted line indicates the Monte Carlo simulation for the same optical properties with the source embedded in a 1.1 mm diameter catheter.
4.2. Monte Carlo simulation of the air gap effect
As shown in figure 3(C), the experimental set-up introduces two air cavity columns, one surrounding the detector and one surrounding the light source. These catheters have an outer diameter of 1.1 mm and an inner diameter of 1.0 mm. The light source and the isotropic detector each have an outer diameter of 0.5 mm. To evaluate the effect of these air cavities, we have performed Monte Carlo simulations. The optical properties used were n = 1.4, g = 0.9, (μa, μs) = (0.10, 91.3), (1.00, 17.9) and (1.01, 91.3) cm−1, respectively. The Monte Carlo simulations were performed in cylindrical coordinates. The simulated volume was divided into annular bins of thickness 0.025 cm and height 0.025 cm. We have simplified the catheter as an air cavity of 1.1 mm diameter in the tissue phantom, with a light source at its centre. Photons launched from the isotropic source were propagated without absorption or scattering to the edge of the source catheter. Refraction at the boundary was accounted for both for the escaping photons and for any photons that re-entered the cavity. To maintain the cylindrical symmetry of the system, we have ignored the air cavity surrounding the detector.
The air cavity’s main effect is reducing the distance light must travel in the scattering medium between the source and detector. In cases with small μa, the fluence rate changes slowly with radial distance, so the air cavity has little effect. In contrast, when μa is large, the air cavity effect is much more pronounced. In figure 12, we plot the fluence rates predicted by Monte Carlo simulations with (solid line) and without (dashed line) an air cavity for various sets of optical properties. In the cases where μa is small (μa = 0.1 cm−1), the air cavity effect is negligible. When μa is large, however, the effect becomes more significant, and it changes the shape of the curve. The air cavity can be partially accounted for by reducing the value of h. For μeff ≤ 4 cm−1 and h = 5 mm, the best average value of h is 4.5 mm for the range of optical properties studied.
Figure 12.
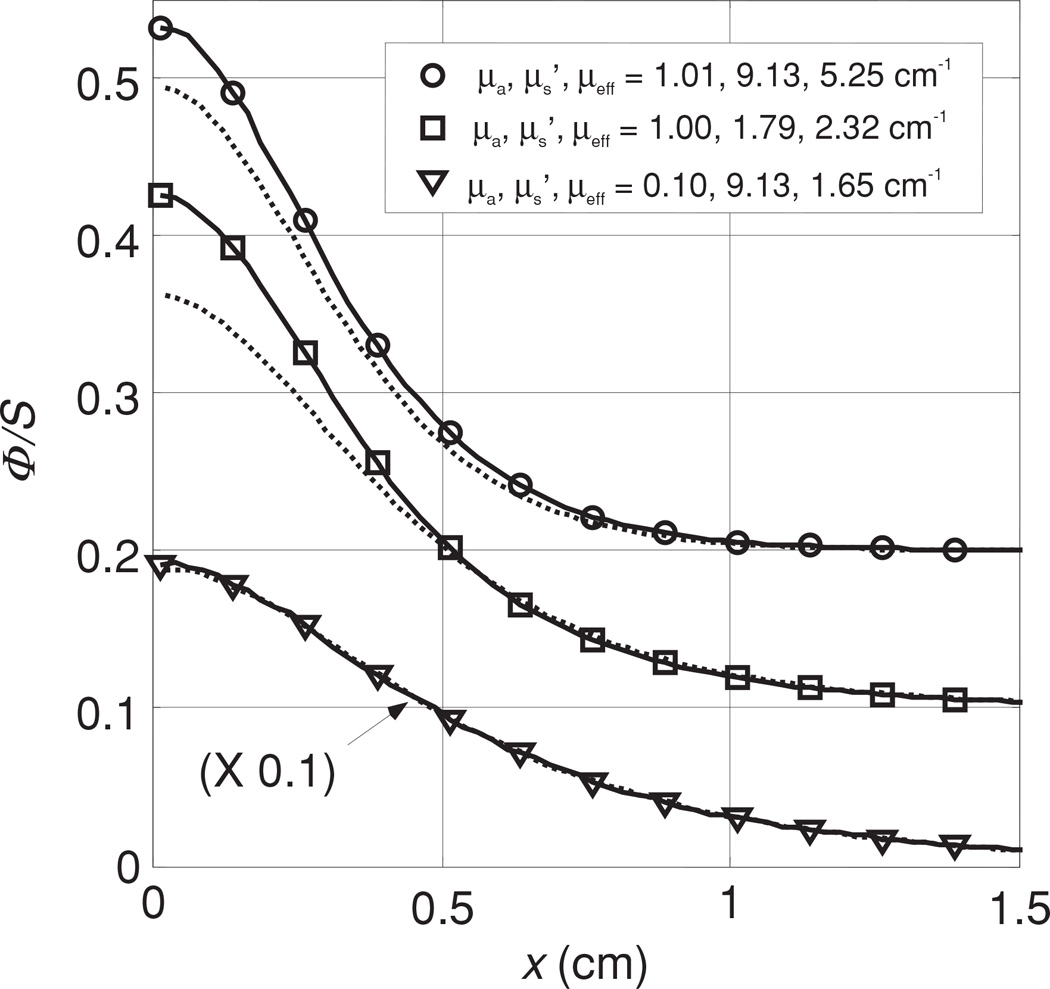
Effect of the air gap introduced by the source catheter on fitting results. For each of three sets of optical properties (indicated in the legend), we plot the Monte Carlo simulated fluence rate measured by a detector at h = 5 mm from a source embedded in a 1.1 mm diameter catheter (solid line) and that in an infinite medium along a line separated by h = 5 mm from the source (dotted line).
5. Discussion and conclusion
The main objective of this study was to create a device that can assess the optical properties (scattering and absorption coefficients) in vivo by interstitial measurements. We tested this device in tissue-simulating phantoms with different optical properties. During in vivo measurement, the scanning distance is typically 5 cm, so each measurement of optical properties takes 4 s. This is the time required to obtain a useful data set. Extensive commissioning of the device has been performed to ensure the accuracy of the measurement at this speed. We compared the results of our measurements with optical properties determined by an ex vivo method.
Our characterization of scattering properties for Liposyn 30% yields 8.1 × (c%IL), which is consistent with the literature, considering the variations among brands and batches of lipid solutions. An extensive study was made by Madsen et al (1992) for several brands of India ink. The ink concentrations used were 0.01–1% and the total attenuation coefficient was determined as a function of ink concentration with a value of 123 cm−1/% for Higgins ink at 594 nm. This is larger than our value (42.99 cm−1/%) for Higgins ink at 730 nm, but can easily be attributed to difference among batches. We can determine μa and of the phantom medium to an uncertainty of better than 5%. This error is determined in part by comparing extrapolated results from broad beam measurements against known ink and Liposyn concentrations. Our independent method of determining the optical properties is shown in figure 2. The optical properties (μa and ) were determined for each optical phantom under broad beam illumination. The black curve is the fit to the data that excludes the air–phantom interface and the background. The uncertainty in μeff can be estimated from the uncertainty in our measured data (see figure 7), giving a relative uncertainty of less than 0.1%, much smaller than the uncertainty in the measurement of the volumes of the ink and Liposyn components of the phantom. The accuracy of determining using the broad beam technique is within 8% for the lowest Intralipid concentration of 0.23% and 5% for the 0.53 and 1.14% Liposyn. The relative error of determining is less then 5% with a maximum of 8%.
Comparing the uncertainties of optical properties obtained with different source–detector separations (in table 3), it is clear that the best result is obtained using h = 5 mm. For the small separation (h = 3 mm) the uncertainty is larger because when the source-to-detector distance is small, the effect of air cavity introduced by the catheters is increased due to the reduction of the amount of scattering material between the catheters. In addition, diffusion theory breaks down when the detector is near the source (r ≤ ltr, where ltr is the transport mean free path given by ). For the large separation (h = 7 mm), the uncertainty for phantoms with large μeff starts to increase greatly because of decrease of the light fluence rate, resulting in larger uncertainty in extrapolating optical properties (see figure 8). Figure 8 shows the fitting results for an optical phantom with μa = 0.49 cm−1 and . Detailed fitting results are shown in the figure as well as in table 3, (B). While one gets reasonable results of optical properties at h = 3 mm, the fit deviates from measured data near the source. The fits are good for h = 5 and 7 mm. However, some of the resulting optical properties at h = 7 mm deviate from the true value by more than 30% (table 3).
There are several causes that give rise to uncertainties in determining the optical properties of a phantom: (1) measurement uncertainties of light fluence rate, (2) uncertainty in detector positioning (x) and distance between source catheter and detector catheter (h), (3) air cavity introduced by the catheter, and (4) limitations of the diffusion theory.
The first source of error is the uncertainty of light fluence rate measurement. We compared the data from eight identical measurements of the same point source and plotted the standard deviation as a function of fluence rate. The linear fit (shown in figure 7) gives the standard deviation σ(ϕ) = 0.015ϕ as a linear function of fluence rate ϕ. This indicates that the random error of our system corresponds to a relative uncertainty of 1.5%, which is not the limiting factor in our determination of optical properties.
By analysing the measured data using different distances h, we determined the optimal value of h, i.e. that which gives the best agreement with the known optical properties of the sample. Often, this optimal h is smaller than the measured centre-to-centre distance between channels. The major cause of error in determining the optical properties was the uncertainty in the distance between the detector and the light source (see figure 9), where a 0.5 mm error in catheter positioning could change dramatically the uncertainty of the fit. In figure 9, it can be seen that the best fit for the intended 5 mm separation is given by h = 4.5 mm for physical separation of 5 mm. Here, we used the standard deviation of the optical properties in all the phantoms as an indication of the separation to be used. As shown in figure 9, the 4 mm separation gave an average error of 21% with a maximum error of 49%, the 5 mm separation gave an average error of 17% with a maximum error of 49% and the 5.5 mm separation gave an average error of 44% with a maximum error of 155%. As can be clearly seen from figure 8, the 4.5 mm separation gives the lowest uncertainty with an average error of 17% and maximum error of 19%. Reducing the physical separation between the detector and the light source to 4.5 mm from 5 mm partially accounts for the effect of air cavity introduced by the catheter. Another cause of error was the positioning of the detector along the catheter. This error was minimized by using the motorized probe, giving a positioning accuracy of at worst 0.1 mm. The motorized probe is able to take approximately 800 points per measurement, further reducing the error measurement by increasing the number of measurement points.
The range of validity of the parallel-catheter method is limited to cases where μeff ≤ 4 cm−1. Cases with μeff > 4 cm−1 produce large errors in μa and if h is different from the optimal h by 0.5 mm.
The optical properties (absorption (μa), transport scattering , and effective attenuation (μeff) coefficients) of eleven patients with locally recurrent prostate cancer were measured in situ using interstitial isotropic detectors (see table 3). Measurements were made at 732 nm before motexafin lutetium (MLu)-mediated PDT in four quadrants. μa and varied between 0.07 and 1.62 cm−1 (mean 0.37 ± 0.24 cm−1) and 1.1–44 cm−1 (mean 14 ± 11 cm−1), respectively. μa was proportional to the concentration of MLu measured by an ex vivo fluorescence assay. μeff varied between 0.91 and 6.7 cm−1 (mean 2.9 ± 0.7 cm−1), corresponding to an optical penetration depth (δ = 1/μeff) of 0.1–1.1 cm (mean 0.4 ± 0.1 cm). These results are in the range of optical properties used in phantom measurement.
Pathologically, one can attribute the difference in to difference in cell and tissue structure caused by, among many possibilities, differences in cell type, the presence of scar tissue or local inflammation. Judging from the difference between the mean value of at 732 nm between human (14 ± 11 cm−1) and dog prostate (3.6 ± 4.8 cm−1) (Zhu et al 2005a, 2003), our measurement is sensitive enough to show the glandular structure difference between human and canine prostates. Since our measurement was made in cancerous prostates with prior radiation therapy, it is very possible that there are cancerous cells and normal cells, necrotic cells due to prior radiation therapy, and local inflammation due to the PDT procedure, all of which can contribute to the heterogeneity in . We find that in only 14% of cases was the measured larger than 20 cm−1. These exceptional values of may well indicate the presence of abnormal cells, although more data will be required to determine a correlation between large and specific changes in cellular structure. There is also the possibility of errors in estimating that contribute to the spread of . However, our current paper gives the upper limit of error in estimating , which in the worst case presented in the paper, is about 155% (see figure 9 for the case for μa = 0.99 cm−1, and h = 5.5 cm).
Quick and accurate determination of the optical properties of tissue is very important in a variety of diagnostic and therapeutic procedures. We developed a method to quickly determine the optical properties in tissue simulating liquid phantom for μa between 0.1 and 1.0 cm−1 and between 1.8 and 9.0 cm−1. Our device determines the optical properties μa and with a standard and maximum deviation of 8% (15%) and 18% (32%), respectively. The high uncertainty in determining the scattering coefficient comes from the fact that the diffusion theory only works for high transport albedo (a′ > 0.9). These errors are due mainly to uncertainty of the distance between the detector catheter and light source catheter, and the effect of the air cavity introduced by the catheter.
Acknowledgments
This work is supported by grants from the Department of Defense (DOD),DAMD1703-1-0132 and National Institute of Health (NIH), PO1 CA87971-01.
Footnotes
The program is available for download at www.xrt.upenn.edu/radiation_physics/research/index.html.
References
- Coquoz O, Svaasand LO, Tromberg BJ. Optical property measurements of turbid media in a small-volume cuvette with frequency-domain photon migration. Appl. Opt. 2001;40:6281–6291. doi: 10.1364/ao.40.006281. [DOI] [PubMed] [Google Scholar]
- Doornbos RMP, Lang R, Aalders MC, Cross FW, Sterenborg HJCM. The determination of in vivo human tissue optical properties and absolute chromophore concentrations using spatially resolved steady-state diffuse reflectance spectroscopy. Phys. Med. Biol. 1999;44:967–981. doi: 10.1088/0031-9155/44/4/012. [DOI] [PubMed] [Google Scholar]
- Driver I, Feather JW, King PR, Dawson JB. The optical properties of aqueous suspensions of Liposyn, a fat emulsion. Phys. Med. Biol. 1989;34:1927–1930. [Google Scholar]
- Farrell TJ, Patterson MS. A diffusion theory model of spatially resolved, steady-state diffuse reflectance for the noninvasive determination of tissue optical properties in vivo. Med. Phys. 1992;19:879–888. doi: 10.1118/1.596777. [DOI] [PubMed] [Google Scholar]
- Flock ST, Jacques SL, Wilson BC, Star WM, van Gemert MJC. Optical properties of Liposyn: a phantom medium for light propagation studies. Lasers Surg. Med. 1992;12:510–519. doi: 10.1002/lsm.1900120510. [DOI] [PubMed] [Google Scholar]
- Gurjar RS, Backman V, Perelman LT, Georgakoudi I, Badizadegan K, Itzkan I, Dasari RR, Feld MS. Imaging human epithelial properties with polarized light-scattering spectroscopy. Nature Med. 2001;7:1245–1248. doi: 10.1038/nm1101-1245. [DOI] [PubMed] [Google Scholar]
- Hull EL, Conover DL, Foster TH. Carbogen-induced changes in rat mammary tumor oxygenation reported by near infrared spectroscopy. Br. J. Cancer. 1999;79:1709–1716. doi: 10.1038/sj.bjc.6690272. [DOI] [PMC free article] [PubMed] [Google Scholar]
- Hull EL, Foster TH. Steady-state reflectance spectroscopy in the P3 approximation. JOSA A. 2001;18:584–599. [Google Scholar]
- Hull EL, Nichols MG, Foster TH. Quantitative broadband near-infrared spectroscopy of tissue-simulating phantoms containing erythrocytes. Phys. Med. Biol. 1998;43:3381–3404. doi: 10.1088/0031-9155/43/11/014. [DOI] [PubMed] [Google Scholar]
- Jacques SL. Light distribution from point, line and plane sources for photochemical reactions and fluorescence in turbid biological tissues. Photochem. Photobiol. 1998;67:23–32. [PubMed] [Google Scholar]
- Kienle A, Lilge L, Patterson MS, Hibst R, Steiner R, Wilson B. Spatially resolved absolute diffuse reflectance measurements for noninvasive determination of the optical scattering and absorptions of biological tissue. Appl. Opt. 1996;35:2304–2313. doi: 10.1364/AO.35.002304. [DOI] [PubMed] [Google Scholar]
- Kienle A, Patterson MS. Determination of the optical properties of semi-infinite turbid media from frequency-domain reflectance close to the source. Phys. Med. Biol. 1997a;42:1801–1819. doi: 10.1088/0031-9155/42/9/011. [DOI] [PubMed] [Google Scholar]
- Kienle A, Patterson MS. Improved solutions of the steady-state and the time-resolved diffusion equations for reflectance from a semi-infinite turbid medium. J. Opt. Soc. Am. A. 1997b;14:246–254. doi: 10.1364/josaa.14.000246. [DOI] [PubMed] [Google Scholar]
- Liu H, Boas DA, Zhang Y, Yodh AG, Chance B. Determination of optical properties and blood oxygenation in tissue using continuous nearinfrared light. Phys. Med. Biol. 1995;40:1983–1993. doi: 10.1088/0031-9155/40/11/015. [DOI] [PubMed] [Google Scholar]
- Madsen SJ, Patterson MS, Wilson BC. The use of India ink as an optical absorber in tissue-simulating phantoms. Phys. Med. Biol. 1992;37:985–993. doi: 10.1088/0031-9155/37/4/012. [DOI] [PubMed] [Google Scholar]
- Marijnissen JPA, Star WM. Performance of isotropic light dosimetry probes based on scattering bulbs in turbid media. Phys. Med. Biol. 2002;47:2049–2058. doi: 10.1088/0031-9155/47/12/304. [DOI] [PubMed] [Google Scholar]
- Moes CJM, van Gemert MJC, Star WM, Marijnissen JPA, Prahl SA. Measurements and calculations of the energy fluence rate in a scattering and absorbing phantom at 633 nm. Appl. Opt. 1989;28:2292–2296. doi: 10.1364/AO.28.002292. [DOI] [PubMed] [Google Scholar]
- Mourant JR, Freyer JP, Hielscher AH, Eick AA, Shen D, Johnson TM. Mechanisms of light scattering from biological cells relevant to noninvasive optical-tissue diagnosis. Appl. Opt. 1998;37:3586–3593. doi: 10.1364/ao.37.003586. [DOI] [PubMed] [Google Scholar]
- Mourant JR, Fuselier T, Boyer J, Johnson TM, Bigio IJ. Predictions and measurements of scattering and absorption over broad wavelength ranges in tissue phantoms. Appl. Opt. 1997;36:949–957. doi: 10.1364/ao.36.000949. [DOI] [PubMed] [Google Scholar]
- Nakai T, Nishimura G, Yamamoto K, Tamura M. Expression of optical diffusion coefficient in high-absorption turbid media. Phys. Med. Biol. 1997;42:2541–2549. doi: 10.1088/0031-9155/42/12/017. [DOI] [PubMed] [Google Scholar]
- Nichols MG, Hull EL, Foster TH. Design and testing of a white-light, steady-state diffuse reflectance spectrometer for determination of optical properties of highly scattering systems. Appl. Opt. 1997;36:93–104. doi: 10.1364/ao.36.000093. [DOI] [PubMed] [Google Scholar]
- Patterson MS, Chance B, Wilson BC. Time resolved reflectance and transmittance for the non-invasive measurement of tissue optical properties. Appl. Opt. 1989;28:2331–2336. doi: 10.1364/AO.28.002331. [DOI] [PubMed] [Google Scholar]
- Pogue BW, Patterson MS. Frequency-domain optical absorption spectroscopy of finite tissue volumes using diffusion theory. Phys. Med. Biol. 1994;39:1157–1180. doi: 10.1088/0031-9155/39/7/008. [DOI] [PubMed] [Google Scholar]
- Prahl SA, Keijzer M, Jacques SL, Welch AJ. A Monte Carlo model of light propagation in tissue. SPIE Inst. Ser. 1989;5:102–111. [Google Scholar]
- Press WH, Teukolsky SA, Vetterling WT, Flannery BP. Numerical Recipes in C: The Art of Scientific Computing. New York: Cambridge University Press; 1992. [Google Scholar]
- Rolfe P. In vivo near-infrared spectroscopy. Ann. Biomed. Eng. 2000;02:715–754. doi: 10.1146/annurev.bioeng.2.1.715. [DOI] [PubMed] [Google Scholar]
- Solonenko M, Cheung R, Busch TM, Kachur A, Griffin GM, Vulcan T, Zhu T, Wang H-W, Hahn SM, Yodh AG. In vivo reflectance measurements of optical properties, blood oxygenation and motexafin lutetium uptake in canine large bowels, kidneys and prostates. Phys. Med. Biol. 2002;47:857–873. [PubMed] [Google Scholar]
- Star WM. Light dosimetry in vivo. Phys. Med. Biol. 1997;42:763–787. doi: 10.1088/0031-9155/42/5/003. [DOI] [PubMed] [Google Scholar]
- van Staveren HJ, Moes CJM, van Marle J, Prahl SA, van Gemert MJC. Light scattering in Intralipid-10% in the wavelength range of 400–1100 nm. Appl. Opt. 1997;30:4507–4514. doi: 10.1364/AO.30.004507. [DOI] [PubMed] [Google Scholar]
- Storn R, Price K. Differential evolution—a simple and efficient heuristic for global optimization over continuous spaces. J. Global Optimization. 1997;11:341–359. [Google Scholar]
- Swartling J, Dam JS, Anderson-Engels S. Comparison of spatially and temporally resolved diffuse-reflectance measurement systems for determination of biomedical optical properties. Appl. Opt. 2003;42:4612–4620. doi: 10.1364/ao.42.004612. [DOI] [PubMed] [Google Scholar]
- Torricelli A, Pifferi A, Taroni P, Giambattiselli E, Cubeddu R. In vivo optical characterization of human tissues from 610 to 1010 nm by time-resolved reflectance spectroscopy. Phys. Med. Biol. 2001;46:2227–2237. doi: 10.1088/0031-9155/46/8/313. [DOI] [PubMed] [Google Scholar]
- Vulcan TG, Zhu TC, Rodriguez CE, Hsi RA, Fraker DL, Baas P, Murrer LH, Star WM, Glatstein E, Yodh AG, Hahn SM. Comparison between isotropic and nonisotropic dosimetry systems during intraperitoneal photodynamic therapy. Lasers Surg. Med. 2000:292–301. doi: 10.1002/(sici)1096-9101(2000)26:3<292::aid-lsm7>3.0.co;2-t. [DOI] [PubMed] [Google Scholar]
- Wang LI, Jacques STL, Zheng L. MCML—Monte Carlo modeling of light transport in multi-layered tissues. Comput. Methods Programs Biomed. 1995;47:131–146. doi: 10.1016/0169-2607(95)01640-f. [DOI] [PubMed] [Google Scholar]
- Zhu TC, Bjarngard BE, Ying X, Yang CJ. Modeling the output ratio in air for megavoltage photon beams. Med. Phys. 2001;28:925–937. doi: 10.1118/1.1376639. [DOI] [PubMed] [Google Scholar]
- Zhu TC, Dimofte A, Finlay FC, Stripp D, Bush T, Miles J, Whittington R, Malkowicz SB, Tochner Z, Glatstein E, Hahn SM. Optical properties of human prostate at 732 nm measured in vivo during Motexafin Lutetium-mediated photodynamic therapy. Potochem. Photobiol. 2005a;81:96–105. doi: 10.1562/2004-06-25-RA-216. [DOI] [PMC free article] [PubMed] [Google Scholar]
- Zhu TC, Dimofte A, Finlay JC, Glatstein E, Hahn SM. Detector calibration factor for interstitial in vivo light dosimetry using isotropic detectors with scattering tip. Proc. SPIE. 2005b;5689:174–185. doi: 10.1117/12.590330. [DOI] [PMC free article] [PubMed] [Google Scholar]
- Zhu TC, Hahn SM, Kapatkin AS, Dimofte A, Rodriguez CE, Vulcan TG, Glatstein E, Hsi RA. In vivo optical properties of normal canine prostate at 732 nm using motexafin lutetium mediated photodynamic therapy. Photochem. Photobiol. 2003;77:81–88. doi: 10.1562/0031-8655(2003)077<0081:ivopon>2.0.co;2. [DOI] [PubMed] [Google Scholar]


