Abstract
The application of THz to medical imaging is experiencing a surge in both interest and federal funding. A brief overview of the field is provided along with promising and emerging applications and ongoing research. THz imaging phenomenology is discussed and tradeoffs are identified. A THz medical imaging system, operating at ~525 GHz center frequency with ~125 GHz of response normalized bandwidth is introduced and details regarding principles of operation are provided. Two promising medical applications of THz imaging are presented: skin burns and cornea. For burns, images of second degree, partial thickness burns were obtained in rat models in vivo over an 8 hour period. These images clearly show the formation and progression of edema in and around the burn wound area. For cornea, experimental data measuring the hydration of ex vivo porcine cornea under drying is presented demonstrating utility in ophthalmologic applications.
Keywords: Biological and medical imaging, clinical instruments, hydration interactions, medical diagnostics, submillimeter, Terahertz, THz
I. Introduction
Although the terahertz (THz) field first used the moniker “THz” to describe research in the 100 GHz to 10 THz range in the early 1970s [1], the first (arguably) published THz medical imaging result did not appear in the literature until the late 1990s [2]. In this work Mittleman et al. used a THz time domain system to image a burn on chicken breast skin induced by a high powered, argon ion laser. Changes were measured in the complex dielectric constant of the tissue due to both reductions in water concentration and perturbations in biochemical composition. Since the late 1990s THz medical imaging has been proposed and applied to a variety of medical imaging applications including skin [3]–[11] and breast [12]–[15] cancer margin detection, burn wound imaging [2], [16]–[19], skin hydration monitoring [20], [21], and corneal hydration measurement [22]–[24]. A check of the published dates of the preceding references indicates that THz medical imaging is essentially completing its first decade as a research discipline. The last 10 years of research have resulted in a wealth of medical THz data and results, and has helped establish initial acceptance in the medical community.
Due to the presence of water in physiological tissue and the high THz absorption of water, reflective THz imaging has distinct advantages over earlier transmission-based systems, especially in in vivo applications. Furthermore the dielectric properties of water these frequencies yield easily detectable changes in THz reflectivity for small changes in hydration making water content variation an effective contrast mechanism. Variations in dielectric function have been measured in different tissue types and between cancerous and healthy tissues, and these are due largely to changes in water content [25]. These advantages coupled with the low, non-ionizing THz photon energy (0.4–40 meV) may make THz an ideal tool for in-vivo imaging of skin burns [26], [27], melanoma/carcinoma [28]–[31], corneal pathologies, and cancers.
This paper will first provide an overview of THz medical imaging including a brief discussion of medical funding, a condensed history of the field, and applications currently under investigation. The review will focus on imaging specifically; for THz biomedical spectroscopy and sensing the interested reader is encouraged to access one of the following excellent review articles [12], [32]–[37]. Following the review the THz electromagnetic properties of water and its strong dependence on frequency are elucidated. The large real and imaginary components of the permittivity of water in the THz region and its prevalence in physiological tissues significantly affect THz medical imaging and water is often the dominant contrast mechanism in THz medical imagery. In Section IV, a detailed discussion of center illumination frequency and associated effects on THz imaging are provided. The THz regime covers nearly 2 decades of bandwidth and illumination frequency can significantly affect the expected spatial resolution, scattering performance, and hydration sensitivity of a THz medical imaging system. Tradeoffs are analyzed and an optimal band, covering 400–700 GHz is identified. A THz medical imaging system operating at a center frequency of ~525 GHz with ~125 GHz of response normalized bandwidth is presented in Section V. The system operates in reflection mode, uses a photoconductive source and Schottky diode detector, and was designed using the phenomenology arguments detailed in Section IV. Spatial resolutions of 1 mm and hydration sensitivities of ~0.4% by volume were achieved. This system was used to acquire images of both ex vivo and in vivo skin burns, as well as corneal phantoms and ex vivo porcine cornea specimens and these results are discussed in Sections VI and VII.
II. Review of the Field
A good barometer of the status of any emerging medical imaging technology is the amount of funding it receives from the National Institutes of Health (NIH). One of the first NIH grants for THz medical imaging was awarded to Dr. Peter Siegel at Caltech in 2002 for the development of high signal to noise THz imaging and spectroscopy units. Following this award only a handful of THz medical imaging proposals have been deemed sufficiently meritorious to receive funding from the NIH resulting in a grand total of ~$3.67 million [38]. These numbers represent a considerable ramp-up in both interest and acceptance of THz imaging by the medical research community (as compared to the 1990s), and they are a testament to the innovative work of THz researchers over the past two decades. The progress and increased acceptance of THz medical imaging is also due in part to the support provided by the National Institute of Biomedical Imaging and Bioengineering (NIBIB, est. in 2000) as well as the continuing and rapid development of THz source and detector technologies [39]–[47]. The field has benefited greatly from the emergence of highly sensitive room temperature detectors [48]–[50] and efficient, small foot print sources [40], [45], [48], [49]. These tools have empowered researchers to build systems with considerably small form factor and robustness to enable sufficient portability for in vivo animal studies and clinical trials.
A. Beginnings
The first indication that water could be used as a contrast mechanism in THz imagery of biological systems was provided in 1995 when Hu and Nuss published transmission images of a leaf immediately after being plucked from the host plant and then following 48 hours of drying [51]. The initial image displayed nearly uniform absorption across the leaf surface. At the 48 hour mark the hydration in the periphery had been lost to evaporation and only the leaf veins retained water. Mittleman et al. published the first imagery of mammalian tissues in 1999 using a time domain spectroscopy system (TDS) to image circular burns in chicken breast samples that had been created using an argon ion laser [2]. The resulting reflectivity map was inversely proportional to the laser fluence, and the gradients in reflectivity resembled a Gaussian distribution proportional to the laser spot profile. Mittleman concluded that a reduction in water concentration based on laser fluence was the primary contrast mechanism, although the changes in tissue complex dielectric constant due to heat-induced chemical and morphological modi?cations could not be discounted.
In the same year Arnone et al. published the first THz imagery of human tissue, specifically extracted teeth [52]. Dehydrated tooth samples were imaged and dental caries were identified based on differences in absorption. Additionally, porcine tissue was used to demonstrate the first evidence of contrast in muscle and adipose tissue, using differences in hydration as the contrast mechanism.
One interesting observation about the aforementioned work and other early imaging results [8], [35], [53], [54] is that they were all acquired with pulsed imaging systems based on photoconductive sources and either photoconductive or optoelectronic detection schemes (time-domain). This can be partially attributed to various inherent practical advantages of time-domain architecture including room temperature operation, broad instantaneous bandwidth, and relatively small form factor. At the time of these experiments diode multiplier chains with sufficiently fast frequency modulation [39] were not readily available nor were quantum cascade lasers (QCL) operating in the mid to low THz band [55]. Additionally, medical images using backward wave oscillators (BWO) did not appear in the literature until 2004 [56] for reasons unclear to the authors as these sources have been commercially available for quite some time.
B. Skin
Skin cancer imaging is one of the more popular areas of THz medical imaging research partially due to its location on the surface of the body thus avoiding the limited tissue penetration depth that render most other in vivo applications impossible. Skin cancer is the most common human cancer and non melanoma lesions comprise the majority of such cases with a proportion of ~75% basal cell carcinomas (BCC) and ~20% squamous cell carcinoma (SCC) [57]. Large or infiltrative tumors can extend 15 mm beyond the border visible to the naked eye at the surface of the skin and surgeons often remove generous margins to ensure complete resection. However these cancers often appear on the face, and for cosmetic reasons it is preferable to preserve as much normal surrounding tissue as possible [58], [59] thus motivating the development of imaging systems capable of detecting skin cancer margins.
The groups out of Leeds, Cambridge, and TeraView have published extensively on this topic, presenting data from both ex vivo and in vivo specimens [3], [5]–[11]. Wallace et al. undertook a study on the absorption of excised BCC samples from 19 patients and reported successful discrimination between diseased and healthy tissues [9]. The time post peak (TPP) technique was used to normalize the peak value of the reflected pulse to the amplitude of the same waveform at 1.73 ps post peak. This delay maximized contrast and the resulting images agreed well with histology. Wallace et al. also performed an in vivo study on the reflection characteristics of five BCC patients, generating images using the peak reflected value and the TPP technique at delays of 2.8 ps and 3.12 ps corresponding to depths of 250 μm and 278 μm respectively [9]. These were the first reported in vivo THz imaging studies. Additional skin cancer studies have been performed and have generally demonstrated an increase in reflectivity of cancerous tissue as compared to healthy tissue [3], [5]–[11].
The THz electromagnetic properties of skin have been thoroughly modeled and tested against experimental results. Pick-well et al. used finite difference time domain (FDTD) techniques and double Debye theory to model the interaction of a THz pulse with skin [3], [4]. The intermediate and infinite frequency water dielectric constants employed were 6.6 and 4.1 respectively while the skin values were slightly less at 3.6 and 3.0 due to the less than unity water volume fraction. These results provide strong evidence that skin can be modeled as a semi infinite homogenous medium with a dielectric constant similar to that of liquid water. Hydration mapping of porcine and chicken skin samples have corroborated water as the dominant contrast mechanism [20], [60].
C. Cancer
Additional cancerous tissues have been probed with THz imaging with varying degrees of success. A handful of groups have performed imaging experiments on excised liver tumors [61]–[64]. Enatsu et al. imaged liver cancer samples embedded in paraffin blocks with a THz-TDS system configured for transmission. Images were generated using data at 1.5 THz and contrast was sufficient to successfully segment cancerous areas based on both refractive index and absorption gradients [63]. The study concluded that cancerous tissues were less dense than normal tissues, thus giving rise to the lower refractive index and absorbance. Similarly, Nakajima et al. performed transmission images on paraffin-embedded liver cancer samples with a THz-TDS system [61]. Images were generated with absorption and refractive index data at 1.7 THz. However one of the samples in this study did not display contrast in absorbance or index alone and the authors concluded that more sophisticated image processing techniques were necessary to extract information from the data.
Breast cancer has been a topic of interest in the THz field due to the increased presence of adipose tissue in breast and hence low water content by volume [3], [4], [12], [15], [65], [66]. Breast tissue hydration levels should facilitate deep penetration of THz illumination and Pickwell et al. has suggested depths of up to 9 mm depending on the SNR [12]. Fitzgerald et al. imaged 22 formalin fixed breast tumor samples and found a correlation coefficient of 0.82 between the areas identified as tumor by the THz imaging system and histopathology. Similarly Ashworth et al. imaged 20 fresh breast cancer specimens in transmission and noted an increase in refractive index of cancerous tissue although the cause was unknown. However, breast volume remains an issue hindering clinical use and factors such as geometry, cellularity, penetration depth, etc. remain active areas of research.
D. Additional Studies
Additional THz studies have included further imagery of animal tissues [67], skin burns in animal tissues [2], [16]–[19], [22], and of dehydrated, extracted teeth [65], [68], [69]. One factor common amongst all the above references is the lack of hyperspectral image generation. Although many papers report on spectral characteristics of various tissues, and a few detail depth resolved structure, none have reported specific spectral signatures or characteristic absorption lines. This is most likely due to the dielectric constant of water at THz frequencies that is free from resonances and which tends to dominate the aggregate response of tissues. As such all the above results, save for one, were generated using one of the following three methods:
-
1)
the maximum detected pulse amplitude;
-
2)
the ratio of maximum to minimum amplitude;
-
3)
the ratio of amplitudes at pre-selected delays.
Reference [62] is the only result that employed band area ratios as are common in tradiational hyperspectal or spectrally resolved imaging systems. This leads to questions regarding center operating frequency and bandwidth. Researchers have reported maximum contrast for certain samples at 835 GHz [64], and ~500 GHz [18], [70] and imaging results have been reported with illumination frequencies as high as 1.8 THz [62], but an optimal band and/or bandwidth needed to achieve a desired resolution, detection probability, etc. has yet to be identified and it is likely that this will vary depending on application or clinical indication. Furthermore, system architecture plays a large role in bandwidth selection; e.g., frequency modulated systems operate with as little as 2%–3% bandwidth for speckle mitigation while time domain systems employ as much as 200% bandwidth to achieve high depth resolution (TPP technique).
E. THz Safety
THz safety is a vigorous area of research and the effects of THz illumination on tissue is an important question that must be addressed prior to any human clinical trials. Due to low photon energy (0.4–40 meV) the effect of THz illumination on tissue is thought to be limited to thermal effects and this has been substantiated with recent experimental results.
In a paper published in 2003, keratinocytes were exposed to 0.45 J/cm2 of broadband radiation from 0.2 to 3.0 THz. This THz dose was determined to have no effect on cellular differentiation and produced no stimulation or inhibition of cellular activity [71], [72]. Other studies have treated lymphocytes [73], [74] and fibroblast samples [75] with radiation at approximately 0.12 and 2.52 THz respectively, and found no significant effects on cell cycle kinetics and no discernable chromosomal DNA damage. The latter study conducted a thorough examination of gene expression in 27 targets involved in the sensing or repair of DNA damage. There were no significant changes in the expression of any of these genes after exposure to 84.8 mW/cm2 [76]. The only observed effects of the exposure were found in the expression of three heat shock protein genes. The degree of expression was found to be indistinguishable from that of control cells, whose temperature was raised by submersion in a heated water bath.
The three heat shock proteins identified in prior studies were HSP70, HSP105, and HSP40, and the effects of THz radiation on these have been further quantified in dermal fibroblasts in a study by Wilmink et al. [77]. Continued work by the authors have found that HSP70, HSP105, and HSP40 exhibited up-regulation of roughly 260%, 180%, and 170% respectively relative to untreated cells with standard deviations of 120%, 60%, 90%, respectively [77], [78]. These results suggest that the expression changes after THz exposure are due primarily to the rise of temperature and confirm the widely held belief that tissue damage arises only from thermal effects.
The current safe exposure level for millimeter wave illumination set in the early 1980s is 10 mW/cm [79] and this power density has been applied to the THz region as well. [36]. Although much has been learned since regarding the interaction of THz with physiological tissue, as of early 2011 nothing yet has emerged that prompts raising or lowering this safety value.
III. Water in the THz Region
A. Debye Model
Tissue is composed of anywhere from 20% to 80% water by volume depending on the type of tissue and the location within the tissue [80], [81]. For example muscle typically maintains a constant hydration of ~75% throughout the thickness of the tissue, while skin can vary from 20% at the stratum corneum up to 66% in the deep dermis [81]. The dielectric constant of water itself at THz frequencies has both large real and imaginary components and its electromagnetic properties typically dominate the aggregate response of tissue to THz illumination [3], [4]. As such it is necessary to understand the interaction of THz with water to characterize THz medical imagery.
The frequency dependent THz permittivity of water in the liquid [3], [4], [82]–[88] and vapor phase [89], [90] has been studied using both time and frequency domain techniques. In the vapor phase, water molecules are allowed to rotate/vibrate and discreet absorption lines arising from these dynamics are observed in recorded spectra [1]. In liquid water however, these modes are suppressed by the proximity of adjacent molecules, and dielectric properties are devoid of frequency dependent resonances. The permittivity of liquid water quickly drops in the THz regime from ~7–j13 at 100 GHz down to ~4–j3 at 1 THz [82]. As the large complex component of dielectric constant indicates, loss in the THz region is dominated by dielectric polar-izability and power absorption can be as high as 175 cm–1 at 600 GHz.
The complex dielectric constant of liquid water at THz frequencies is generally described with the Debye model expressed as a sum of exponential relaxation times or in the frequency domain, a sum of single pole, low pass filters [87]
| (1) |
| (2) |
Given the illumination spectra of the majority of THz medical imaging systems and the good agreement between experiment and data, (1) is often truncated at two terms and written as in (2) [82], [87]. In this expression, is the DC permittivity, f1,2 are the corner frequencies related to distinct relaxation times, and are characteristic dielectric properties. Some variability exists in the literature on the choice of characteristic frequencies and permittivities and these are summarized in Table I.
TABLE I.
Constants for Double Debye Model
B. Bruggeman Model
Tissue dielectric properties are an aggregate of the properties of water and biological components such as collagens, elastins, and other proteins. Given the small size of capillaries, cells, and other structures in tissue with respect to THz wavelengths, the electromagnetic properties of many tissues can be assessed on a macroscopic scale as opposed to a microscopic scale, thus justifying the use of effective media theory (also known as dielectric mixing theory) [91]. Amongst the commonly used effective media theories, the Bruggeman model, written in (3), [91]–[93] is numerically stable over the largest range of volume fractions [92]
| (3) |
The effective permittivity of the medium, , is defined in (3) where εk and pk are the complex dielectric constant and volume fraction, respectively, of component k, and the volume fractions, pk, must sum to unity. There are N solutions that satisfy (3) but only one will be physically meaningful. That is, all known tissue constituents have permittivities with positive real parts thus only one of the N solutions of (3) will lie in the right half plane. (This has been validated numerically but to the authors’ knowledge the physical meaning of this solution set is not understood.)
Dry tissue dielectric constants are difficult to find in the literature due to structural and biomechanical changes from dehydration. However, the refractive indexes and absorption coefficients of a range of tissue components such as elastin, collagen, amino acids, and polypeptides have been experimentally measured [94]–[96]. These constituents range in index from 1.5 to 2.5 with negligible loss tangent (i.e., 0-imaginary component). Therefore many tissues can be modeled as a homogeneous mixture of water and low loss dielectric (some tissues, such as skin benefit from the addition of stratified media theory [21]).
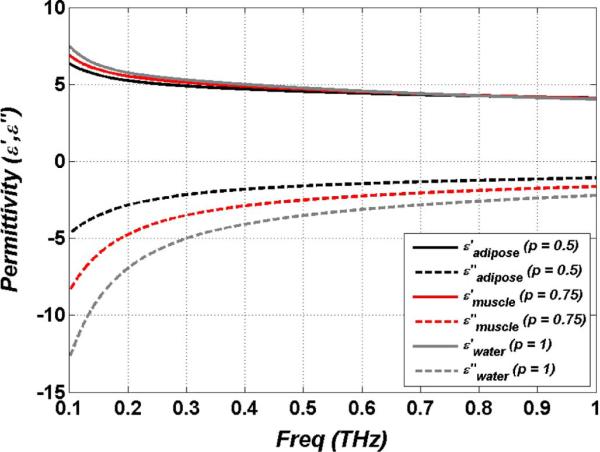
Fig. 1 displays a plot of the effective complex dielectric constant of tissue models for hydration levels of 50% and 75% by volume corresponding to approximate hydration levels of adipose tissue and muscle tissue respectively along with liquid water (100%) for reference. As seen in the plot, the real part of the permittivity does not vary much across the range from 50%–100%, but the imaginary component varies significantly over same hydration range. Thus contrast induced by hydration changes are due to variations in ε″.
Fig. 1.
Complex dielectric constant of liquid water and effective permittivities of muscle (p = 0.75) and adipose (p = 0.5) tissue.
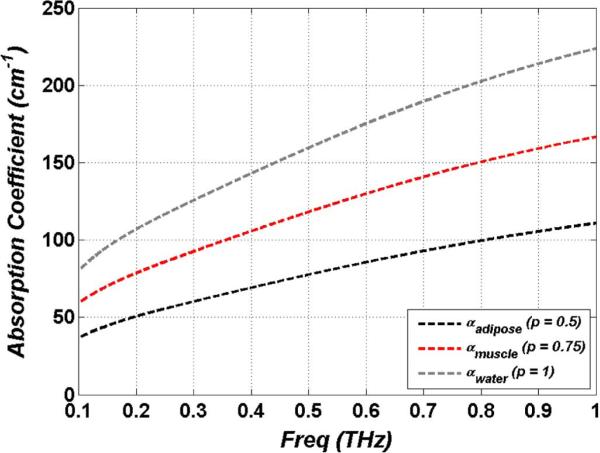
The general expression for the power absorption coefficient is expressed in (4) and Fig. 2 displays the absorption coefficient computed using the effective dielectric constants of Fig. 1. Note that the absorption is computed without considering scattering from the tissue. At frequencies much larger than 1 THz absorption may increases at faster rates due to scattering. (Recent studies have reported on the role of tissue structure on THz absorption [97])
| (4) |
As seen in the figure, power absorption coefficients are significant and approach that of undoped silicon in the near infrared (NIR) [98]. Pickwell et al. has computed a penetration depth in muscle of < 1 mm using similar analysis [12], [99]. This provides ample motivation for imaging systems operating in reflection mode and these computed absorption coefficients clearly demonstrate the limited penetration depth of THz imaging to hydrated tissue.
Fig. 2.
Power absorption coefficients for liquid water and effective media models of muscle (p = 0.75) and adipose (p = 0.5) tissue.
IV. Reflective THz Imaging Power Spectrum Considerations
The choice of illumination spectral density and/or detection spectral responsivity for a THz imaging system can greatly affect resolution, sensitivity, scattering, and other aspects that contribute to overall image quality. Thanks to the large instantaneous bandwidth of photoconductive sources and broad spectral range of available waveguide mounted sources such as frequency multiplier chains and backward wave oscillators (BWO), researchers have nearly two decades of bandwidth to draw from corresponding to fractional bandwidths of >200%. The following sections detail some of the basic bandwidth tradeoffs for THz medical imaging. Each plot is accompanied by a highlighted region denoting the 400–700 GHz band. Center illumination frequencies in this band have been determined optimal for THz medical imaging using the following analysis and these results have influenced the design of the system presented in Section IV.
A. Hydration Sensitivity and Penetration Depth
For many THz medical imaging applications, measurement sensitivity is determined by quantifying the expected change in THz tissue reflectivity for a given change in water volume fraction at a particular volume fraction. As discussed above, recent literature has demonstrated through both theory and experiment that dielectric models of water can accurately describe THz interaction with biological material, and much of the contrast in tissue imaging is primarily due to water concentration gradients.
Basic calculations on hydration sensitivity can be explored using the dielectric properties of water and simple Fresnel equations. Although illumination beams in THz imaging systems are generally Gaussian [100], the Rayleigh length of the beam after focusing is generally longer than the depth of penetration/interaction of the THz beam in tissue, given the large attenuation constant. Accurate results can therefore be obtained using plane wave analysis. (For more in-depth calculations see the k-space method [101]). For this study we model the tissue as a homogenous mixture of water and biological background which is constructed as a lossless dielectric with an index of 2. The reflection coefficient of a half space of tissue in air is
| (5) |
| (6) |
where the location θ1 and θ2 are adjusted to reflect the polarization angle of incidence, is defined with the Bruggeman model in (6), εw is defined with the Debye model in (2), εBB is the dielectric of the biological background, and the tissue half space is composed entirely of these two components. The intrinsic sensitivity of THz imaging to hydration changes as a function of frequency is computed by taking the derivative of (5) with respect to water volume fraction (p):
| (7) |
Close inspection of (5)–(7) reveals that at non-normal incidence the transverse-electric (TE) polarization will produce higher intrinsic contrast than the transverse-magnetic (TM) polarization. Therefore the following discussion has been limited to the TE case.
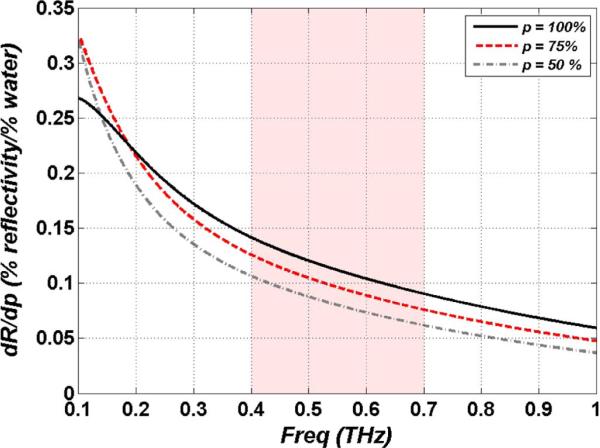
Equation (7) has been simulated for hydration concentrations of 100% (pure water), 75% (muscle tissue), and 50% (adipose tissue) and the trends are displayed in Fig. 3 with the y-axis in units of % change in THz reflectivity per % change in water volume fraction. Not only does lower frequency illumination provide greater reflectivity, it also produces greater changes in reflectivity for a given change in water contrast with ~6 times more sensitivity at 100 GHz as compare to 1 THz. An interesting consequence of (7) is the crossover in delta reflectivity at ~150 GHz between pure water, and hydrated tissues. The highest intrinsic contrast available for hydration contrast in the physiologically relevant range at 100 GHz exceeds that of pure water, and one can envision building point measurement systems at millimeter wave frequencies if imaging is not required.
Fig. 3.
Intrinsic hydration sensitivity as a function of water concentration and illumination frequency using the double Debye dielectric model and Bruggeman effective media theory.
B. Scattering
Scattering from rough surfaces is a well known and often observed problem in optics [102], [103], and has been studied in the THz band for simple cases [104]–[110]. In THz medical imaging, particularly the imaging of skin, typical target feature sizes approach hundreds of micrometers, placing them directly in the middle of the wavelength bands of interest. This poses a significant problem for hydration sensing, where small changes in hydration dependent reflectivity may be masked by random scattering caused by target geometry. This aspect has led many researchers to employ a window composed of a lossless dielectric to flatten the field during THz medical imaging experiments [3]–[10], [12]–[15], [19], [22], [61]–[64]. However windows add additional system complexity as well as raise issues of sterilization and should be avoided when possible.
A common method used to model frequency dependent scattering in the THz regime is the Rayleigh roughness factor [104]–[110]:
| (8) |
where σ is the standard deviation of the surface roughness, θ the illumination angle of incidence, and λ the illumination wavelength. The Rayleigh roughness factor describes the average fraction of power reflected in the specular direction for plane wave illumination and assumes a Gaussian probability density function (pdf) of surface profile heights.
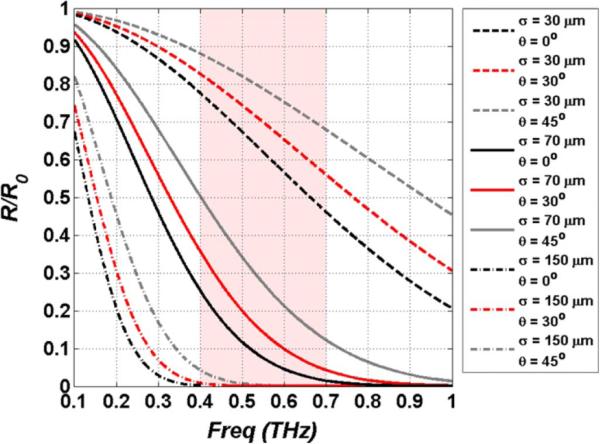
Equation (8) was simulated for standard deviations of 30, 70, and 150 μm and incidence angles of 0°, 30°, and 45°, thus encompassing typical tissue surface roughnesses and common illumination angles. The results are shown in Fig. 4. As expected, lower frequencies are much more robust to scattering than higher frequencies, and tissues appear more specular in the millimeter wave range than they do in the sub-millimeter. An interesting consequence of the Rayleigh roughness factor is the effect of incidence angle as displayed in Fig. 4. Oblique illumination reduces scatter in the non-specular direction and in certain circumstances may motivate operating at glancing incidence at the expense of increased spot size due to beam smearing.
Fig. 4.
Simulation of Rayleigh scattering for pairs of RMS surface roughness and incidence angle. Note the increase in specularity as the incidence angle increases.
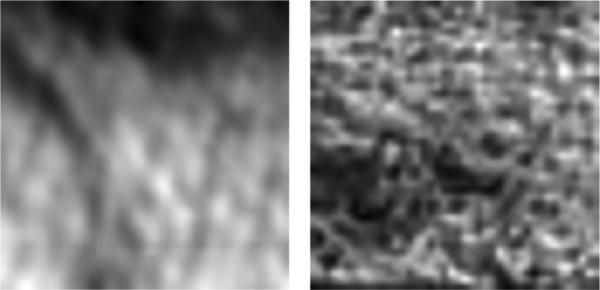
Spot size also significantly affects the scattering performance of the imaging system. The expected variance in return signal of a Gaussian beam swept across a random rough surface is difficult to model and as such closed form expressions describing the statistics are difficult to produce [111]. In lieu of a mathematical model, we present images of ex vivo porcine skin acquired with two pairs of off-axis parabolic (OAP) mirrors incorporating differing incidence angles and spot sizes.
The image on the left side of Fig. 5 was acquired with a 10–90 spot size of 2.2 mm at a 45° incidence angle, while the image on the right was acquired with a spot size of 1 mm at a 30° incidence angle. Both images cover a 2 cm ×2 cm square area and were illuminated with a center frequency of 525 GHz with 125 GHz of 3 dB bandwidth. Although the fine detail in the figure at left is somewhat masked, the overall variance due to scattering is less with a coefficient of variance (σ/m) of 0.17 on the left and 0.23 on the right. This resolution tradeoff is appropriate in skin imaging where rough surface scattering can contribute more variance to the image than hydration gradients.
Fig. 5.
Example of rough surface scattering from ex vivo porcine skin. (Left) 38.1 mm effective focal length (EFL) at 45° incidence angle. (Right) 25.4 mm EFL at 30° incidence angle.
C. Spatial Resolution
The majority of THz medical imaging systems are operated in the far field with the beam focused by off-axis parabolic mirrors or low loss dielectric lenses. Since the output of most THz sources (e.g., planar antennas, waveguides, QCLs) can be approximated with a Gaussian beam [100], theoretical spatial resolution limits can be calculated using Gaussian beam theory and ABCD matrices. Furthermore, commonly used off-axis parabolic mirrors produce no geometric aberrations when used on axis, and their available surface roughness is orders of magnitude less than the wavelength at these frequencies so the thin lens approximation holds well for these components [112]. The 2×2 matrix of an OAP is written in (9) [113] where fm is the mirror focal length:
| (9) |
The waist location and spot size of the Gaussian beam following focusing by a thin lens optic located at the beam waist using the ABCD matrix in (9) is given in (11) and (12) where zR is the Rayleigh length, λ is the wavelength in free space, ω0,1 is the waist size of the collimated beam incident on the OAP clear aperture and ω0,2 is the waist size of the focused THz beam:
| (10) |
| (11) |
| (12) |
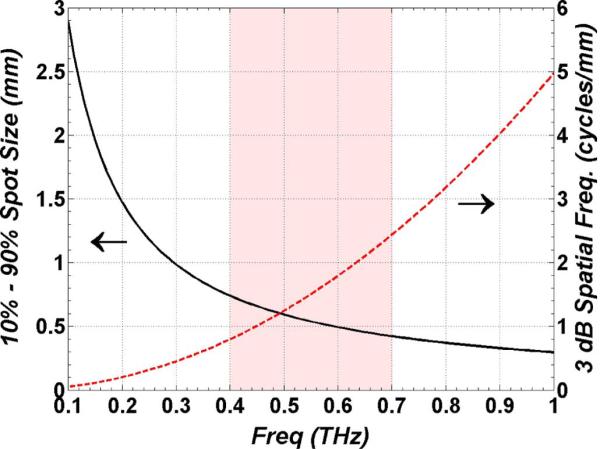
Equations (11)–(12) were simulated with a high numerical aperture, 25.4 mm effective focal length off-axis parabolic mirror with a 25.4 mm clear aperture 90% filled by the THz beam. This optic represents a practical upper limit on the focusing power (f/1) of available reflective THz optics. The results are displayed in Fig. 6 and form an upper bound on THz beam focusing performance.
Fig. 6.
Plot of THz imaging system resolution as a function of frequency. (Left axis) spot size as a function of frequency using the 2D integration of (12). (Right axis) 3 dB spatial frequency cutoff in cycles per mm computed with the Fourier transform of (12).
Equations (11)–(12) assume a perfectly collimated beam incident on the OAP clear aperture in addition to an ideal TEM00 Gaussian transverse profile (M2 = 1). Both of these are difficult, if not impossible, to achieve in practice and the preceding analysis should be treated as an upper limit on spatial resolution. Equation (11) describes the location of the beam waist following focusing from the OAP and can be used to calculate chromatic aberration. While mirrors are generally accepted as being free from chromatic aberration, this effect can become an issue at THz frequencies as a result of the large λ/D ratios (relative to visible light optical systems) common in this frequency band.
D. Conclusions
The tradeoffs between high and low frequencies are clear from the previous subsections on the effects of THz band to image phenomenology. While it is possible to define a cost function that favors any arbitrary band, the most logical starting point for system design is to choose as low a frequency band as possible while maintaining some minimum spatial resolution. The band covering 400–700 GHz offers the best compromise between scattering, sensitivity to water concentration gradients and maximum spatial resolution. The following section details a THz imaging system operating at 525 GHz with 125 GHz of bandwidth and designed using the concepts of this section.
V. A Reflective THz Medical Imaging System
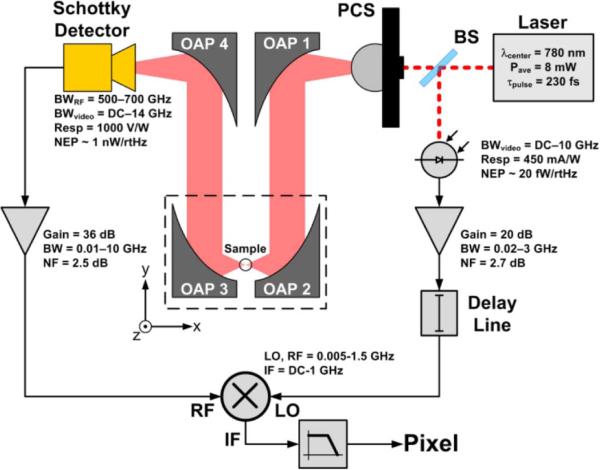
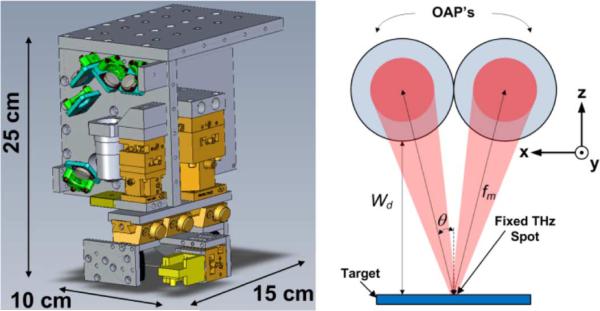
A block diagram of the pulsed THz imaging system [11], [18], [22]–[24], [60], [114], [115] used to generate the images in this paper is shown in Fig. 7 and a CAD drawing of the system is displayed in the left side of Fig. 8. The THz source was a 9 μm × 9 μm photoconductive switch [40], [45] pumped by a 780 nm femtosecond (fs) laser with a 230 fs pulse width, 20 MHz repetition rate, and ~8 mW of average power.
Fig. 7.
Block diagram of the THz imaging system. OAP 2 directs THz illumination at 14° off the z-axis in the -x,-z direction.
Fig. 8.
THz imaging system. (Left) CAD model of THz imaging system with dimensions. The femtosecond laser is integrated into this figure but not visible from the presented viewing angle. (Right) Illumination geometry with axes matching those of Fig. 7. The incidence angle and working distance are functions of the OAP focal length and clear aperture.
At high DC-bias fields (200 V/9 μm gap = 222 kV/cm) the source produced an optical to quasioptical (THz) conversion efficiency of >1% yielding average powers of up to 46 uW across 1 THz of bandwidth [45]. The switch was mounted on the backside of a high resistivity silicon hyperhemisphere and positioned ~60 mm away from a 76.2 mm effective focal length (EFL), 25.4 mm clear aperture OAP mirror as this numerical aperture was found to be the best match to the photo conductive switch beam pattern. The collimated beam was directed towards a THz OAP objective where it was focused onto the target at a 30°, 14°, or 9° angle for 25.4 mm, 50.8 mm, and 76.2 mm EFL OAP pairs respectively. The reflected beam was collimated by a third parabolic mirror and then focused using a 25.4 mm (EFL) OAP into the feed horn of a 0-bias Schottky diode [116] detector mounted in a WR1.5 waveguide.
Following the THz rectifier was a gated receiver consisting of a low-noise pulse amplifier, a double-balanced mixer, and a low pass filter (integrator). The rectified THz pulse was amplified (G = +40 dB, BW =10 GHz) and then coupled to the RF port of a double-balanced mixer. The gating was realized by driving the LO port of the mixer with a reference RF pulse generated from sampling the mode-locked laser using a free space 99/1 beam splitter, a photodiode and a broadband amplifier. The reference pulse was passed through an RF delay line adjusted so that the pulse arrives at the mixer synchronous to the amplified THz pulse. The DC voltage from the IF port of the mixer was sent through a low pass filter, amplified with an audio frequency instrumentation amplifier, and sampled using a 14 bit DAQ with a 0.8 ms time constant. Pixels are generated by raster scanning the target in the x and y directions, using stepper motors.
As a consequence of the high optical to THz conversion efficiency, the system produced sufficiently high SNR with a low power femtosecond fiber laser (1560 nm mode locked EDFA+PPLN SHG [117]). This allowed a compact, imaging head integrating 780 nm and THz optics. The imaging head measured 10 cm × 15 cm × 25 cm and comsumed a total system volume of less than 3750 cm3.
A major practical advantage of the receiver architecture shown schematically in Fig. 7 is the number of optical components. This design minimizes laser alignment and down-converts the THz signal to base band immediately, making the system more robust to misalignment. The compact size and robust layout improve the portability of the system, and have allowed reliable operation in the animal operating room environment.
A. Effective Illumination Band
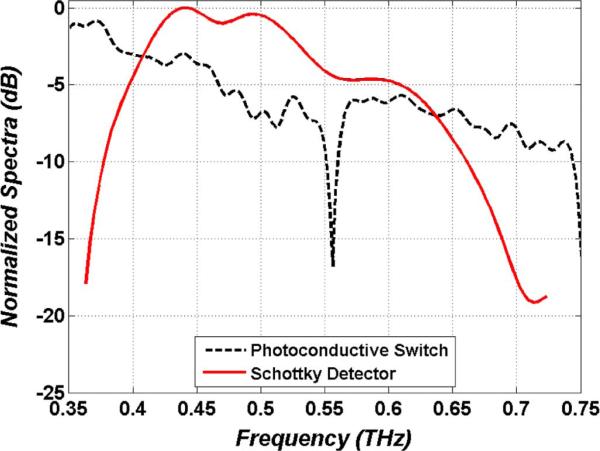
The effective center frequency and bandwidth of the system are constrained by the switch power spectral density (PSD) the detector spectral responsivity. Waveguide mounted, 0-bias Schottky diodes are convenient detectors in the THz regime as these devices offer high room temperature responsivity (~1000 V/W), low NEP (~100 pW/Hz1/2), and extremely broad video bandwidth (1–14 GHz). Furthermore, the waveguides are typically terminated in pyramidal feed horns with well-known and well behaved beam patterns exhibiting extremely low side lobes. Another advantage of the waveguide mounting is that it provides well-defined pass bands with a sharp cut on frequency and a relatively sharp roll-off due to the emergence of higher order modes. This is especially useful when used as an incoherent detector of broadband illumination as it ensures an unambiguous operational band.
The normalized power spectral density of the photoconductive switch is displayed in Fig. 9 superimposed on the normalized Schottky diode spectral responsivity. The switch spectrum was acquired with a Fourier Transform Infrared (FTIR) spectrometer and He-cooled composite bolometer. The detector spectral responsivity was measured with a THz photomixing setup [118].
| (13) |
| (14) |
Fig. 9.
THz imaging system spectra. The dotted (black) line is the normalized photoconductive switch power spectral density. The solid line (red) is the Schottky diode normalized spectral responsivity. The response peaks at ~440 GHz and the total width reflects the operational band of a WR1.5 waveguide.
The center frequency and response normalized bandwidth of the system were calculated using (13) and (14) where is the detector spectral responsivity (red curve in Fig. 9) and S(f) is the switch power spectral density (black curve in Fig. 9). These computations yielded a center frequency of 525 GHz with 125 GHz of 3 dB bandwidth.
B. Optical Characterization
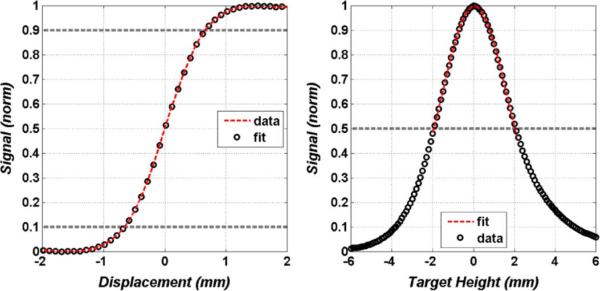
Spot size and depth of focus measurements are displayed in Fig. 10. The spot was measured using a knife edge target with the edge swept through the beam (in the x direction as defined in Figs. 7 and 8), and is defined with the standard 10–90 edge response criteria. The data follows the fit (dotted line) predicted by the 2D integration of TEM00 Gaussian beam and yields a 10–90 dimension of 1.1 mm.
Fig. 10.
Optical characterization. (Left) Knife response of the spot size on target measured along the x-axis (as defined in Fig. 8). (Right) Depth of focus limited by the optical properties of the mirrors and feedhorn directivity.
The depth of focus (DOF) was measured by translating a polished metal reflector in and out of the focal plane (±z direction as defined by the axes in Fig. 8) and the OAP ELFs and measures a total of 4 mm full width at half maximum (FWHM).
Superimposed on the data is a Gaussian fit whose shape is predicted by Gaussian beam transverse mode matching [119]. A slight asymmetry about the maximum is visible in Fig. 10 and is due to unequal beam walk off as the target is moved above and below the focal plane. The DOF is limited primarily by the optics of the system and not the pulse multiplication of the receiver. The delay line was manually scanned at the extremum of the DOF sweep (±6 mm) and found to have minimal effect on the synchronicity of the rectified THz pulse and reference pulse.
C. Receiver
The receiver (shown schematically Fig. 7) is, in essence, a very fast, externally triggered, boxcar integrator with RF and IF bandwidths dictated by the choice of mixer and amplifiers. The advantage of this receiver architecture lies in its simplicity and robustness. There are few optical components and acquisition of interferograms (e.g., time domain systems) is not required. Furthermore the DC value measured by the DAQ is proportional to the area under the curve of Fig. 9, and the post processing from DC value to pixel amplitude is minimal The receiver also has an advantage over FMCW signal processing in that its THz bandwidth is instantaneous, thus the video bandwidth is limited only by the noise and IF bandwidth of the components and not by a frequency sweep period. The disadvantage of this receiver architecture as compared to receivers employed in time-domain and coherent CW systems is that the phase information of the THz signal is destroyed by the detector (square law) and therefore the complex dielectric properties and stratified structure of the tissue cannot be ascertained. (The RF bandwidth of any connector that supports the transmission of DC is not broad enough to regain the THz phase via the Kramers–Kronig relation [120]).
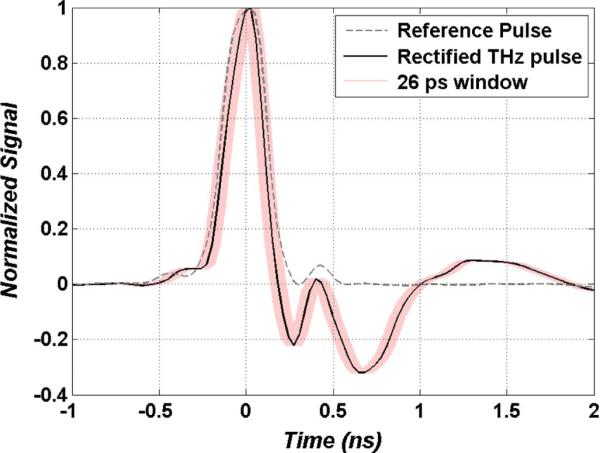
The rectified THz and reference pulses driving the RF and LO ports of the mixer are displayed in Fig. 11. The reference pulse was generated with the photodetector coupled to a 3 GHz bandwidth LNA. The rectified THz pulse was generated with the Schotkky diode detector coupled to a 10 GHz LNA. These traces were measured using a high speed digital oscilloscope with an analog bandwidth of 2.25 GHz and sampling rate of 8 GS/s (Agilent 54846B). While the measurement of the reference pulse reflects the true amplified photodetector signal, the rectified THz pulse was likely much narrower in time given its expected broad video bandwidth. Power spectrum measurements using an RF spectrum analyzer (HP 8595E) confirmed measurable bandwidth of the LNA coupled detector up to 14 GHz (>4 GHz higher than the rated amplifier response). A 10 GHz (LNA bandwidth) Gaussian transform limited pulse yields a FWHM pulse width estimate of ~20 ps, thus the THz pulse was likely an order of magnitude shorter than temporal resolution of the oscilloscope and more than an order of magnitude shorter than the reference pulse. Attempts were made to directly measure the video bandwidth of the detector but the dynamic range of the spectrum analyzer was insufficient.
Fig. 11.
Traces of the reference pulse (grey dotted) and rectified THz pulse (black solid) feeding the double balanced mixer. The shaded (pink) envelope around the rectified THz is a ±13 ps window corresponding to differences in pulse arrival time from target height changes of ±2 mm (system DOF).
The output power spectrum of the signal from the receiver is computed using (15) where HIF(f), HRF(f), HLO(f), are transfer functions of the IF (pixel amplitude), RF (rectified THz pulse), and LO (reference pulse) ports of the mixer respectively; PTHz(f) and PRef(f) are the spectral densities of the rectified THz pulse and reference pulse respectively, and * denotes the convolution operator.
| (15) |
| (16) |
The proportionality relation describing a pixel amplitude generated by the receiver is written in (16) and expressed as je the DC value of (15) where SThz(f) = HRF(f)PTHz(f), and SRef(f) = HLO(f)PRef(f). Equation (16) is expressed as a summation of discrete terms to reflect the pulsed (discreet spectral line) nature of the THz illumination. The number of terms in the sum depend on the bandwidths of the incoming pulses and their associated ports. As reported in Fig. 11 and expressed in (15)–(16), the reference pulse PSD (PRef(f)) constrains the overall bandwidth of the system prior to pulse mixing. Increasing the width of PRef(f) and thus SRef(f) will add more terms to the summation in (16) hence increasing the detected DC signal and consequently the SNR. However, bandwidth increases will narrow the reference pulse width thus providing a shorter gating window. This results in an increased sensitivity to changes in THz path length and thus a reduced robustness to changes in target height throughout the imaging process. To help illustrate this concept, a 26 ps (±13 ps) envelope has been superimposed on the rectified THz pulse trace in Fig. 11 corresponding to THz free space path length changes of ±4 mm or a target height change of ~±2 mm. This is equivalent to the optically limited system DOF (displayed in Fig. 10), and ~13x greater than the maximum surface roughness of skin. It is apparent from this envelope that the bandwidths employed in this system will maintain sufficient overlap between the reference and THz pulses for path length changes within DOF. Increases to the reference pulse bandwidth will reduce gating time and eventually result in incomplete gating of the rectified THz pulse This introduces the need to scan the delay for every pixel which can lead to drastic increases in image acquisition time. The ~3 GHz reference pulse bandwidth employed here has been determined empirically to be a good tradeoff between SNR and synchornicity.
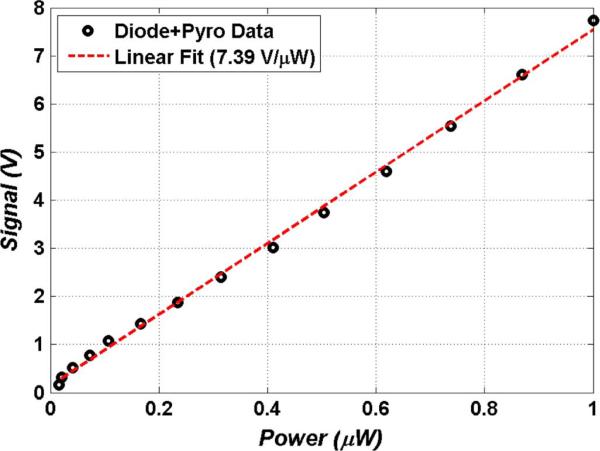
The signal dependent responsivity curve of the receiver is displayed in Fig. 12. The receiver responsivity was measured by sweeping the bias voltage of the THz source (photoconductive switch) and measuring the output signal from the receiver. To account for the non-linear dependence of THz output power on photoconductive switch bias voltage, a pyro-detector was used to directly measure the free space THz power of the photoconductive switch through a 100 V bias sweep. The pyroelectric detector was assumed linear in power [121] and the measured power was converted to the fraction of power seen by the diode detector using the spectral responsivity data shown in Fig. 9. A linear fit (R2 = 0.99) with a computed slope of 7.46 V/uW was computed from the receiver responsivity curve. This translates to an NEP of ~1 nW/rtHz. It should be noted that the distribution of power in the output of photoconductive switch is invariant to bias voltage [40], which allows us to correlate the Schottcky diode signal to the pyro signal.
Fig. 12.
Amplified system responsivity with a linear fit to data (R2 = 0.985). Deviations at low THz powers are attributed to the significant 1/f noise of the pyroelectric detector.
D. Hydration Sensitivity
As in many remote sensing applications, it is important to define the sensitivity of this THz medical imaging system to hydration; its primary contrast mechanism. For example, infrared imaging uses Noise Equivalent Delta Temperature (NEΔT) [100] and active radar systems often use Noise Equivalent Reflectivity Difference (NERD) [100]. For THz medical imaging a metric entitled Noise Equivalent Delta Water Concentration (NEΔWC) [114] has been developed as a method to quantify the minimum change in water concentration resolvable by the reflective THz imaging system.
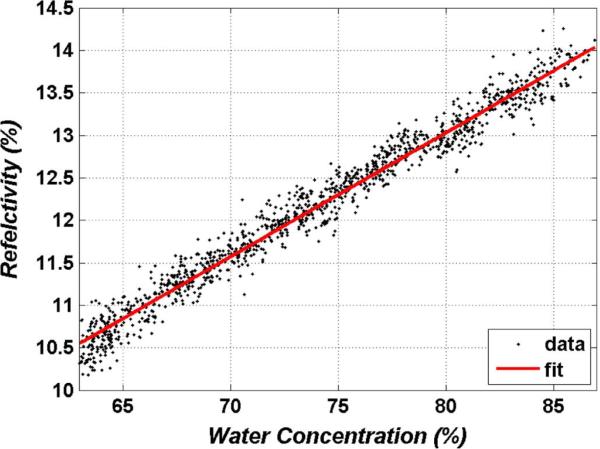
To accomplish this, a phantom hydration target was constructed consisting of a section of 150 μm thick polypropylene filter paper suspended flat and placed on a high precision scale (filter paper has been used previously to demonstrate hydration sensitivity [122], [123]). This assembly was then positioned beneath the imaging system while simultaneous THz and weight data were probed every second for 20 minutes. The results of this experiment are displayed in Fig. 13, where sample weight has been converted to hydration using the measured weight and the known fill factor of the polypropylene towel. The hydration range was limited from ~65% to ~85% corresponding to the physiologically relevant hydration range of most tissues.
Fig. 13.
Change in THz reflectivity as a function of the change water concentration of the polypropylene towel hydration phantom.
A linear fit (R2 = 0.98) is superimposed on the data in Fig. 13 and displays an intrinsic contrast (slope) of 0.14% (reflectivity:hydration) with a normalized sum of square errors (SSE) of 3.17. The NEΔWC is computed as:
| (17) |
where SSE/N is the ensemble variance and dR/dp is the slope of the linear fit. This computation produces a NEΔWC of ~0.4%. A significant amount of variance in signal is due to fluctuations in the scale reading, and the coefficient of variance for the THz reflectivity data and scale data are nearly equivalent. As such, this measured NEΔWC represents an upper bound on sensitivity.
E. System Remarks
This system is not ideal for every application and cannot be used to identify narrow band spectral properties. However, in situations where contrast generation (anomaly detection) is sufficient and/or situations where the sample constituents are already known, the rectified THz pulse, gated receiver phenomenology presents a good choice.
VI. Burn Imaging
A. Motivation
Approximately 500,000 patients are treated for burns in the United States annually and of these, ~50,000 require hospitalization, and 400 die each year, making mortality from burns the fifth leading cause of injury-related death in the United States [124]. In addition to their high mortality, large burns are also very morbid, requiring extensive and repeated surgical and intensive care treatment and rehabilitation regimens. It has been estimated that costs related to treatment of burn injuries account for 13% of all medical claims despite their relatively low incidence [125].
The crux of burn wound assessment is distinguishing between superficial and deep partial thickness burns. This is because deep partial thickness burns and full thickness burns require burn wound excision and skin grafting, whereas more superficial burns can be managed conservatively [126]. Currently, the most commonly used methods for estimating burn depth are visual and tactile assessment. These methods are highly inaccurate, however, because there is a lag time of 3–5 days before a burn's gross appearance reflects the true extent of injury [127]. Additionally, this method lacks standardization because it relies entirely on the experience of the surgeon.
Diagnostic techniques that have been applied to the detection and quantification of skin burns include green dye fluorescence, laser Doppler perfusion imaging (LPI), polarization sensitive optical coherence tomography (PS-OCT), thermography, ultrasound, nuclear magnetic resonance (NMR) and infrared imaging [128]–[130]. Among these existing techniques PS-OCT and LDI have shown the most promise however both suffer from various limitations such as strong optical scattering and poor depth resolution and, at the time this manuscript was submitted, have failed to gain wide spread clinical acceptance. (A complete list of burn imaging systems used clinically can be found here [131])
The physiological response of tissue to a burn injury is the formation and maintenance of edema. THz imaging is very sensitive to these fluid shifts and spatial and temporal characterization of edematous tissue may improve the accuracy of burn depth estimation.
B. Ex Vivo Burn Imaging
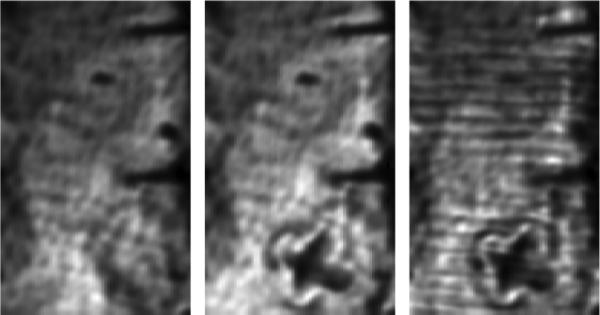
Initial burn experiments were completed with ex vivo porcine skin as it is known to closely mimic human skin [132]. The skin samples were stored in a refrigerator immediately after they were harvested from the animal and arrived at the laboratory less than two days post-harvest. The fatty hypodermis was cut away from the back of the sample, leaving a uniformly flat sheet of skin measuring ~2.5 mm thick with a variation of only 5%. The skin was stretched and mounted on a 12.7 mm thick polypropylene substrate similar to the one used for the water evaporation experiment, and affixed using a 25 mm × 50 mm grid of 1.5 mm diameter pins to maintain a flat imaging plane. A THz image of the skin prior to the burn is displayed on the left side of Fig. 14. The two dark lines perpendicular to the top of the images are shadows of the nails arising from the oblique illumination angle, resulting in ~0 reflected signal amplitude. The variation in average intensity from right to left is due to beam steering caused by the slight variation in thickness of the prepared skin. This image and the two subsequent images were acquired without the use of a window to flatten the imaging field.
Fig. 14.
THz ex vivo burn images. (Left) uninjured skin immediately following removal of subcutaneous layers. (Middle) Skin sample with ‘X’ shaped burn. (Right) Skin sample covered with 3 layers of gauze. Note the faint ‘halo’ like region of low reflectivity surrounding the burns in the middle and right figures. Reprinted from [114].
An aluminum brand was heated to ~315°C and used to burn an ‘X’ shaped pattern into the skin. The brand was applied with contact pressure for 2–3 s. The porcine skin was allowed to equilibrate to room temperature prior to branding.
An image of the same scan area following branding is displayed in the middle of Fig. 14, with the burned area clearly distinguished from the non-burned areas (~75% drop in signal voltage). The burned skin contains less water and therefore is less reflective. A thin region of low reflectivity running along the periphery of the ‘X’ was observed. This is an area of hyperpo-fusion (decreased presence of liquid) and likely correlates with the burn injury margin. The skin sample was then covered with three layers of medical gauze and scanned again. The resulting image is displayed on the right side of Fig. 14 and demonstrates the benefits of the broad band illumination. The gauze pattern arising from the two pass absorption of the cloth fibers is clearly visible as is the skin burn injury and finer details such as the hypoperfused burn border.
C. In Vivo Burn Imaging
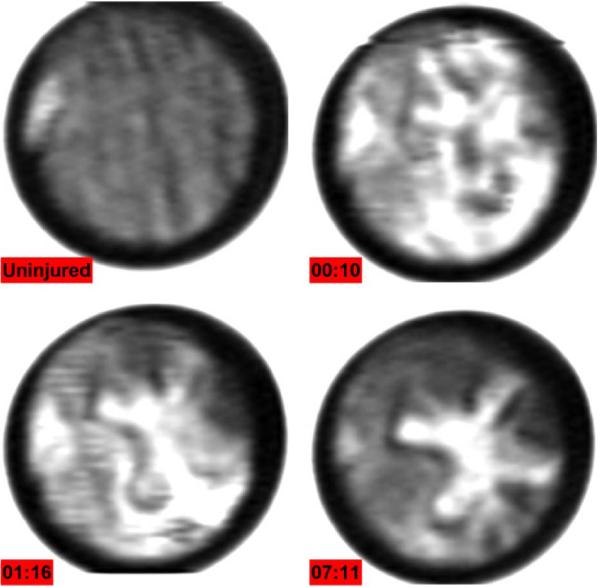
Initial in vivo burn images were acquired with rats as their skin physiology is very similar to humans and they are the most practical animals on which to perform feasibility studies (in-depth details of the experiment can be found in [117]). The study was approved by the UCLA Institutional Review Board (#2009-094-02). One male Sprague Dawley rat weighing 200–300 g was anesthetized with isofluorane and prior to burn, the animal was administered an analgesic. The combination of substances and their delivery technique was chosen to minimize any physiological activity that would affect the immune response to the applied burn. A flat area (4 cm × 4 cm) on the abdomen was shaved with electric clippers to minimize irritation and then cleaned with antiseptics to reduce the chance of infection. The rat was then placed beneath the imaging system and the shaved area of the belly was flattened with a 12.7 μm thick circular mylar window positioned against the skin with light pressure. A THz image of a 35 mm diameter area of unburned skin beneath the mylar window is displayed in the top left of Fig. 15. The Mylar window flattens the imaging field but is extremely thin so the varying surface profile of the rat belly is still somewhat visible. The Mylar window frame is made of steel and reflects a larger portion of THz illumination than the skin thus the circular field of view is bounded by a white, highly reflective region.
Fig. 15.
THz burn images displaying formation of edema in an in vivo burn wound. Each image took ~10 minutes to acquire. (Clockwise from Top Left) Rat belly prior to application of heated brand, 10 min post burn, >1 hour post burn, 7 hours post burn. Reprinted from [133].
An ‘+’ shaped burn was inflicted using a brass brand within the control scan area. The ‘+’ profile brand measured 20 mm × 20 mm with 2.5 mm thick arms. The brand was heated to 220°C using a hot plate and pressed against the skin with contact pressure for ~10 seconds. Following application of the burn the Mylar window was placed back over the burned region and the injury was re-imaged. THz burn images were acquired every 15–30 minutes for the next 8 hours with the Mylar window removed between each image acquisition to allow immune responses to progress naturally.
The immune response of skin tissue immediately following a burn is characterized by a rush fluid to the sight of injury resulting in both the burn and surrounding area to becoming edematous. The image acquired 10 minutes after application of the brand (top right of Fig. 15) shows an acute influx of water throughout the region with non-burned areas reflecting as much incident THz radiation as burned areas. At 1 hour post burn, the response has organized, and the zone of increased water concentration begins to localize to the region where the brand contacted the skin, as seen in the bottom left of Fig. 15. Finally, after 7 hours the edema has localized completely to the brand contact area and the surrounding skin has returned to normal, non-burned reflectivity. Additionally a dark, low reflectivity ring of tissue is seen along the periphery of the hyper-hydrated brand contact area.
Burn wound pathophysiology is divided into three concentric regions [134]. These are the zones of coagulation, stasis, and hyperemia. The zone of coagulation (hyper-perfused) is at the center of the burn and contains irreversibly damaged cells and denatured protein. The zone of stasis surrounds the zone of coagulation and contains hypo-perfused tissue. The zone of hyperemia forms the outer ring and is characterized by edematous, hyper-perfused tissues. Burn wound progression is the process by which potentially salvageable tissues in the zones of stasis and hyperemia necrose, resulting in larger and deeper burns than were present upon initial presentation [127], [134]. Concomitant with the appearance of these three zones are large fluid shifts both locally and systemically. Investigations into these fluid shifts have concluded that local water concentration can increase by as much as 80% within 10 minutes of injury, and that this response is proportional to the depth of injury [135], [136].
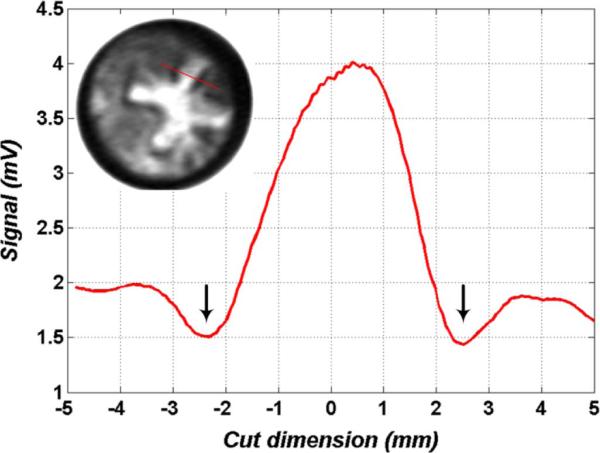
Given the large shifts in location and intensity of the observed THz reflectivity, we believe that we are observing the formation and evolution of the zone of coagulation (high reflectivity center of the burn) and zone of stasis (ring of low reflecting tissue surrounding the highly reflective center). Fig. 16 displays a cut through the upper right arm of the ‘+’ brand and confirms a significant increase in reflectivity (hydration) in the burn wound center and a significant drop in skin reflectivity (denoted by the black arrows) in the surrounding tissue. The zone of stasis displays a reflectivity of ~4.4% and is below the reflectivity of normal skin. To our knowledge this is the first time that the zone of stasis has been imaged in vivo with THz imaging technology. Further studies are underway to verify these observations with histopathology and to correlate the existence and shape of the different zones with burn wound severity.
Fig. 16.
Cut of pixel intensity across one arm of the ‘+’ burn (location shown in the figure inset). Pixel values are raw signal from the gated receiver prior to the LNA. Downward pointing arrows indicate dark poorly reflecting areas surrounding the bright contact area. This correlates with hyper-perfused skin; suspected to be the zone of stasis.
VII. Corneal Hydration Imaging
A. Motivation
The normal water content of the cornea is closely related to its transparency and refractive capabilities, and many diseases of the eye may measurably perturb it. Some, such as edema and corneal dystrophy, are diseases defined by the deterioration of the cornea's water-regulating process [137]–[139]. Others, such as keratoconus, have poorly understood mechanics, yet have been observed to exhibit non-uniform changes in water concentration of the cornea [140]. The hydration of the cornea can also be perturbed by medical procedures such as LASIK or corneal graft surgery [141]. In LASIK, tissue ablation rates are strongly linked to corneal hydration and errors in the measurement of tissue hydration are often responsible for surgical over-correction [142]–[146]. In corneal graft surgeries, immune rejection is preceded by the formation of edema and the reversibility of rejection events tend to diminish with abnormal increases in hydration [141]. Furthermore, the survival rate of rejected grafts gnereally improves the earlier the formation of edema is detected.
Currently available practice limits the in vivo measurement of corneal hydration to extrapolation using the central corneal thickness (CCT) measurements usually done with ultrasound or OCT-based pachymetry. These operate on the assumption of a linear relationship between CCT and the average water content of the eye [147]. This relationship was established in 1965 from the empirical fit of 11 healthy human corneas from a cornea bank and deviations of 20% or greater are seen in the data [148]. The linear fit of the hydration model predicts that a dehydrated cornea would have a thickness of 127 μm [148]; however the generally accepted thickness is ~200 μm. In other words, although the thickness measurement is extremely accurate (with axial resolution < 10 microns) the mapping from thickness to hydration is extremely inaccurate, thus severely limiting the utility of the technique. Furthermore pachymetry is a point measurement system, thus precluding the possibility of determining the spatial distribution of water in corneas.
Given the smooth surface of the cornea, its high water concentration by volume, and the near lossless properties of the collagen matrix, THz imaging/sensing may be ideally suited to directly measure corneal hydration in vivo, thus providing a clinical tool capable of earlier detection and more accurate monitoring of corneal disease.
B. Corneal Phantom Hydration
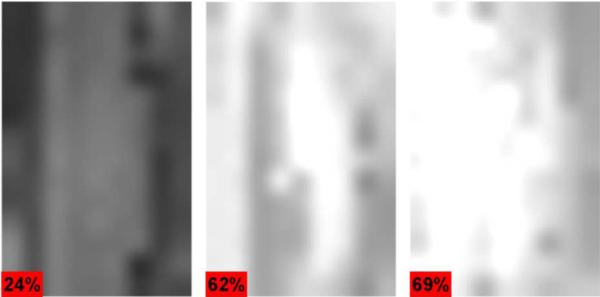
Contact lenses are exceptional corneal phantom materials because they hold their spherical shape well, have a manufacturer-provided water concentration that is easily verifiable with a high precision scale, and are fabricated with hydrogels yielding a matrix whose THz dielectric properties similar to that of the corneal collagen matrix. Three contact lenses from Acuvue Oasys [149], Coopervision Proclear [150], and CIbavision Dailies [151] were selected with water concentrations by volume of 24%, 62%, and 69% respectively. The contact lenses were placed on a 16 mm diameter Teflon ball chosen to match the average curvature of the human eye. The ball was mounted on a goniometer stage such that its center overlapped the virtual rotation point of the goniometer. This allowed the ball to be rotated beneath the THz imaging system while keeping the height and orientation of the surface constant, permitting scanning of ±10° in the horizontal direction and ±12° in the vertical direction (as defined by the orientation of Fig. 17.)
Fig. 17.
Contact lens images where the hydration profile has been mapped from a curve to area on target. Average reflectivity increases with hydration.
Fig. 17 shows the results of this imaging technique on contact lenses arranged from left to right in increasing water concentrations by volume of 24% (left), 62% (middle), and 69% (right) across the entire solid angle subtended by the goniometer. Each image displays a roughly uniform return signal across the scanned area and significant differences in THz reflectivity when compared to each other. The variation in the image is due largely to the imperfect rotation of the goniometer stage as well as the varying radial thickness of the contact lens. The overall reflectivity of the contact lens for each set follows the trend predicted with (5) and a difference signal SNR of ~20 dB was measured between the 62% and 69% hydrated contact lenses.
C. Ex Vivo Cornea
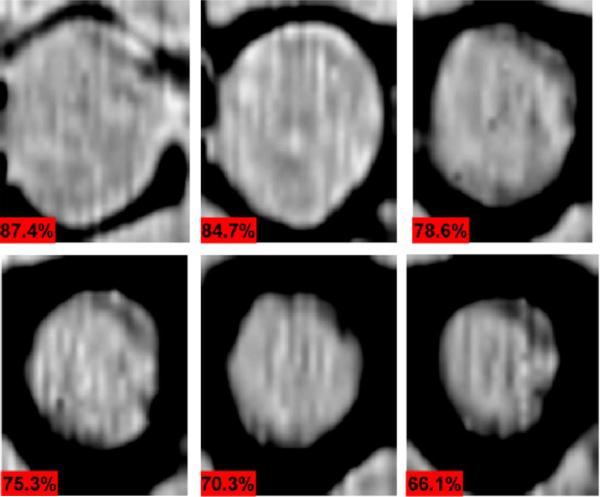
Changes in hydration in ex vivo porcine corneas were visualized by monitoring ex vivo corneas undergoing drying. The loss of water from the stroma (interior bulk of the cornea) of these samples causes the cornea to deform significantly from its ideal spherical shape. To remove geometry variations from the experiment, the cornea was mounted in a flat geometry by pressing it against a thin quartz window using a porous foam material thus permitting evaporation from the side opposing the quartz (in-depth details of the experiment can be found in [22]). Images of a 2 cm × 3 cm area were acquired at 8 minute intervals over the course of 5 hours. The results from selected time instances corresponding to 87%, 84%, 79%, 75%, 70%, and 66% average water concentration are shown in Fig. 18 with ~10 minutes elapsing between each image.
Fig. 18.
Time lapse imaging of drying porcine cornea with hydration by volume percentages denoted in the bottom left corner of each image. Reprinted from [22].
Each image is accompanied with its computed water concentration by volume calculated using sample mass measured between each image acquisition. Clear preferential drying from the outer edges is seen in the images, as the border closes further in towards the center with each subsequent frame. These edges suffer evaporative loss from the sides of the cornea in addition to losses from the epithelial (top) and endothelial (bottom) surfaces. The progression of drying from the outside-inward is the expected result due to the faster diffusion in the lateral directions relative to the thickness direction. The later is limited by the properties of the endothelial layer of the cornea which establishes a passive diffusion barrier to regulate the passage of water into the cornea [152], [153]. This is also in agreement with observations from a previous preliminary study in which a single cornea was imaged at a one point in time without constraint to its geometry [154].
These results in addition to recently published data [22] suggest that reflective THz imaging can be successfully applied to cornea using water as the dominant contrast mechanism and may provide hydration sensitivity superior to other ophthalmo-logic diagnostic systems.
VIII. Further Remarks and Conclusions
Two topics not adequately discussed in the literature are image generation methodology and pixel/image acquisition time. Almost all THz medical imaging systems in the literature (including the one in this paper) raster scan a target beneath a fixed THz beam and results obtained with fixed targets are rare. These techniques are sufficient for scanning of in vitro or ex vivo samples and for in vivo animal trials on small species, but they do not scale well to large animals such as pigs and definitely do not translate well to humans.
As THz imaging moves from the laboratory to the clinic, an important aspect of system design that will need addressing is acquisition time. A clinician most likely will always ask how long it takes to create an image for a given area. For a thought experiment, consider a 50 × 50 mm (approximate size of the palm of the hand) area scanned with 0.5 mm × 0.5 mm (~600 GHz 1/e diffraction limited spot size with f/1 optics) pixels producing a 100 × 100 pixel image. Assuming a pixel acquisition time of ~1 ms (in the realm of pixel acquisition times reported for this system, time domain systems, and FMCW systems) this corresponds to a total dwell time of only 10 seconds and requires an average source or target translation speed of <500 mm/s and acceleration rates into the meters per second. It is not likely that of humans and/or sensitive optical alignments will tolerate these speeds.
Compact, high powered, flood illumination sources and sensitive, dense focal plane arrays may resolve this problem but these advances seem to be at minimum a few years away. Given these facts it appears that THz medical imaging will be performed by single pixel, whisk broom systems for the foreseeable future and that researchers will have to address these problems to challenges to gain further acceptance from the medical community.
While great strides have been made over the past decade in THz generation, THz detection, and THz imaging, acceptance by the medical community and further inclusion of clinicians is key to the advancement of the field of THz medical imaging. Continuing improvements to sources, detectors, and components in terms of size, price, and ease of use facilitate the construction of low cost, compact, and robust systems and systems with these attributes are necessary for moving THz medical imaging from the engineering lab to the clinic.
Acknowledgment
The authors would like to thank Dr. Arttu Luukanen at Millilab for illuminating discussions on THz security imaging and its phenomenological similarities to medical imaging. The authors would also like to thank Dr. Erich Grossman at NIST for help in off-axis parabolic modeling. Thanks are also in order for Dr. Jon Bjarnason whose Ph.D. work in THz spectroscopy formed the basis of much of the work presented in this paper.
This work was supported in part by the National Science Foundation under Grant ECCS-801897. This work was also based in part upon work supported in part by the Telemedicine and Advanced Funding provided by the Telemedicine and Advanced Technology Research Center (TATRC)/Department of Defense under Award W81XWH-09-2001. Any opinions, findings, and conclusions or recommendations expressed in this material are those of the authors and do not necessarily reflect the views of the National Science Foundation.
Biography
 Zachary D. Taylor (S'06–M'09) is a postdoctoral scholar in the Department of Bioengineering at University of California, Los Angeles. Dr. Taylor received the B.S. degree in electrical engineering from the UCLA, Los Angeles, CA in 2004 and the M.S. and Ph.D. in electrical engineering from UCSB, Santa Barbara, CA in 2006 and 2009 respectively.
He is currently conducting biomedical THz imaging research in collaboration with the departments of Neurosurgery, Neuropathology, Pathology, General surgery, and Ophthalmology at the UCLA David Geffen School of Medicine. Additionally, he is working on THz system design, THz optics design, and image processing techniques to improve THz image acquisition rates.
 Rahul S. Singh (M'06) received the B.Scs. degree in electrical engineering and mathematics from Southern Methodist University, Dallas, TX, in 1997, and the M.S. and Ph.D. degrees in electrical engineering from the University of California at Los Angeles (UCLA), in 1999 and 2005, respectively.
From 2005 to 2007, he was a Postdoctoral Fellow in the Electrical and Computer Engineering Department, University of California at Santa Barbara. Since 2007, he has been a professional researcher at UCSB and an Assistant Professional Researcher in the Departments of Surgery, at UCLA. HIs current interests include RF systems and integration, biomedical ultrasound including both hard tissues (dental) and soft tissues, and terahertz imaging.
 David B. Bennett (S'11) received the B.S. degree in physics from UC Santa Barbara and the M.S. Degree from UC Los Angeles in biomedical physics. He is currently investigating THz sensing technologies for medical applications and completing his Ph.D. degree in electrical engineering at UC Los Angeles. His active research interests include advanced medical sensors, devices, and imaging technologies.
 Priyamvada Tewari received the B.S. and M.S. (Integrated Honors) in biophysics from Panjab University in 2006. She was awarded the university gold medal and S. R. Bawa scholarship for excellence in academics. She started the graduate program in Biomedical Engineering at UCLA in 2006 and since then has been pursuing Ph.D. under Dr. Warren Grundfest. The topic of her research is Terahertz imaging for early detection of skin disorders and pathologies including cancer, burns, and hydration. The project is funded by the National Science Foundation.
 Colin P. Kealey is a general surgery resident in the David Geffen School of Medicine, at University of California, Los Angeles. Dr. Kealey received the B.S. degree in biochemistry from the University of Madison Wisconsin and the M.D. from the Carver College of Medicine, University of Iowa, in 2002 and 2007 respectively. His current research interests include vascular stent design and characterization, and THz imaging for burn wound assessment.
 Neha Bajwa received the B.S. degree in biomedical engineering from Johns Hopkins University with a concentration in cell tissue engineering in 2008. She completed her M.S. degree at UC Los Angeles in biomedical engineering in 2010, and has focused her research on THz imaging for diagnostic applications in cornea and burn models. Additionally, she is investigating THz imaging for cancer margin detection and fusing THz burn data with MRI imagery. She is currently working to complete the Ph.D. degree in biomedical engineering at UC Los Angeles.
 Martin O. Culjat (M'07) received the B.S. degree in bioengineering from the University of California, San Diego, in 2000, and the M.S. and Ph.D. degrees in biomedical engineering from University of California, Los Angeles (UCLA), Los Angeles, in 2002 and 2005, respectively.
From 2005 to 2007, he was a Postdoctoral Fellow in the Department of Surgery, UCLA. Since 2006, he has been the Engineering Research Director of the Center for Advanced Surgical and Interventional Technology (CASIT), Los Angeles, where he is currently an Assistant Professional Researcher in the Departments of Bioengineering and Surgery, UCLA. He is also an Adjunct Assistant Professor in the Department of Electrical and Computer Engineering, University of California, Santa Barbara (UCSB), Santa Barbara. His current research interests include ultrasound transducers and imaging, terahertz imaging, image-guided surgical systems, interventional and minimally invasive surgical devices, and surgical robotics.
 Alexander Stojadinovic is a Distinguished Military Graduate of the United States Military Academy, Class of 1987. He earned his M.D. degree from the Uniformed Services University of the Health Sciences (USUHS) in 1991 and trained in General Surgery at Walter Reed Army Medical Center (WRAMC; 1991–1997). He completed sub-specialty training in Surgical Oncology at Memorial Sloan Kettering Cancer Center (1999–2001), and is a Fellow of the American College of Surgeons. COL Stojadinovic has served as Vice Chairman and Principal Investigator for the Department Surgery at Walter Reed Army Medical Center as well as Program Leader, Gastrointestinal Cancer Program, United States Military Cancer Institute. He is an Associate Professor of Surgery at the Uniformed Services University of the Health Sciences and the recipient of the United States Army Surgeon General's “A” Proficiency Designator for academic excellence, and the U.S. Army Medical Department Regiment's Order of Military Medical Merit. COL Stojadinovic is the Director of the Congressionally-directed translational research program, the Combat Wound Initiative, as well as the Complex Wound and Limb Salvage Center at WRAMC, providing state-of-the-art complex wound care through targeted clinical and translational research incorporating advanced technology and treatment, tissue banking, and bioinformatics.
 Hua Lee (S'78–M'80–SM'83–F'92) received his Ph.D. degree from UC Santa Barbara in 1980. Prior to his return to UCSB in 1990, he was on the faculty of the University of Illinois at Urbana-Champaign. His research interests cover the areas of imaging system optimization, high-performance image formation algorithms, synthetic-aperture radar and sonar systems, acoustic microscopy, microwave nondestructive evaluation, and dynamic vision systems. His research laboratory was the first to produce the holographic and tomographic reconstructions from a scanning laser acoustic microscope, and his research team is also known as the leader in pulse-echo microwave nondestructive evaluation of civil structures and materials. Professor Lee served as the Chairman of the 18th International Symposium on Acoustical Imaging in 1989 and the 13th International Workshop on Maximum Entropy and Bayesian Methods in 1993. From 1988 to 1994, he served as Editor of the International J. Imaging Systems and Technology. He also served as an Associate Editor of IEEE Transactions on Circuits and Systems for Video Technology from 1992 to 1995, and Associate Editor of IEEE Transactions on Image Processing from 1994 to 1996.
Prof. Lee is a Fellow of IEEE and the Acoustical Society of America. In 1985, he received the Presidential Young Investigator Award from the National Science Foundation for his work in imaging system optimization. He was elected Professor of the Year in 1992 by the Mortar Board National Honor Society. Dr. Lee was also given the Nineteenth Pattern Recognition Society Award in 1993.
 Jean Pierre Hubschman trained in ophthalmology at the Hopital La Timone in Marseille France from 1991 to 1996 and received his M.D. degree from Aix-Marseille University in France in 1996. He did a Fellowship in vitreo-retinal surgery from 1996 to 1998 and then headed the Retina department of the Ophthalmologic Center of Saint Jean de Luz—France, the Policlinique Aguilera Biar-ritz—France and the Policlinica Guipozcoa San Sebastian—Spain. In 2007 Jean-Pierre Hubschman joined the Retina division of the Jules Stein Eye Institute at UCLA as an Assistant Professor of Ophthalmology.
His current research interests include development of minimally invasive surgical tools and techniques, surgical robotic systems, and ocular imaging technologies.
Dr. Hubschman is a member of the American Research Society in Ophthalmology, the European Research Society in Ophthalmology and Vision, and the American Society of Cataract and Refractive Surgery.
 Elliott R. Brown (M'92–SM'97–F'00) is a Professor of Physics and Electrical Engineering at Wright State University where he holds the Ohio Research Scholars Endowed Chair in Sensors Physics. He is conducting research and teaching courses in RF and THz sensor science and technology, and in solid-state physics and engineering. His THz research encompasses several topics including ultra-low-noise rectifiers, photomixing sources, the THz phenomenology of biomaterials, and THz remote sensor and imager design and simulation.
Other areas of research include multifunctional RF electronics and systems, biomedical ultrasonic imaging in and around hard tissue (in collaboration with the UCLA Medical and Dental Schools), and electronic and photonic transport in nanostructures. Prior to WSU Dr. Brown was a Professor of Electrical and Computer Engineering at the University of California, (Santa Barbara and Los Angeles campuses), and prior to that was a Program Manager at DARPA in the Electronics Technology Office, Arlington, VA. He earned a Ph.D. in applied physics from the California Institute of Technology in 1985, and did his postdoctoral work at Lincoln Laboratory, Massachusetts Institute of Technology. Dr. Brown is a Fellow of the IEEE (since 2000) and a Fellow of the American Physical Society (since 2007). In 1998 he received an Award for Outstanding Achievement from the U.S. Office of the Secretary of Defense
 Warren S. Grundfest received his M.D. degree from Columbia University, College of Physicians & Surgeons (New York City, NY), in 1980 and trained in General Surgery at UCLA and Cedars-Sinai Medical Center in 1985 (Los Angeles, CA).
He is a Professor of Bioengineering at the UCLA (Los Angeles, CA). He is also a Professor of Electrical Engineering and Professor of Surgery at UCLA. His current research interests include excimer lasers for medical applications, optical diagnostic procedures, minimally invasive surgical tools, haptic feedback and ultrasound imaging.
Dr. Grundfest was elected Fellow, American Institute of Medical & Biologic Engineers (AIMBE), for pioneering development and dissemination of minimally invasive surgery in 1996. In the same year he was elected Fellow, Society of Photo-Optical Instrumentation Engineers (SPIE), for his distinguished and valuable contributions to the field of optical engineering in medicine and biology.
Contributor Information
Zachary D. Taylor, Department of Bioengineering and the Center for Advanced Surgical and Interventional Technology (CASIT), University of California at Los Angeles, Los Angeles, CA 90095 USA (zdeis@seas.ucla.edu)..
Rahul S. Singh, Department of Bioengineering, Department of Surgery, and the Center for Advanced Surgical and Interventional Technology (CASIT), University of California at Los Angeles, Los Angeles, CA 90095 USA..
David B. Bennett, Department of Electrical Engineering and the Center for Advanced Surgical and Interventional Technology (CASIT), University of California at Los Angeles, Los Angeles, CA 90095 USA..
Priyamvada Tewari, Department of Bioengineering and the Center for Advanced Surgical and Interventional Technology (CASIT), University of California at Los Angeles, Los Angeles, CA 90095 USA.
Colin P. Kealey, Department of Surgery and the Center for Advanced Surgical and Interventional Technology (CASIT), University of California at Los Angeles, Los Angeles, CA 90095 USA.
Neha Bajwa, Department of Bioengineering and the Center for Advanced Surgical and Interventional Technology (CASIT), University of California at Los Angeles, Los Angeles, CA 90095 USA.
Martin O. Culjat, Department of Bioengineering, Department of Surgery, and the Center for Advanced Surgical and Interventional Technology (CASIT), University of California at Los Angeles, Los Angeles, CA 90095 USA..
Alexander Stojadinovic, Department of Surgery, Walter Reed Army Medical Center and the Combat Wound Initiative Program, Washington, DC 20307 USA..
Hua Lee, Department of Electrical and Computer Engineering, University of California at Santa Barbara, Santa Barbara, CA 93106 USA..
Jean-Pierre Hubschman, Department of Ophthalmology, University of California at Los Angeles, Los Angeles, CA 90095 USA..
Elliott R. Brown, Department of Physics, Wright State University, Dayton, OH 45435 USA..
Warren S. Grundfest, Department of Electrical Engineering, Department of Bioengineering, Department of Surgery, and the Center for Advanced Surgical and Interventional Technology (CASIT), University of California at Los Angeles, Los Angeles, CA 90095 USA.
References
- 1.Siegel PH. Terahertz technology. IEEE Trans. Microw. Theory Tech. 2002;50:910–928. [Google Scholar]
- 2.Mittleman DM, Gupta M, Neelamani R, Baraniuk RG, Rudd JV, Koch M. Recent advances in terahertz imaging. Appl. Phys. B: Lasers and Optics. 1999;68:1085–1094. [Google Scholar]
- 3.Pickwell E, Cole BE, Fitzgerald AJ, Pepper M, Wallace VP. In vivo study of human skin using pulsed terahertz radiation. Phys. Med. Biol. 2004;49:1595. doi: 10.1088/0031-9155/49/9/001. [DOI] [PubMed] [Google Scholar]
- 4.Pickwell E, Cole BE, Fitzgerald AJ, Wallace VP, Pepper M. Simulation of terahertz pulse propagation in biological systems. Appl. Phys. Lett. 2004;84:2190–2192. [Google Scholar]
- 5.Woodward RM, Cole BE, Wallace VP, Pye RJ, Arnone DD, Linfield EH, Pepper M. Terahertz pulse imaging in reflection geometry of human skin cancer and skin tissue. Phys. Med. Biol. 2002;47:3853. doi: 10.1088/0031-9155/47/21/325. [DOI] [PubMed] [Google Scholar]
- 6.Woodward RM, Wallace VP, Cole BE, Pye RJ, Arnone DD, Linfield EH, Pepper M. Proc. SPIE. San Jose, CA: 2002. Terahertz pulse imaging in reflection geometry of skin tissue using time-domain analysis techniques; pp. 160–169. [DOI] [PubMed] [Google Scholar]
- 7.Woodward RM, Wallace VP, Pye RJ, Cole BE, Arnone DD, Linfield EH, Pepper M. Terahertz pulse imaging of ex vivo basal cell carcinoma. J. Investig. Dermatol. 2003;120:72–78. doi: 10.1046/j.1523-1747.2003.12013.x. [DOI] [PubMed] [Google Scholar]
- 8.Woodward RM, Cole B, Wallace VP, Arnone DD, Pye R, Linfield EH, Pepper M, Davies AG. Terahertz pulse imaging of in-vitro basal cell carcinoma samples. CLEO'01 Tech. Dig. 2001:329–330. [Google Scholar]
- 9.Wallace VP, Fitzgerald AJ, Shankar S, Flanagan N, Pye R, Cluff J, Arnone DD. Terahertz pulsed imaging of basal cell carcinoma ex vivo and in vivo. British J. Dermatol. 2004;151:424–432. doi: 10.1111/j.1365-2133.2004.06129.x. [DOI] [PubMed] [Google Scholar]
- 10.Woodward RM, Wallace VP, Arnone DD, Linfield EH, Pepper M. Terahertz pulsed imaging of skin cancer in the time and frequency domain. J. Biol. Phys. 2003;29:257–259. doi: 10.1023/A:1024409329416. [DOI] [PMC free article] [PubMed] [Google Scholar]
- 11.Brown ER, Taylor ZD, Tewari P, Singh RS, Culjat MO, Bennett DB, Grundfest WS. THz imaging of skin tissue; exploiting the strong reflectivity of liquid water. 35th Int. Conf. Infrared Millimeter and Terahertz Waves (IRMMW-THz) 2010:1–2. [Google Scholar]
- 12.Pickwell E, Wallace VP. Biomedical applications of terahertz technology. J. Phys. D: Appl. Phys. 2006;39:R301. [Google Scholar]
- 13.Fitzgerald AJ, Wallace VP, Pye R, Jimenez-Linan M, Bobrow L, Purushotham AD, Arnone DD. Terahertz imaging of breast cancer, a feasibility study. Conf. Dig. 2004 Joint 29th Int. Conf. Infrared and Millimeter Waves and 12th Int. Conf. Terahertz Electronics. 2004:823–824. [Google Scholar]
- 14.Fitzgerald AJ, Wallace VP, Jimenez-Linan M, Bobrow L, Pye RJ, Purushotham AD, Arnone DD. Terahertz pulsed imaging of human breast tumors. Radiology. 2006 May;239:533–540. doi: 10.1148/radiol.2392041315. [DOI] [PubMed] [Google Scholar]
- 15.Ashworth PC, Pickwell-MacPherson E, Provenzano E, Pinder SE, Purushotham AD, Pepper M, Wallace VP. Terahertz pulsed spectroscopy of freshly excised human breast cancer. Opt. Exp. 2009;17:12444–12454. doi: 10.1364/oe.17.012444. [DOI] [PubMed] [Google Scholar]
- 16.Arbab MH, Dickey TC, Winebrenner DP, Chen A, Mourad PD. SPIE Advanced Biomedical and Clinical Diagnostic Systems IX. San Francisco, CA: 2011. Characterization of burn injuries using terahertz time-domain spectroscopy; pp. 78900Q–7. [Google Scholar]
- 17.Huang SY, Macpherson E, Zhang YT. A feasibility study of burn wound depth assessment using terahertz pulsed imaging. Proc. 4th IEEE/EMBS Int. Summer School and Symp. Medical Devices and Biosensors (ISSS-MDBS 2007) 2007:132–135. [Google Scholar]
- 18.Taylor ZD, Singh RS, Culjat MO, Suen JY, Grundfest WS, Lee H, Brown ER. Reflective terahertz imaging of porcine skin burns. Opt. Lett. 2008;33:1258–1260. doi: 10.1364/ol.33.001258. [DOI] [PubMed] [Google Scholar]
- 19.Dougherty JP, Jubic GD, Kiser JWL. Terahertz Imaging of Burned Tissue. San Jose, CA: 2007. pp. 64720N–9. [Google Scholar]
- 20.T. P., Suen JY, Taylor ZD, Grundfest WS, Lee H, Brown ER, Culjat MO, Singh RS. Proc. MMVR. Long Beach, CA: 2009. Towards medical terahertz sensing of skin hydration; pp. 364–368. [PubMed] [Google Scholar]
- 21.Bennett DB, Li W, Taylor ZD, Grundfest WS, Brown ER. Stratified media model for terahertz reflectometry of the skin. IEEE Sensors J. 2010;11:1530–437X. [Google Scholar]
- 22.Bennett DB, Taylor ZD, Sassoon D, Tewari P, Johnson RD, Singh R, Culjat MO, Hubschman J-P, Grundfest WS. Terahertz sensing in corneal tissues. J. Biomed. Opt. 2010;16:8. doi: 10.1117/1.3575168. [DOI] [PMC free article] [PubMed] [Google Scholar]
- 23.Singh RS, Tewari P, Bourges JL, Hubschman JP, Bennett DB, Taylor ZD, Lee H, Brown ER, Grundfest WS, Culjat MO. Terahertz sensing of corneal hydration. Proc. 2010 Annu. Int. Conf. IEEE Engineering in Medicine and Biology Society (EMBC) 2010:3021–3024. doi: 10.1109/IEMBS.2010.5626146. [DOI] [PubMed] [Google Scholar]
- 24.Bennett ZDTDB, Sung S, Bajwa N, Makkabi B, Singh RS, Tewari P, Culjat MO, Grundfest WS, Brown ER. Terahertz time-lapse video of hydration in physiological tissues. presented at the SPIE BiOS; San Francisco, CA. 2011. [Google Scholar]
- 25.Pickwell E, Wallace VP. Biomedical applications of terahertz technology. J. Phys. D: Appl. Phys. 2006;39:R301–R310. [Google Scholar]
- 26.Dougherty J, Jubic G, Kisler W. Terahertz imaging of burned tissue. Proc. SPIE, Terahertz and Gigahertz Electronics and Photonics VI. 2007:64720N. [Google Scholar]
- 27.Mittleman D. Terahertz imaging. Springer Series in Optical Sciences. 2002;86:117. [Google Scholar]
- 28.Woodward RM, Wallace VP, Pye RJ, Cole BE, Arnone DD, Linfield EH, Pepper M. Terahertz pulse imaging of ex vivo basal cell carcinoma. J. Invest. Dermatol. 2003 Jan.120:72–78. doi: 10.1046/j.1523-1747.2003.12013.x. [DOI] [PubMed] [Google Scholar]
- 29.Berry E, Handley JW, Fitzgerald AJ, Merchant WJ, Boyle RD, Zinov'ev NN, Miles RE, Chamberlain JM, Smith MA. Multispectral classification techniques for terahertz pulsed imaging: An example in histopathology. Med. Eng. Phys. 2004 Jun.26:423–430. doi: 10.1016/j.medengphy.2004.02.011. [DOI] [PubMed] [Google Scholar]
- 30.Woodward RM, Cole BE, Wallace VP, Pye RJ, Arnone DD, Linfield EH, Pepper M. Terahertz pulse imaging in reflection geometry of human skin cancer and skin tissue. Phys. Med. Biol. 2002 Nov.47:3853–3863. doi: 10.1088/0031-9155/47/21/325. [DOI] [PubMed] [Google Scholar]
- 31.Wallace VP, Fitzgerald AJ, Shankar S, Flanagan N, Pye R, Cluff J, Arnone DD. Terahertz pulsed imaging of basal cell carcinoma ex vivo and in vivo. Br. J. Dermatol. 2004 Aug.151:424–432. doi: 10.1111/j.1365-2133.2004.06129.x. [DOI] [PubMed] [Google Scholar]
- 32.Tonouchi M. Cutting-edge terahertz technology. Nature Photon. 2007;1:97–105. [Google Scholar]
- 33.Ferguson B, Zhang X-C. Materials for terahertz science and technology. Nature Mater. 2002;1:26–33. doi: 10.1038/nmat708. [DOI] [PubMed] [Google Scholar]
- 34.Son J-H. Terahertz electromagnetic interactions with biological matter and their applications. J. Appl. Phys. 2009;105:102033–102033-10. [Google Scholar]
- 35.Arnone D, Ciesla C, Pepper M. Terahertz imaging comes into view. Phys. World. 2000:35–40. [Google Scholar]
- 36.Siegel PH. Terahertz technology in biology and medicine. IEEE Trans. Microw. Theory Tech. 2004;52:2438–2447. [Google Scholar]
- 37.Globus TR, Woolard DL, Khromova T, Crowe TW, Bykhovskaia M, Gelmont BL, Hesler J, Samuels AC. THz-spectroscopy of biological molecules. J. Biol. Phys. 2003;29:89–100. doi: 10.1023/A:1024420104400. [DOI] [PMC free article] [PubMed] [Google Scholar]
- 38. [Online]. Available: http://report.nih.gov/(3-15-2011)
- 39.Ward J, Schlecht E, Chattopadhyay G, Maestrini A, Gill J, Maiwald F, Javadi H, Mehdi I. Capability of THz sources based on Schottky diode frequency multiplier chains. 2004 IEEE MTT-S Int. Microwave Symp. Dig. 2004;3:1587–1590. [Google Scholar]
- 40.Suen JY, Li W, Taylor ZD, Brown ER. Characterization and modeling of a terahertz photoconductive switch. Appl. Phys. Lett. 2010;96:141103–141103-3. [Google Scholar]
- 41.Bjarnason JE, Chan TLJ, Lee AWM, Brown ER, Driscoll DC, Hanson M, Gossard AC, Muller RE. ErAs:GaAs photomixer with two-decade tunability and 12 uW peak output power. Appl. Phys. Lett. 2004;85:3983–3985. [Google Scholar]
- 42.Auston D. Impulse response of photoconductors in transmission lines. IEEE J. Quantum Electron. 1983;19:639–648. [Google Scholar]
- 43.Brown ER, McIntosh KA, Nichols KB, Dennis CL. Photomixing up to 3.8 THz in low temperature grown GaAs. Appl. Phys. Lett. 1995;66:285–287. [Google Scholar]
- 44.Auston DH. Picosecond optoelectronic switching and gating in silicon. Appl. Phys. Lett. 1975;26:101–103. [Google Scholar]
- 45.Taylor ZD, Brown ER, Bjarnason JE, Hanson MP, Gossard AC. Resonant-optical-cavity photoconductive switch with 0.5% conversion efficiency and 1.0 W peak power. Opt. Lett. 2006;31:1729–1731. doi: 10.1364/ol.31.001729. [DOI] [PubMed] [Google Scholar]
- 46.Smith PR, Auston DH, Nuss MC. Subpicosecond photoconducting dipole antennas. IEEE J. Quantum Electron. 1988;24:255–260. [Google Scholar]
- 47.Williams KK, Taylor ZD, Suen JY, Lu H, Singh RS, Gossard AC, Brown ER. Toward a 1550 nm InGaAs photoconductive switch for terahertz generation. Opt. Lett. 2009;34:3068–3070. doi: 10.1364/OL.34.003068. [DOI] [PubMed] [Google Scholar]
- 48.Wu Q, Litz M, Zhang XC. Broadband detection capability of ZnTe electro-optic field detectors. Appl. Phys. Lett. 1996;68:2924–2926. [Google Scholar]
- 49.Wu Q, Zhang XC. Free-space electro-optic sampling of terahertz beams. Appl. Phys. Lett. 1995;67:3523–3525. [Google Scholar]
- 50. [Online]. Available: http://vadiodes.com/index.php?option=com_content&view=article&id=12&Itemid=3.
- 51.Hu BB, Nuss MC. Imaging with terahertz waves. Opt. Lett. 1995;20:1716–1718. doi: 10.1364/ol.20.001716. [DOI] [PubMed] [Google Scholar]
- 52.Arnone DD, Ciesla CM, Corchia A, Egusa S, Pepper M, Chamberlain JM, Bezant C, Linfield EH, Clothier R, Khammo N. Applications of Terahertz (THz) Technology to Medical Imaging. Munich, Germany: 1999. pp. 209–219. [Google Scholar]
- 53.L?ffler T, Bauer T, Siebert K, Roskos H, Fitzgerald A, Czasch S. Terahertz dark-field imaging of biomedical tissue. Opt. Exp. 2001;9:616–621. doi: 10.1364/oe.9.000616. [DOI] [PubMed] [Google Scholar]
- 54.Han PY, Cho GC, Zhang XC. Time-domain transillumination of biological tissues with terahertz pulses. Opt. Lett. 2000;25:242–244. doi: 10.1364/ol.25.000242. [DOI] [PubMed] [Google Scholar]
- 55.Williams BS. Terahertz quantum-cascade lasers. Nature Photon. 2007;1:517–525. [Google Scholar]
- 56.Dobroiu A, Yamashita M, Ohshima YN, Morita Y, Otani C, Kawase K. Terahertz imaging system based on a backward-wave oscillator. Appl. Opt. 2004;43:5637–5646. doi: 10.1364/ao.43.005637. [DOI] [PubMed] [Google Scholar]
- 57.Yaroslavsky AN, Neel V, Anderson RR. Demarcation of nonmelanoma skin cancer margins in thick excisions using multispectral polarized light imaging. J. Investig. Dermatol. 2003;121:259–266. doi: 10.1046/j.1523-1747.2003.12372.x. [DOI] [PubMed] [Google Scholar]
- 58.Backman V, Wallace MB, Perelman LT, Arendt JT, Gurjar R, Muller MG, Zhang Q, Zonios G, Kline E, McGillican T, Shapshay S, Valdez T, Badizadegan K, Crawford JM, Fitzmaurice M, Kabani S, Levin HS, Seiler M, Dasari RR, Itzkan I, Van Dam J, Feld MS. Detection of preinvasive cancer cells. Nature. 2000;406:35–36. doi: 10.1038/35017638. [DOI] [PubMed] [Google Scholar]
- 59.Geller AC, Swetter SM, Brooks K, Demierre M-F, Yaroch AL. Screening, early detection, and trends for melanoma: Current status (2000–2006) and future directions. J. Am. Acad. Dermatol. 2007;57:555–572. doi: 10.1016/j.jaad.2007.06.032. [DOI] [PubMed] [Google Scholar]
- 60.Tewari P, Culjat MO, Taylor ZD, Suen JY, Burt BO, Lee H, Brown ER, Grundfest WS, Singh RS. Role of Collagen in Terahertz Absorption in Skin. San Jose, CA: 2009. pp. 71691A–8. [Google Scholar]
- 61.Nakajima S, Hoshina H, Yamashita M, Otani C, Miyoshi N. Terahertz imaging diagnostics of cancer tissues with a chemometrics technique. Appl. Phys. Lett. 2007;90:041102–N.PAG. [Google Scholar]
- 62.Ishikawa Y, Minamide H, Ikari T, Miura Y, Sawai T, Ito H. Terahertz spectroscopic imaging of liver cancer using ring cavity THz-wave parametric oscillator. Proc. Int. Quantum Electronics Conf. 2005:1236–1237. [Google Scholar]
- 63.Enatsu T, Kitahara H, Takano K, Nagashima T. Terahertz spectroscopic imaging of paraffin-embedded liver cancer samples. Joint 32nd Int. Conf. Infrared and Millimeter Waves and the 15th Int. Conf. Terahertz Electronics, IRMMW-THz. 2007:557–558. [Google Scholar]
- 64.Nishizawa J-I, Sasaki T, Suto K, Yamada T, Tanabe T, Tanno T, Sawai T, Miura Y. THz imaging of nucleobases and cancerous tissue using a GaP THz-wave generator. Opt. Commun. 2005;244:469–474. [Google Scholar]
- 65.Pickwell E, Wallace VP, Cole BE, Ali S, Longbottom C, Lynch RJM, Pepper M. A comparison of terahertz pulsed imaging with transmission microradiography for depth measurement of enamel demineralisation in vitro. Caries Res. 2007;41:49–55. doi: 10.1159/000096105. [DOI] [PubMed] [Google Scholar]
- 66.Pickwell-MacPherson E, Wallace VP. Terahertz pulsed imaging—A potential medical imaging modality? Photodiagnosis and Photodynamic Therapy. 2009;6:128–134. doi: 10.1016/j.pdpdt.2009.07.002. [DOI] [PubMed] [Google Scholar]
- 67.Hoshina H, Hayashi A, Miyoshi N, Fukunaga Y, Miyamaru F, Otani C. Terahertz pulsed imaging of frozen biological tissues. 34th Int. Conf. Infrared, Millimeter, and Terahertz Waves, IRMMW-THz. 2009:1–2. [Google Scholar]
- 68.Crawley DA, Longbottom C, Cole BE, Ciesla CM, Arnone D, Wallace VP, Pepper M. Terahertz pulse imaging: A pilot study of potential applications in dentistry. Caries Res. 2003;37:352–359. doi: 10.1159/000072167. [DOI] [PubMed] [Google Scholar]
- 69.Crawley D, Longbottom C, Wallace VP, Cole B, Arnone D, Pepper M. Three-dimensional terahertz pulse imaging of dental tissue. J. Biomed. Opt. 2003;8:303–307. doi: 10.1117/1.1559059. [DOI] [PubMed] [Google Scholar]
- 70.Wallace VP, Fitzgerald AJ, Pickwell E, Pye RJ, Taday PF, Flanagan N, Ha T. Terahertz pulsed spectroscopy of human basal cell carcinoma. Appl. Spectrosc. 2006;60:1127–1133. doi: 10.1366/000370206778664635. [DOI] [PubMed] [Google Scholar]
- 71.Clothier RH, Bourne N. Effects of THz exposure on human primary keratinocyte differentiation and viability. J. Biol. Phys. 2003;29:179–185. doi: 10.1023/A:1024492725782. [DOI] [PMC free article] [PubMed] [Google Scholar]
- 72.Zhao G, Schouten RN, van der Valk N, Wenckebach WT, Planken PCM. Design and performance of a THz emission and detection setup based on a semi-insulating GaAs emitter. Rev. Sci. Instrum. 2002;73:1715. [Google Scholar]
- 73.ScarfÌ MR, RomanÒ M, Di Pietro R, Zeni O, Doria A, Gallerano GP, Giovenale E, Messina G, Lai A, Campurra G, Coniglio D, D'Arienzo M. THz exposure of whole blood for the study of biological effects on human lymphocytes. J. Biol. Phys. 2003;29:171–176. doi: 10.1023/A:1024440708943. [DOI] [PMC free article] [PubMed] [Google Scholar]
- 74.Doria A, Gallerano GP, Giovenale E, Messina G, Lai A, Ramundo-Orlando A, Sposato V, D'Arienzo M, Perrotta A, Romanò M, Sarti M, Scarfì MR, Spassovsky I, Zeni O. THz radiation studies on biological systems at the ENEA FEL facility. Infrared Phys. Technol. 2004;45:339–347. [Google Scholar]
- 75.Wilmink GJ, Rivest BD, Ibey BL, Roth CL, Bernhard J, Roach WP. SPIE Optical Interactions With Tissues and Cells XXI. San Francisco, CA: 2010. Quantitative investigation of the bioeffects associated with terahertz radiation; pp. 75620L–10. [Google Scholar]
- 76.Wilmink GJ, Rivest BD, Ibey BL, Roth CL, Bernhard J, Roach WP. Quantitative investigation of the bioeffects associated with terahertz radiation. Optical Interactions with Tissues and Cells XXI. 2010:75620L. [Google Scholar]
- 77.Wilmink GJ, Rivest BD, Ibey BL, Roth CL, Bernhard J, Roach WP. Quantitative investigation of the bioeffects associated with terahertz radiation. Optical Interactions With Tissues and Cells XXI. 2010:75620L. [Google Scholar]
- 78.Dalzell DR, McQuade J, Vincelette R, Ibey B, Payne J, Thomas R, Roach WP, Roth CL, Wilmink GJ. Optical Interactions With Tissues and Cells XXI. San Francisco, CA: 2010. Damage thresholds for terahertz radiation; pp. 75620M–8. [Google Scholar]
- 79.Freitas RA. Nanomedicine volume I. Landes Bioscience. 1999:164. [Google Scholar]
- 80.Manchester JPT. Hydration of the cornea. Trans. Am. Ophthalmol. Soc. 1970;68:427–461. [PMC free article] [PubMed] [Google Scholar]
- 81.Warner RR, Myers MC, Taylor DA. Electron probe analysis of human skin: Determination of the water concentration profile. J. Investig. Dermatol. 1988;90:218–224. doi: 10.1111/1523-1747.ep12462252. [DOI] [PubMed] [Google Scholar]
- 82.Xu J, Plaxco KW, Allen SJ, Bjarnason JE, Brown ER. 0.15–3.72 THz absorption of aqueous salts and saline solutions. Appl. Phys. Lett. 2007;90:031908–031908-3. [Google Scholar]
- 83.Meissner T, Wentz FJ. The complex dielectric constant of pure and sea water from microwave satellite observations. IEEE Trans. Geosci. Remote Sens. 2004;42:1836–1849. [Google Scholar]
- 84.Kindt JT, Schmuttenmaer CA. Far-infrared dielectric properties of polar liquids probed by femtosecond terahertz pulse spectroscopy†. J. Phys. Chem. 1996;100:10373–10379. [Google Scholar]
- 85.Ronne C, Thrane L, Astrand P-O, Wallqvist A, Mikkelsen KV, Keiding SR. Investigation of the temperature dependence of dielectric relaxation in liquid water by THz reflection spectroscopy and molecular dynamics simulation. J. Chem. Phys. 1997;107:5319–5331. [Google Scholar]
- 86.Rønne C, Keiding SR. Low frequency spectroscopy of liquid water using THz-time domain spectroscopy. J. Molecular Liquids. 2002;101:199–218. [Google Scholar]
- 87.Liebe HJ, Hufford GA, Manabe T. A model for the complex permittivity of water at frequencies below 1 THz. Int. J. Infrared and Millimeter Waves. 1991;12:659–675. [Google Scholar]
- 88.Thrane L, Jacobsen RH, Jepsen PU, Keiding SR. THz reflection spectroscopy of liquid water. Chem. Phys. Lett. 1995;240:330–333. [Google Scholar]
- 89.Rosker MJ, Wallace HB. Imaging through the atmosphere at terahertz frequencies. IEEE/MTT-S Int. Microwave Symp. Dig. 2007:773–776. [Google Scholar]
- 90.Exter MV, Fattinger C, Grischkowsky D. Terahertz time-domain spectroscopy of water vapor. Opt. Lett. 1989;14:1128–1130. doi: 10.1364/ol.14.001128. [DOI] [PubMed] [Google Scholar]
- 91.Karkkainen KK, Sihvola AH, Nikoskinen KI. Effective permittivity of mixtures: Numerical validation by the FDTD method. IEEE Trans. Geosci. Remote Sens. 2000;38:1303–1308. [Google Scholar]
- 92.Niklasson GA, Granqvist CG, Hunderi O. Effective medium models for the optical properties of inhomogeneous materials. Appl. Opt. 1981;20:26–30. doi: 10.1364/AO.20.000026. [DOI] [PubMed] [Google Scholar]
- 93.Landauer R. Electrical conductivity in inhomogeneous media. AIP Conf. Proc. 1978;40:2–45. [Google Scholar]
- 94.Fischer BM, Walther M, Jepsen PU. Far-infrared vibrational modes of DNA components studied by terahertz time-domain spectroscopy. Phys. Med. Biol. 2002;47:3807. doi: 10.1088/0031-9155/47/21/319. [DOI] [PubMed] [Google Scholar]
- 95.Berry AJFE, Zinov'ev NN, Walker GC, Homer-Vanniasinkam S, Sudworth CD, Miles RE, Chamberlain JM, Smith MA. Optical properties of tissue measured using terahertz pulsed imaging. Proc. SPIE: Med. Imag. 2003:459–470. [Google Scholar]
- 96.Markelz AG, Roitberg A, Heilweil EJ. Pulsed terahertz spectroscopy of DNA, bovine serum albumin and collagen between 0.1 and 2.0 THz. Chem. Phys. Lett. 2000;320:42–48. [Google Scholar]
- 97.Sy S, Huang S, Wang Y-XJ, Yu J, Ahuja AT, Zhang Y-T, Pickwell-MacPherson E. Terahertz spectroscopy of liver cirrhosis: Investigating the origin of contrast. Phys. Med. Biol. 2010;55:7587. doi: 10.1088/0031-9155/55/24/013. [DOI] [PubMed] [Google Scholar]
- 98.Jackson WB, Amer NM. Direct measurement of gap-state absorption in hydrogenated amorphous silicon by photothermal deflection spectroscopy. Phys. Rev. B. 1982;25:5559. [Google Scholar]
- 99.Pickwell-MacPherson E. Practical considerations for in vivo THz imaging. Terahertz Science and Technology. 2010;3:163–171. [Google Scholar]
- 100.Brown ER. Fundamentals of terrestrial millimeter-wave and THz remote sensing. Int. J. High Speed Electronics and Systems (IJHSES) 2003;13:995–1097. 2003. [Google Scholar]
- 101.Doicu A, Wriedt T. Plane wave spectrum of electromagnetic beams. Opt. Commun. 1997;136:114–124. [Google Scholar]
- 102.Sancer M. Shadow-corrected electromagnetic scattering from a randomly rough surface. IEEE Trans. Antennas Propag. 1969;17:577–585. [Google Scholar]
- 103.Beckmann P, Spizzichino A. The Scattering of Electromagnetic Waves From Rough Surfaces. Artech House; Norwood, MA: p. 187. [Google Scholar]
- 104.Dikmelik Y, Spicer JB, Fitch MJ, Osiander R. Effects of surface roughness on reflection spectra obtained by terahertz time-domain spectroscopy. Opt. Lett. 2006;31:3653–3655. doi: 10.1364/ol.31.003653. [DOI] [PubMed] [Google Scholar]
- 105.Jördens C, Scheller M, Breitenstein B, Selmar D, Koch M. Evaluation of leaf water status by means of permittivity at terahertz frequencies. J. Biol. Phys. 2009;35:255–264. doi: 10.1007/s10867-009-9161-0. [DOI] [PMC free article] [PubMed] [Google Scholar]
- 106.Piesiewicz R, Jansen C, Mittleman D, Kleine-Ostmann T. Measurements and simulations of scattering for propagation modeling at THz frequencies. IEEE Int. Symp. Antennas and Propagation Society. 2007:5559–5562. [Google Scholar]
- 107.Kleine-Ostmann T, Jansen C, Piesiewicz R, Mittleman D, Koch M, Kurner T. Propagation modeling based on measurements and simulations of surface scattering in specular direction. Joint 32nd Int. Conf. Infrared and Millimeter Waves and the 15th Int. Conf. Terahertz Electronics, IRMMW-THz. 2007:408–410. [Google Scholar]
- 108.Piesiewicz R, Jansen C, Mittleman D, Kleine-Ostmann T, Koch M, Kurner T. Scattering analysis for the modeling of THz communication systems. IEEE Trans. Antennas Propag. 2007;55:3002–3009. [Google Scholar]
- 109.Ortolani M, Lee JS, Schade U, Hubers HW. Surface roughness effects on the terahertz reflectance of pure explosive materials. Appl. Phys. Lett. 2008;93:081906–081906-3. [Google Scholar]
- 110.Anastasi RF, Madaras EI. Int. Workshop on Ultrasonic and Advanced Methods for Nondestructive Testing and Material Characterization. Dartmouth, MA: 2006. Terahertz NDE for metallic surface roughness evaluation. [Google Scholar]
- 111.Kapp DA, Brown GS. A new numerical method for rough-surface scattering calculations. IEEE Trans. Antennas Propag. 1996;44:711. [Google Scholar]
- 112.Grossman E. 2011. personal communication.
- 113.Grossman E. 2011. personal communication.
- 114.Taylor ZD, Singh RS, Culjat MO, Suen JY, Grundfest WS, Brown ER. SPIE Terahertz for Military and Security Applications VI. Orlando, FL: 2008. THz imaging based on water-concentration contrast; pp. 69490D–8. [Google Scholar]
- 115.Singh RS, Taylor ZD, Tewari P, Bennett D, Culjat MO, Lee H, Brown ER, Grundfest WS. THz Imaging of Skin Hydration: Motivation for the Frequency Band. San Francisco, CA: 2010. pp. 755513–8. [Google Scholar]
- 116. [Online]. Available: http://vadiodes.com/index.php?option=com_content&view=article&id=123%3Awr15zbd&catit=12&Itemid=3.
- 117. [Online]. Available: http://www.calmarlaser.com/
- 118.Bjarnason JE, Brown ER, Korter TM. SPIE Terahertz for Military and Security Applications V. Orlando, FL: 2007. Comparison of the THz absorption feature in lactose to related saccharides; pp. 65490L–9. [Google Scholar]
- 119.Goldsmith P. Gaussian Beam Quasioptical Propogation and Applications. IEEE Press; Piscataway, NJ: 1998. [Google Scholar]
- 120.Roessler DM. Kramers-Kronig analysis of reflection data. British J. Appl. Phys. 1965;16:1119. [Google Scholar]
- 121.Phelan JRJ, Cook AR. Electrically calibrated pyroelectric optical-radiation detector. Appl. Opt. 1973;12:2494–2500. doi: 10.1364/AO.12.002494. [DOI] [PubMed] [Google Scholar]
- 122.Zhang H, Mitobe K, Yoshimura N. Terahertz imaging for water content measurement. Int. Symp. Electrical Insulating Materials (ISEIM 2008) 2008:87–90. [Google Scholar]
- 123.Siegel PH, Dengler RJ. Applications & early results from THz heterodyne imaging at 119 um. Conf. Dig. 2004 Joint 29th Int. Conf. Infrared and Millimeter Waves and 12th Int. Conf. Terahertz Electronics. 2004:555–556. [Google Scholar]
- 124.Burn incidence and treatment in the US: 2007 fact sheet. American Burn Association (ABA); [Google Scholar]
- 125.National Burn Repository (2005 Report) American Burn Association (ABA); [Google Scholar]
- 126.Jaskille AD, Shupp JW, Jordan MH, Jeng JC. Critical review of burn depth assessment techniques: Part I. Historical review. J. Burn Care Res. 2009;30:937–947. doi: 10.1097/BCR.0b013e3181c07f21. doi: 10.1097/BCR. 0b013e3181c07f21. [DOI] [PubMed] [Google Scholar]
- 127.Singh V, Devgan L, Bhat S, Milner SM. The pathogenesis of burn wound conversion. Annals of Plastic Surgery. 2007;59:109–115. doi: 10.1097/01.sap.0000252065.90759.e6. 10.1097/01.sap.0000252065.90759.e6. [DOI] [PubMed] [Google Scholar]
- 128.Zhang HF, Maslov K, Stoica G, Wang LV. Imaging acute thermal burns by photoacoustic microscopy. J. Biomed. Opt. 2006;11:054033–5. doi: 10.1117/1.2355667. [DOI] [PubMed] [Google Scholar]
- 129.Atiyeh BS, Gunn SW, Hayek SN. State of the art in burn treatment. World J. Surgery. 2005;29:131–148. doi: 10.1007/s00268-004-1082-2. [DOI] [PubMed] [Google Scholar]
- 130.Hargroder AG, Davidson SJE, Luther DG, Head JF. Infrared Technology and Applications XXV. Orlando, FL: 1999. Infrared imaging of burn wounds to determine burn depth; pp. 103–108. [Google Scholar]
- 131.Kaiser M, Yafi A, Cinat M, Choi B, Durkin AJ. Noninvasive assessment of burn wound severity using optical technology: A review of current and future modalities. Burns. 2011;37:377–386. doi: 10.1016/j.burns.2010.11.012. [DOI] [PMC free article] [PubMed] [Google Scholar]
- 132.Bouclier M, Cavey D, Kail N, Hensby C. Experimental models in skin pharmacology. Pharmacol. Rev. 1990 Jun 1;42:127–154. 1990. [PubMed] [Google Scholar]
- 133.Tewari P, Kealey CP, Bennett DB, Bajwa N, Barnett KS, Singh RS, Culjat MO, Stojadinovic A, Grundfest WS, Taylor ZD. THz imaging of in vivo burn wounds. Science [Google Scholar]
- 134.Jackson DM. The diagnosis of the depth of burning. British J. Surgery. 1953;40:588–596. doi: 10.1002/bjs.18004016413. [DOI] [PubMed] [Google Scholar]
- 135.Warden GD. Burn shock resuscitation. World J. Surgery. 1992;16:16–23. doi: 10.1007/BF02067109. [DOI] [PubMed] [Google Scholar]
- 136.Reiss E, Stirman JA, Artz CP, Davis JH, Amspacher WH. Fluid and electrolyte balance in burns. J. Am. Med. Assoc. 1953 Aug.152:1309–1313. doi: 10.1001/jama.1953.03690140017004. 1953. [DOI] [PubMed] [Google Scholar]
- 137.Riazuddin SA, Zaghloul NA, Al-Saif A, Davey L, Diplas BH, Meadows DN, Eghrari AO, Minear MA, Li Y-J, Klintworth GK, Afshari N, Gregory SG, Gottsch JD, Katsanis N. Missense mutations in TCF8 cause late-onset fuchs corneal dystrophy and interact with FCD4 on chromosome 9p. Am. J. Human Genetics. 86:45–53. doi: 10.1016/j.ajhg.2009.12.001. [DOI] [PMC free article] [PubMed] [Google Scholar]
- 138.Adamis AP, Filatov V, Tripathi BJ, Tripathi RAMC. Fuchs’ endothelial dystrophy of the cornea. Survey Ophthalmol. 1993 Oct.38:149–168. doi: 10.1016/0039-6257(93)90099-s. [DOI] [PubMed] [Google Scholar]
- 139.Klintworth G. Corneal dystrophies. Orphanet J. Rare Diseases. 2009;4:7. doi: 10.1186/1750-1172-4-7. [DOI] [PMC free article] [PubMed] [Google Scholar]
- 140.Yue BY, Sugar J, Schrode K. Histochemical studies of keratoconus. Curr. Eye Res. 1988 Jan.7:81–86. doi: 10.3109/02713688809047024. [DOI] [PubMed] [Google Scholar]
- 141.Borderie VM, Touzeau O, Bourcier T, Allouch CE, Zito E, Laroche L. Outcome of graft central thickness after penetrating keratoplasty. Ophthalmology. 2005;112:626–633. doi: 10.1016/j.ophtha.2004.11.044. [DOI] [PubMed] [Google Scholar]
- 142.Dougherty PJ, Wellish KL, Maloney RK. Excimer laser ablation rate and corneal hydration. Am. J. Ophthalmol. 1994 Aug.118:169–76. doi: 10.1016/s0002-9394(14)72896-x. [DOI] [PubMed] [Google Scholar]
- 143.de Souza IR, de Souza AP, de Queiroz AP, Figueiredo P, Jesus RS, Kara-Jose N. Influence of temperature and humidity on laser in situ keratomileusis outcomes. J. Refract. Surg. 2001 Mar-Apr;17:S202–4. doi: 10.3928/1081-597X-20010302-11. [DOI] [PubMed] [Google Scholar]
- 144.Fisher BTBS, Masiello KABS, Goldstein MHMD, Hahn DWPD. Assessment of transient changes in corneal hydration using confocal Raman spectroscopy. Cornea. 2003;22:363–370. doi: 10.1097/00003226-200305000-00016. [DOI] [PubMed] [Google Scholar]
- 145.Bende T, Seiler T, Wollensak J. Side effects in excimer corneal surgery: Corneal thermal gradients. Graefe's Archive for Clinical and Experimental Ophthalmology. 1988;226:277–280. doi: 10.1007/BF02181196. [DOI] [PubMed] [Google Scholar]
- 146.Farah SG, Azar DT. Visual outcomes after primary LASIK. In: Azar DT, Koch DD, editors. LASIK: Fundamentals, Surgical Techniques, and Complications. Marcel Dekker; New York: 2003. p. xiv.p. 506. [Google Scholar]
- 147.Brugin E, Ghirlando A, Gambato C, Midena E. Central corneal thickness: Z-ring corneal confocal microscopy versus ultrasound pachymetry. Cornea. 2007;26:303–307. doi: 10.1097/ICO.0b013e31802e1dea. doi 10.1097/ICO.0b013e31802e1dea. [DOI] [PubMed] [Google Scholar]
- 148.Ytteborg J, Dohlman CH. Corneal edema and intraocular pressure: II. Clinical results. Arch. Ophthalmol. 1965 Oct.74:477–484. doi: 10.1001/archopht.1965.00970040479008. 1965. [DOI] [PubMed] [Google Scholar]
- 149. [Online]. Available: http://www.jnjvision.com/products-acuvue-oasys.htm.
- 150. [Online]. Available: http://www.coopervision.com/us/patient/contactlenses/brands/proclear/
- 151. [Online]. Available: http://www.dailies.com/rebate/index.shtml.
- 152.Holden BA, Mcnally JJ, Egan P. Limited lateral spread of stromal edema in the human cornea fitted with a (‘donut’) contact lens with a large central aperture. Curr. Eye Res. 1988;7:601–605. doi: 10.3109/02713688809031816. [DOI] [PubMed] [Google Scholar]
- 153.Hedbys BO, Mishima S. Flow of water in the corneal stroma. Exp. Eye Res. 1962 Mar.1:262–75. doi: 10.1016/s0014-4835(62)80010-4. [DOI] [PubMed] [Google Scholar]
- 154.Singh RS, Tewari P, Bourges JL, Hubschman JP, Bennett DB, Taylor ZD, Lee H, Brown ER, Grundfest WS, Culjat MO. 32nd Annu. Int. Conf. IEEE Eng. Med. Biol. Soc. Buenos Aires, Argentina: 2010. Terahertz sensing of corneal hydration. [DOI] [PubMed] [Google Scholar]


