Abstract
Current optical coherence tomography (OCT) based micro-angiography is prone to noise that arises from static background. This work presents a novel feature space based optical micro-angiography (OMAG) method (fsOMAG) that can effectively differentiate flow signal from static background in the feature space. fsOMAG consists of two steps. In the first step a classification map is generated that provides criterion for classification in the second step to extract functional blood flow from experimental data set. The performance of fsOMAG is examined through phantom experiments and in-vivo human retinal imaging, and compared with the existing OMAG. The results indicate its potential for clinical applications.
OCIS codes: (170.4500) Optical coherence tomography, (170.4470) Ophthalmology, (170.3880) Medical and biological imaging
1. Introduction
As an important functional extension to optical coherence tomography (OCT), optical microangiography (OMAG) [1] has been widely applied in biomedical imaging applications, such as in the imaging of cerebrovascular perfusion [2,3], retinal microcirculation [4,5], tumor progression [6], etc. Especially in ophthalmic imaging, due to its ability to visualize functional blood vessels noninvasively with exceptional sensitivity, OMAG shows promising results comparing to current standard techniques for posterior eye vascular imaging [7], e.g., fluorescein angiography and indocyanine green angiography [8].
Since the first demonstration of Doppler OCT that images/measures the flow by evaluating phase difference between adjacent A-scans [9], different variations of Doppler OCT techniques have been reported through the development of optical angiography [1, 10–19]. For example, instead of using the phase-resolved information, speckle variance OCT utilizes the statistical variance of structural OCT intensities among successive scans [11], and phase variance OCT utilizes the statistical variance of phase changes among adjacent scans [12,15]. Recently amplitude decorrelation among neighboring scans with split-spectrum average was proposed [18]. On the other hand, considering the dynamic speckle formed by moving blood cells and the power spectrum shift caused by Doppler effect and spectral broadening due to heterogeneous property of the biological tissue [20], Wang et al. proposed to introduce a carrier frequency to discriminate the frequency components of OCT signals that are related to different flow speed [1]. Later variations based on OMAG that allow for easy system implementation and better sensitivity were demonstrated [13,14]. Recent development of OMAG highlights a simplified implementation that utilizes the signal difference between neighboring A-scans in either slow or fast scanning axes [16,17].
In general, one key factor to any OCT-based angiography method is to maximize the signal of flow while minimizing the background static signal based on repeated scans, in other words to better identify the differences among the signals acquired within a certain time interval. Strategies such as comparing successive B-scans instead of adjacent A-scans, surrounding pixel average and split-spectrum average were employed with different contrast mechanisms such as phase variance, speckle variance, decorrelation, etc. Although promising results have been reported by these abovementioned methods, it is often observed from in-vivo data that the angiographic outcomes are hindered by static background signals, which are difficult to remove by simple thresholding. As a result, in order to obtain clean three dimensional results, manual operation such as segmentation or single vessel tracing are sometimes employed. Alternatively Singh et al. presented a learning algorithm using a support vector machine to better distinguish between bulk and flow signatures on phase-resolved Doppler OCT images [21]. In this work, a new and improved processing method based on OMAG by utilizing a feature space is presented. Different from simply differentiating flow signals from static signals using a certain contrast mechanism, the flow and static signals are further classified in the feature space that is generated using the acquired data. For brevity, we termed this feature space based OMAG as fsOMAG. As demonstrated below, fsOMAG is able to effectively remove the background static signals, enhancing the image quality of OMAG thus facilitating the quantification of blood perfusion within the scanned tissue volume. fsOMAG is based on pixel by pixel operation hence boasts high sensitivity to both longitudinal direction and lateral direction [22]. Section 2 details the implementation of fsOMAG. Section 3 presents the results of phantom experiments and in-vivo microcirculation imaging of human retina.
2. Method
In conventional angiography methods, considering the fact that the acquired signals from static background within repeated scans are not exactly the same due to for example sample movement, system noise, stability in scanning mechanism etc., the angiographic results may not only contain the flow information but also bear the static background signal. Such “false flow” is difficult to delineate based on the flow image alone. However, if comparing the intensities on the structural image, the intensity of “false flow” for example hyper-reflection is expected to be higher than the intensity of real flow. This fact prompts the creation of fsOMAG. fsOMAG projects each data point or pixel onto the feature space, enabling the static and flow pixels to be effectively classified. The implementation of fsOMAG is illustrated in Fig. 1 . It contains two steps: 1), Training using known knowledge; and 2), Classification. Both steps are performed in the feature space.
Fig. 1.
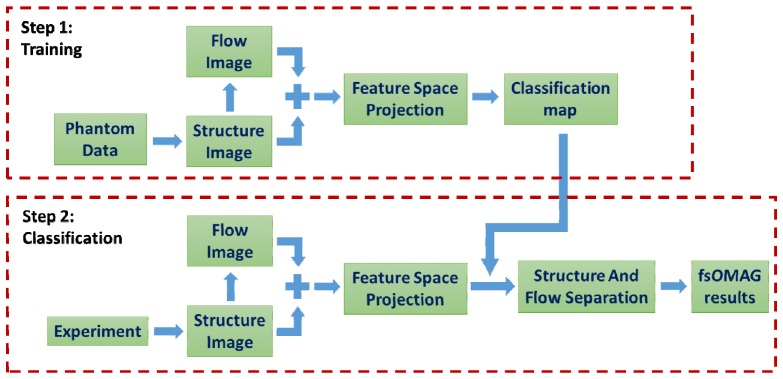
Flow chart of the implementation of fsOMAG.
2.1 Training
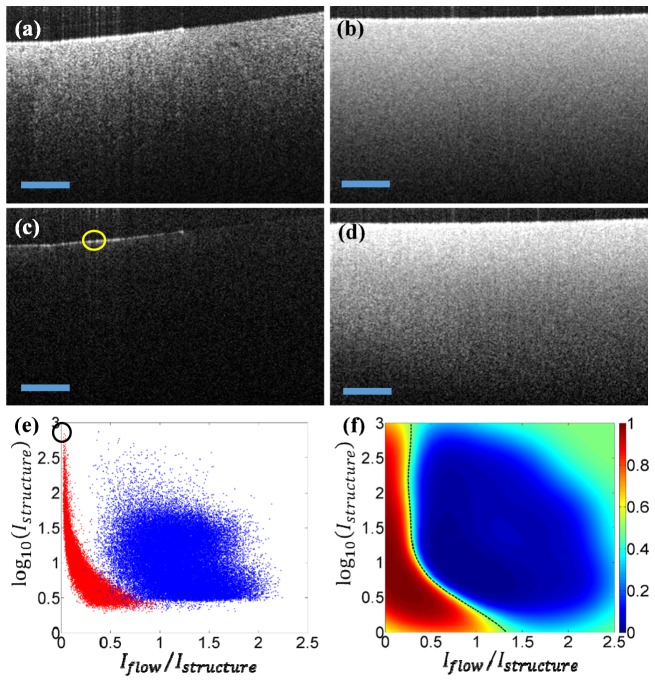
The purpose of training is to generate a classification map on the feature space based on prior knowledge. Ideally, the classification map should be generated by the use of in vivo experimental data. However, it is difficult, if not impossible, to identify static scattering tissue in any in vivo scenario due to the inevitable movement of live subject. Intralipid solution is a useful alternative, popular in biomedical optics community that is often used to simulate the turbid media with similar optical properties to biological tissue. We therefore elect to use the intralipid solution to fabricate scattering phantoms for the purpose of generating classification map. Two phantoms made of 2% intralipid solution were fabricated for this purpose. One is solidified gel phantom mixed with low concentration lipid to mimic the static tissue, and the other is scattering lipid solution to mimic the flow considering the Brownian motion of the scatters. Figures 2(a) and 2(b) illustrate the structural images of solid and lipid phantoms, respectively. Figures 2(c) and 2(d) are the corresponding flow images that were generated from the average of the differences among five adjacent B-scans [17]. The OCT system operates in 1300 nm with measured axial resolution of 13 µm in air and lateral resolution of 6 µm.
Fig. 2.
The training step of fsOMAG. (a) Structural image of solid phantom; (b) Structural image of liquid phantom; (c) Flow image of solid phantom; (d) Flow image of liquid phantom; (e) The feature space projection of both solid and liquid phantom data; (f) The classification map generated in the feature space. Scale bar: 300 µm.
The solid and liquid phantom data were then projected onto a two dimensional feature space for pixels above the noise level, utilizing each pixel’s intensity on both the structure and flow images. The feature space is chosen such that the y-axis denotes the logarithm of structural intensity with base and the x-axis denotes the ratio between the flow intensity and the structural intensity . Figure 2(e) illustrates the results of feature space projection where blue dots indicate the pixels of the liquid phantom while red dots indicate the pixels of the solid phantom. Figure 2(e) indicates that most of the pixels representing flow are well separated from the pixels representing static structure though there is some overlapping for pixels with low structural intensities that are due to system noise. Further the hyper-reflection of the solid phantom that might lead to false flow signals on the flow image as indicated by the yellow circle in Fig. 2(c) is located far apart from flow pixels in the feature space, indicated by the black circle in Fig. 2(e). Hence it can be differentiated from the real flow signal. Since the feature space relies on the intensity of the structural image, for a more general demonstration, the y-axis of the feature space denotes the intensity above the system noise level which was measured with no sample presented in the sample arm. It is worth mentioning that the choice of feature space is not exclusive. A three dimensional space by including more information might be used to better separate the flow from the static background.
After projection, Gaussian process classification (GPC) was applied to generate the classification map in the feature space to separate these two groups, i.e. static and flow signals. GPC is a probabilistic statistical classification model based on logistic regression, which predicts the probability distribution of the data belonging to one certain group [23]. The predictive probability is calculated using:
| (1) |
where is the training data set, is calculated from the sigmoid function , and is the posterior probability obtained from which is calculated based on Laplacian approximation through learning and where is an implicit function over training data set that can be transformed into posterior probability via logistic sigmoid. In brief, after training data is acquired, the mode of posterior distribution is firstly obtained through iteratively reweighted least squares method, from which the posterior probability is calculated. Then the predictive probability is calculated using Eq. (1). Hereby other classification methods such as Fisher's linear discriminant and probabilistic generative model can also be employed to classify the data in the feature space. The result of GPC was illustrated in Fig. 2(f). The value of the map represents the probability of each pixel projected in feature space, where the two groups are well separated as shown. Further at the boundary of the two groups, is denoted by the black dashed line in Fig. 2(f). The curved line provides insight into the reason that it is difficult to separate the flow signal from static background through a simple thresholding. It should be noted that different concentrations of intralipid phantoms have been made to test the generosity of the training process. The resulted classification maps remain almost the same in the feature space.
2.2 Classification
In this step after the experimental data are acquired, the flow image is firstly obtained by evaluating the difference between adjacent B-scans. Then utilizing each pixel’s intensity on both the flow and structure images, all of the data are projected into the same feature space pixel-wise in the same fashion as the ones in training step. In the feature space, using the predetermined classification map (Fig. 2(f)) from the training, the static background is differentiated from the flow signals. It should be noted that the two steps of fsOMAG can be processed separately which means the training step can be conducted in advance. Hence the computation cost for processing the experimental data of fsOMAG compared to traditional OMAG is minimized. For better accuracy, this step can also be done without using the classification map by directly generating the predictive probability in the feature space based on the posterior probability obtained during the learning process from the training step. However it will impose greater computational cost for processing the experimental data. After feature space projection, the pixels with probability larger than 0.5 in the feature space are set to zero on the flow image, which effectively suppresses the static background. The effectiveness of probability threshold for signal discrimination is affected by the signal-to-noise ratio of the flow image that is further determined by the system stabilities and the sample optical property. In ideal case, this condition could be <0.5 which means the pixel satisfies this condition will have more chance to represent flow. In general the higher this threshold is, the more flow signals will be included however the chance for including the static signals is also increased. Further the pixels with probability smaller than 0.5 in the feature space could be set to 65535 on the 16-bit flow image which greatly increases the flow signals. However doing so would correspondingly eliminate the useful information of the flow, for example particle concentration, which is embedded within the OMAG signals.
3. Experimental results
3.1 Phantom results
To test the performance of fsOMAG, a phantom containing both solid and liquid 2% intralipid was imaged and the results were illustrated in Fig. 3 . Figures 3(a)-3(c) illustrate the structural image, fsOMAG results and OMAG results of the phantom, respectively. As seen in Fig. 3(a), the lipid part of phantom is located above the solid part, which can be differentiated by the different textures on the structural image. As indicated in Fig. 3(c), OMAG leads to good results however the signals from static background are still obvious. In contrast, the fsOMAG as indicated in Fig. 3(b) results in a cleaner image where the static background is completely suppressed. Further comparing the red circles in Figs. 3(a) and 3(b), the flow signals at the air-intralipid interface with hyper-reflection, which were not due to the Brownian motion of intralipid particles, are also excluded.
Fig. 3.
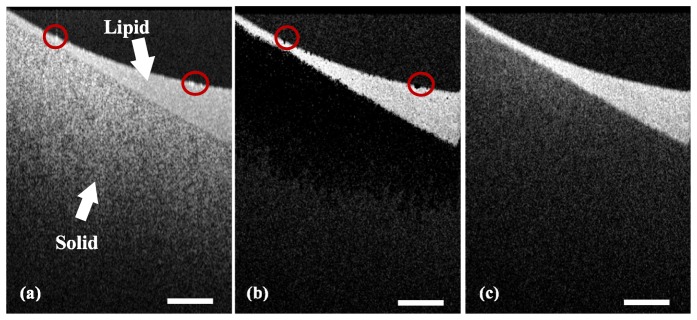
Phantom experiments. (a) The structural image; (b) fsOMAG results; (c) OMAG results. Scale bar: 400 µm.
3.2 In-vivo retinal blood vessel network imaging
To further demonstrate the performance of fsOMAG, in-vivo human posterior eye was imaged using our newly developed 1 µm system [24], and the retinal blood vessel network within macular region was examined. The system operates at 147 kHz A-scan rate with 12 µm measured axial resolution in air and approximate 13 μm lateral resolution at the retinal surface. For human study, the system was performed with ~1.8 mW light power at the cornea, below the safe ocular exposure limits recommended by the American National Standards Institute (ANSI) [25]. For maximum subject’s comfort, the measurements were conducted in normal daylight condition without pupil dilation. The subject scanning using SD-OCT system was approved by the Institutional Review Board (IRB) of the University of Washington and consent form was obtained from each subject before examination. For this experiment, the system runs at 393 B-scans per second. The time for each data set acquisition is ~4 second.
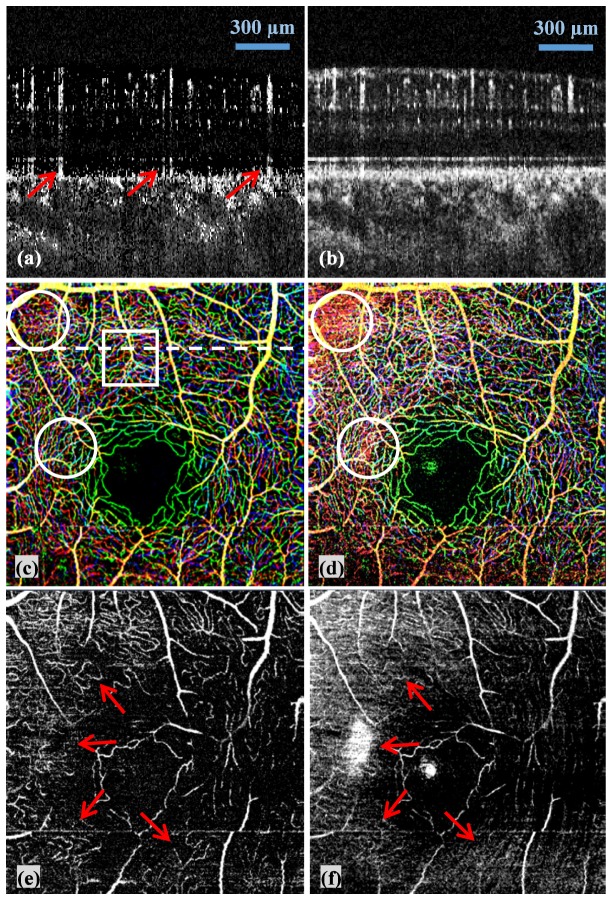
Figure 4 illustrates the results of fsOMAG compared with that of OMAG. Figures 4(a) and 4(b) are two representative B-scan images of fsOMAG and OMAG respectively from the position indicated by the white dashed line in Fig. 4(c). It can be seen that fsOMAG effectively minimizes the static background noise. However it is worth noting that the tailing effect is still visible as indicated by the red arrows in Fig. 4(a) due to the fact that the statistic properties of these data are similar to the flow data. More parameters might need to be included in the feature space to further eliminate the tailing effect. Figures 4(c) and 4(d) are the maximum intensity projection enface view of retinal blood vessel network acquired using fsOMAG and OMAG respectively. The results are color coded such that the vessels in nerve fiber layer (NFL) and ganglion cell layer (GCL) are illustrated in red, in inner plexiform layer (IPL) are in green, and in outer plexiform layer (OPL) are in blue. The large blood vessels which come across different layers are illustrated by the combination of the three colors. In some areas as indicated by the white circles in Figs. 4(c) and 4(d), where blood vessels are overwhelmed by the static background signals in Fig. 4(d) using OMAG, the vessel network can clearly be visualized in Fig. 4(c) using fsOMAG. These background noises in Fig. 4(d) mainly come from NFL due to its high reflectance. As a result, NFL normally has to be manually removed to obtain a clear enface view using OMAG. To further examine the performance of fsOMAG, the blood vessel network only in NFL were examined and the results of fsOMAG and OMAG are illustrated in Figs. 4(e) and 4(f) respectively. It is indicated by the red arrows in Figs. 4(e) and 4(f) that compared with OMAG, fsOMAG leads to clearer vasculature results.
Fig. 4.
The fsOMAG results of in-vivo human retinal vasculature imaging compared with OMAG. (a)-(b) Representative B-scan flow images using fsOMAG and OMAG; (c)-(d) The enface view of the imaging volume processed using fsOMAG and OMAG; (e)-(f) The enface view of NFL using fsOMAG and OMAG.
The superior performance of fsOMAG leads to the opportunity to visualize the retinal blood vessel network in true three dimensional space, as shown in Media 1 (1.5MB, MOV) . Figure 5(a) is a representative image of the movie. From Media 1 (1.5MB, MOV) , capillaries and large blood vessels are clearly identified in space. Further fsOMAG also provides the opportunity to closely look at the retinal microcirculation structure. Media 2 (675KB, MOV) illustrates the 3D profile of the area as indicated by the white box in Fig. 4(c), and Fig. 5(b) illustrates a snapshot of the movie at the side view of the volume. In Fig. 5(b), the large vessels which were indicated by the thick red dotted lines feed the capillaries indicated by the small dotted lines in NFL, GCL, IPL and OPL, respectively. This ability of in-vivo visualization of the retinal vessel structures in three dimensions would be useful in the study of intravascular related diseases.
Fig. 5.
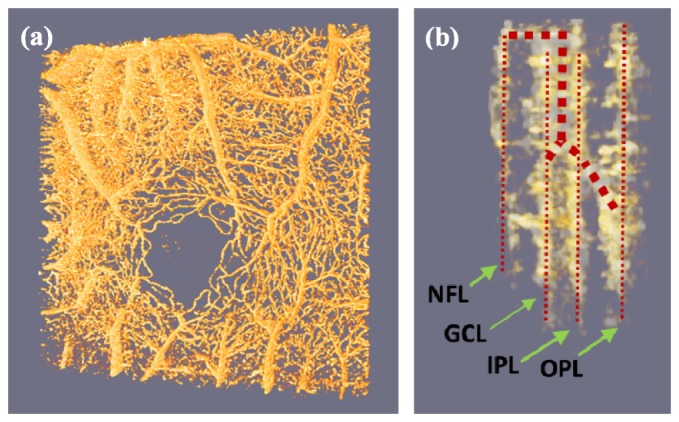
The retinal vessel network in three dimensional space ( Media 1 (1.5MB, MOV) ). The close look ( Media 2 (675KB, MOV) ) demonstrates the feeding large vessels and capillaries at various layers. (a) Representative image of Media 1 (1.5MB, MOV) ; (b) A snapshot of Media 2 (675KB, MOV) at the side view of the volume.
4. Discussion
The implementation of fsOMAG relies on the training process using liquid and solid phantoms in the current study. In particular, the training is based on the intensity of structure image and flow image at each pixel. To exclude the dependence on OCT systems with different sensitivities, the structural intensity utilized during training for the y-axis of feature space is the one above the system noise level. The intensity of flow image on the other hand is affected by the scanning protocols and different sample types. Studies have been reported upon the preferred parameters for flow imaging for example the interval between B-scans [26]. Further study will be needed to provide a full evaluation of fsOMAG using different scanning protocols. Hereby we preliminarily evaluate the effect of the number (N) of B-scan repetitions at each imaging position. Figure 6 illustrates the projection of liquid and solid phantoms in the feature space under different repetition numbers. Figures 6(a)-6(c) illustrate the feature space projection of solid phantom under three, four and five B-scan repetitions respectively, and Figs. 6(d)-6(f) illustrate the corresponding results of liquid phantoms. It is indicated that the increase of repetiton numbers (N) leads to the decreased spread of the feature space projection of both solid and liquid phantoms, hence better seperation of flow from static signals in the feature space. Thus the increase of the repetition numbers of B-scans during the experiment will improve the results of fsOMAG, which however would adversely increase the imaging time. Further it is postulated that there should be minimal if not zero dependence of the classification map upon overall SNR. The GPC algorithm employed in the training step generates a probability map where 0.5 is selected as the boundary for flow differentiation. The lower SNR might result in the broadening of distributions, hence larger overlapping between the two groups, the boundary (probability = 0.5) where two groups meet mainly depends on the centers of the two groups and is expected to be minimally affected.
Fig. 6.
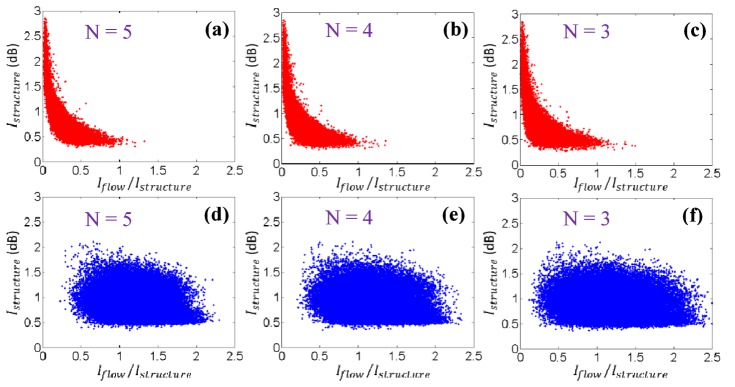
The feature space projection of solid and liquid phantoms under different repetition numbers (N). (a)-(c) Projection of solid phantom under N = 5, 4, and 3 B-scan repetition. (d)-(f) Projection of liquid phantom under N = 5, 4, and 3 B-scan repetition.
It might be argued that the intralipid phantom employed during the training progress is not similar to the measured sample in in-vivo experiment. It is admitted that the Brownian motion of the liquid intralipid phantom is different from for example the blood flow. However the OCT contrast mechanism employed in the work for flow signal is independent of the sample types. fsOMAG utilizes the relation between the intensity on the structural image and that on the flow image which is obtained based on the same contrast mechanism during the training and classification steps. Thus this relation is assumed to be independent of tissue types. This assumption is also validated by the experimental results presented in section 3, where we used the classification map generated from intralipid phantom to extract the retinal flow signals from the in vivo data sets acquired from human retina. However it should be noted that the validity of this proposed method depends on the consistency between the classification map and the experimental data. For example the change of scanning protocol during the experiments will not entail a new classification map. However the change of CCD camera in SDOCT might call for a new training step due to the change of CCD pixels’ dynamic range, and the change of center wavelength or wavelength range might also require a new training process due to the change of OCT contrast owing to different tissue optical properties.
Compared with the recent published work [27] in which the OMAG result is weighted by an averaged decorrelation coefficient aiming to suppress the OMAG signals of static background, this current work directly classifies and eliminates the static background OMAG signals. In [27] the weighting process involves an empirically determined scaling parameter while this current work is purely based on the acquired data. We expect similar computational efforts between these two methods.
In addition, it has to be emphasized that we have used OMAG as an example to illustrate the proposed feature space approach to extract the flow signals from the static background signals. The method is expected to be equally applicable to current various OCT based angiography techniques including those using swept-source OCT systems since it utilizes structural intensity information during training and classification after the traditional OMAG results have been obtained.
In this work, a new and improved optical micro-angiography method termed fsOMAG is proposed. The novelty of fsOMAG lies in the fact that the intensity of structure image is further utilized in the feature space as extra information for classification of flow signal. The perplexing problem of how to classify the static background from the flow signals is discussed. It is demonstrated that fsOMAG has improved performance with minimal side effects of static tissue artifacts. The method also has minimal increase of computational cost compared to OMAG, promising its useful applications in the investigation of diseases that have vascular involvement.
Acknowledgment
This research was supported in part by the NIH grants ( R01EY024158, R01HL093140 and R01EB009682). The content is solely the responsibility of the authors and does not necessarily represent the official views of the grant giving bodies.
References and links
- 1.Wang R. K., Jacques S. L., Ma Z., Hurst S., Hanson S. R., Gruber A., “Three dimensional optical angiography,” Opt. Express 15(7), 4083–4097 (2007). 10.1364/OE.15.004083 [DOI] [PubMed] [Google Scholar]
- 2.Li Y., Baran U., Wang R. K., “Application of Thinned-Skull Cranial Window to Mouse Cerebral Blood Flow Imaging Using Optical Microangiography,” PLoS ONE 9(11), e113658 (2014). 10.1371/journal.pone.0113658 [DOI] [PMC free article] [PubMed] [Google Scholar]
- 3.Jia Y., Li P., Wang R. K., “Optical microangiography provides an ability to monitor responses of cerebral microcirculation to hypoxia and hyperoxia in mice,” J. Biomed. Opt. 16(9), 096019 (2011). 10.1117/1.3625238 [DOI] [PMC free article] [PubMed] [Google Scholar]
- 4.Thorell M. R., Zhang Q., Huang Y., An L., Durbin M. K., Laron M., Sharma U., Stetson P. F., Gregori G., Wang R. K., Rosenfeld P. J., “Swept-source OCT angiography of macular telangiectasia type 2,” Ophthalmic Surg Lasers Imaging Retina 45(5), 369–380 (2014). 10.3928/23258160-20140909-06 [DOI] [PubMed] [Google Scholar]
- 5.Zhi Z., Cepurna W., Johnson E., Shen T., Morrison J., Wang R. K., “Volumetric and quantitative imaging of retinal blood flow in rats with optical microangiography,” Biomed. Opt. Express 2(3), 579–591 (2011). 10.1364/BOE.2.000579 [DOI] [PMC free article] [PubMed] [Google Scholar]
- 6.Vakoc B. J., Fukumura D., Jain R. K., Bouma B. E., “Cancer imaging by optical coherence tomography: preclinical progress and clinical potential,” Nat. Rev. Cancer 12(5), 363–368 (2012). 10.1038/nrc3235 [DOI] [PMC free article] [PubMed] [Google Scholar]
- 7.An L., Subhush H. M., Wilson D. J., Wang R. K., “High-resolution wide-field imaging of retinal and choroidal blood perfusion with optical microangiography,” J. Biomed. Opt. 15(2), 026011 (2010). 10.1117/1.3369811 [DOI] [PMC free article] [PubMed] [Google Scholar]
- 8.Baillif S., Wolff B., Paoli V., Gastaud P., Mauget-Faÿsse M., “Retinal fluorescein and indocyanine green angiography and spectral-domain optical coherence tomography findings in acute retinal pigment epitheliitis,” Retina 31(6), 1156–1163 (2011). 10.1097/IAE.0b013e3181fbcea5 [DOI] [PubMed] [Google Scholar]
- 9.Chen Z., Milner T. E., Srinivas S., Wang X., Malekafzali A., van Gemert M. J. C., Nelson J. S., “Noninvasive imaging of in vivo blood flow velocity using optical Doppler tomography,” Opt. Lett. 22(14), 1119–1121 (1997). 10.1364/OL.22.001119 [DOI] [PubMed] [Google Scholar]
- 10.Yasuno Y., Hong Y., Makita S., Yamanari M., Akiba M., Miura M., Yatagai T., “In vivo high-contrast imaging of deep posterior eye by 1-um swept source optical coherence tomography and scattering optical coherence angiography,” Opt. Express 15(10), 6121–6139 (2007). 10.1364/OE.15.006121 [DOI] [PubMed] [Google Scholar]
- 11.Mariampillai A., Standish B. A., Moriyama E. H., Khurana M., Munce N. R., Leung M. K. K., Jiang J., Cable A., Wilson B. C., Vitkin I. A., Yang V. X. D., “Speckle variance detection of microvasculature using swept-source optical coherence tomography,” Opt. Lett. 33(13), 1530–1532 (2008). 10.1364/OL.33.001530 [DOI] [PubMed] [Google Scholar]
- 12.Fingler J., Zawadzki R. J., Werner J. S., Schwartz D., Fraser S. E., “Volumetric microvascular imaging of human retina using optical coherence tomography with a novel motion contrast technique,” Opt. Express 17(24), 22190–22200 (2009). 10.1364/OE.17.022190 [DOI] [PMC free article] [PubMed] [Google Scholar]
- 13.Wang R. K., An L., “Doppler optical micro-angiography for volumetric imaging of vascular perfusion in vivo,” Opt. Express 17(11), 8926–8940 (2009). 10.1364/OE.17.008926 [DOI] [PMC free article] [PubMed] [Google Scholar]
- 14.Wang R. K., An L., Francis P., Wilson D. J., “Depth-resolved imaging of capillary networks in retina and choroid using ultrahigh sensitive optical microangiography,” Opt. Lett. 35(9), 1467–1469 (2010). 10.1364/OL.35.001467 [DOI] [PMC free article] [PubMed] [Google Scholar]
- 15.Yu L., Chen Z., “Doppler variance imaging for three-dimensional retina and choroid angiography,” J. Biomed. Opt. 15(1), 016029 (2010). 10.1117/1.3302806 [DOI] [PMC free article] [PubMed] [Google Scholar]
- 16.Srinivasan V. J., Jiang J. Y., Yaseen M. A., Radhakrishnan H., Wu W., Barry S., Cable A. E., Boas D. A., “Rapid volumetric angiography of cortical microvasculature with optical coherence tomography,” Opt. Lett. 35(1), 43–45 (2010). [DOI] [PMC free article] [PubMed] [Google Scholar]
- 17.An L., Qin J., Wang R. K., “Ultrahigh sensitive optical microangiography for in vivo imaging of microcirculations within human skin tissue beds,” Opt. Express 18(8), 8220–8228 (2010). 10.1364/OE.18.008220 [DOI] [PMC free article] [PubMed] [Google Scholar]
- 18.Jia Y., Tan O., Tokayer J., Potsaid B., Wang Y., Liu J. J., Kraus M. F., Subhash H., Fujimoto J. G., Hornegger J., Huang D., “Split-spectrum amplitude-decorrelation angiography with optical coherence tomography,” Opt. Express 20(4), 4710–4725 (2012). 10.1364/OE.20.004710 [DOI] [PMC free article] [PubMed] [Google Scholar]
- 19.Choi W. J., Reif R., Yousefi S., Wang R. K., “Improved microcirculation imaging of human skin in vivo using optical microangiography with a correlation mapping mask,” J. Biomed. Opt. 19(3), 036010 (2014). 10.1117/1.JBO.19.3.036010 [DOI] [PMC free article] [PubMed] [Google Scholar]
- 20.Wang R. K., Ma Z., “Real-time flow imaging by removing texture pattern artifacts in spectral-domain optical Doppler tomography,” Opt. Lett. 31(20), 3001–3003 (2006). 10.1364/OL.31.003001 [DOI] [PubMed] [Google Scholar]
- 21.Singh A. S. G., Schmoll T., Leitgeb R. A., “Segmentation of Doppler optical coherence tomography signatures using a support-vector machine,” Biomed. Opt. Express 2(5), 1328–1339 (2011). [DOI] [PMC free article] [PubMed] [Google Scholar]
- 22.Zhang A., Xi J., Liang W., Gao T., Li X., “Generic pixel-wise speckle detection in Fourier-domain optical coherence tomography images,” Opt. Lett. 39(15), 4392–4395 (2014). 10.1364/OL.39.004392 [DOI] [PMC free article] [PubMed] [Google Scholar]
- 23.Rasmussen C. E., Williams C. K. I., Gaussian Processes for Machine Learning (the MIT Press, 2006). [Google Scholar]
- 24.Zhang A., Zhang Q., Huang Y., Zhong Z., Wang R. K., “Multifunctional 1050 nm spectral domain OCT system at 147K for posterior eye imaging,” Mod. Technol. Med. 7(1), 7–12 (2015). [DOI] [PMC free article] [PubMed] [Google Scholar]
- 25.American National Standard Institute, “Safe use of lasers and safe use of optical fiber communications,” (ANSI, New York; 2000), no. 168. [Google Scholar]
- 26.Braaf B., Vermeer K. A., Vienola K. V., de Boer J. F., “Angiography of the retina and the choroid with phase-resolved OCT using interval-optimized backstitched B-scans,” Opt. Express 20(18), 20516–20534 (2012). 10.1364/OE.20.020516 [DOI] [PubMed] [Google Scholar]
- 27.Huang Y., Zhang Q., Wang R. K., “Efficient method to suppress artifacts caused by tissue hyper-reflections in optical microangiography of retina in vivo,” Biomed. Opt. Express 6(4), 1195–1208 (2015). 10.1364/BOE.6.001195 [DOI] [PMC free article] [PubMed] [Google Scholar]


