

Abstract
Background
Heart failure (HF) is an important public health concern particularly among persons over 65 years of age. Women and African Americans are critically understudied populations that carry a sizeable portion of the HF burden. Limited normative and prognostic data exist regarding measures of cardiac structure, diastolic function, and novel measures of systolic deformation in older adults living in the community.
Methods and Results
The Atherosclerosis Risk in Communities (ARIC) study is a large, predominantly biracial NHLBI-sponsored epidemiologic cohort study. Between 2011 and 2013, approximately 6,000 surviving participants, now in their seventh to ninth decade of life, are expected to return for a 5th study visit during which comprehensive 2D, Doppler, tissue Doppler, and speckle-tracking echocardiography will be performed uniformly in all cohort clinic visit participants. The following objectives will be addressed: (1) to characterize cardiac structural and functional abnormalities among the elderly and determine how these differ by gender and race/ethnicity, (2) determine the relationship between ventricular and vascular abnormalities, and (3) prospectively examine the extent to which these non-invasive measures associate with incident HF.
Conclusions
We describe the design, imaging acquisition and analysis methods, and quality assurance metrics for echocardiography in Visit 5 of the ARIC cohort. A better understanding of the differences in cardiac structure and function through the spectrum of HF stages in the elderly generally, and between genders and racial/ethnic groups specifically, will deepen our understanding of the pathophysiology driving HF progression in these at-risk populations and may inform novel prevention or therapeutic strategies.
Introduction
Heart failure (HF) is a progressive disorder afflicting 5 million Americans,1 with over 80% of HF hospitalizations occurring in persons over 65 years of age. Up to half of HF cases occur in the setting of preserved left ventricular ejection fraction (HFpEF), a syndrome for which there are currently no proven therapies.2,3,4 Within the aging population, women and African Americans are critically understudied populations.5,6,7 Limited normative data exists regarding measures of cardiac structure, diastolic function, and novel measures of systolic deformation in the elderly. A better understanding of the differences in cardiac structure and function through the spectrum of HF stages in the elderly generally, and between genders and racial/ethnic groups specifically, will enhance our understanding of the pathophysiology driving HF progression in these populations and may inform novel preventive and therapeutic strategies.
The National Heart, Lung, and Blood Institute (NHLBI) Atherosclerosis Risk in Communities (ARIC) study was initiated in 1985 in four communities in the U.S. and follows 15,792 individuals, 27% of whom are African American.8 Participants are now in their seventh to ninth decade of life, an age during which the prevalence of HF increases dramatically. Over 6,000 participants are expected to attend the fifth visit cycle (Visit 5) occurring from July 2011 to September 2013. The incorporation of comprehensive echocardiography (echo) into ARIC therefore presents a unique opportunity to examine cardiac structure and function in a biracial elderly cohort, and to investigate alterations in cardiac structure and function across the spectrum of HF stages, their relationship to clinical outcomes, and whether they vary in these critically understudied populations.
We describe the design, imaging acquisition and analysis methods, and quality assurance metrics for echocardiography in Visit 5 of the ARIC cohort.
Methods
The ARIC study design and methods have been previous described in detail.8 ARIC is a prospective epidemiologic cohort study which, between 1987 and 1989, enrolled 15,792 middle-aged subjects in 4 U.S. communities: Forsyth County, NC, Jackson, MS, suburban Minneapolis, MN, and Washington County, MD. Cohort participants underwent four exam visits between 1987 and 1998. Between 2011 and 2013, approximately 6,000 surviving participants are expected to return for a 5th study visit. ARIC participants undergo surveillance for cardiovascular events including HF, incident coronary heart disease events, and all-cause mortality as previously described in detail.9,10 Incident HF is based on ARIC Mortality and Morbidity Classification Committee adjudicated HF hospitalization (performed since 2005), including data on LVEF assessment during hospitalization, as previously published.11
Visit 5 is the first examination in which echo is being performed in all four ARIC field centers. The echo imaging and analysis protocol, sonographer training and certification process, quality assurance plan, and statistical methodologies were initially designed by investigators at the Echocardiography Reading Center (ERC; Brigham and Women’s Hospital, Boston, MA) in response to a Request for Proposals from the NHLBI. These methods were then modified, finalized, and implemented in collaboration with investigators from the ARIC Field Centers, Coordinating Center, and Steering Committee.
Echo in ARIC Visit 5 is designed to address three specific aims: The first is to characterize the abnormalities of cardiac structure and function in a community-based sample of elderly individuals and assess how these abnormalities vary by gender and race/ethnicity. The study utilizes standard and novel echo techniques to characterize five specific domains of cardiac performance: (a) left ventricular (LV) structure and geometry, (b) LV systolic function assessed by novel 2D speckle-tracking based deformation imaging, (c) LV diastolic function, (e) left atrial (LA) structure, and (f) pulmonary vascular resistance and systolic pressure, and right ventricular (RV) function. These data will be used to define the population distribution of these measures and to determine their relationship with cardiovascular risk factors, including hypertension, diabetes, coronary disease, renal insufficiency, and prognostically relevant biomarkers such as NT-proBNP and high sensitivity troponin T. The second aim is to characterize the cross-sectional relationship of ventricular with vascular abnormalities in the community setting and determine how these associations vary by gender and race/ethnicity. The study will investigate ventricular-arterial coupling in addition to the association of cardiac structure and function with arterial stiffness assessed by contemporaneous carotid-femoral pulse wave velocity, aortic morphology, and ankle-brachial index. The third aim is to prospectively examine the extent to which these non-invasive measures associate with incident HF and determine the degree to which these associations vary by gender and race/ethnicity. This study will assess the incremental value of LV deformation, pulmonary pressure and vascular resistance, and RV function in predicting risk of HF beyond LV structure and conventional measures of systolic and diastolic function. In accomplishing these objectives, this study is developing an echo imaging database that will facilitate future investigations to: 1) compare these echo measures both to studies previously performed in the ARIC Jackson cohort (1993–1995) and to studies in complementary cohorts; and 2) evaluate novel strain-based and 3D measures of cardiac function, including the LA and RV.
Echocardiography Timeline
Development of the imaging and analysis protocol, Field Center Echocardiography Manual of Operations, Reading Center Manual of Operations, hiring of Field Center sonographers, and purchase of uniform Field Center echo imaging equipment occurred between November 2010 and April 2011 (Figure 1). Training and certification of sonographers occurred in April 2011. Pilot testing occurred from May to June 2011, followed by the initiation of ARIC Visit 5 in June 2011, which is expected to continue through September 2013.
Figure 1.

Outline of the overall design of the ARIC echo study. *End date for Visit 5 is approximate. FC – field center.
Data Recording and Transmission
All echos are performed using dedicated Philips iE33 Ultrasound systems with Vision 2011 and the X5-1 xMatrix transducer for 2D, Doppler, and 3D data acquisition, purchased specifically for use in the ARIC study. Machines at all Field Centers were set to acquisition defaults as detailed in Table 1. Image acquisition was performed using a pre-programmed acquisition protocol which guided sonographers through each protocol required view as outlined in Table 2. All studies were acquired and stored digitally on a local PACs and transferred from Field Centers to a secure server at the ERC (Brigham and Women’s Hospital, Boston, MA) same day via a dedicated VPN connection, along with an electronic case report form containing information on demographics, anthropomorphic measures, and blood pressure at time of echo.
Table 1.
iE33 Ultrasound system image acquisition defaults for all ARIC echo studies.
| 2D images | Color Doppler | Spectral Doppler |
|---|---|---|
|
| ||
| H pen | Gain 65 | Compress 4 |
| Xres ON | Map 4 | Reject 4 |
| Elevation compounding ON | Smoothing 3 | Speed 100 mm/sec |
| Chroma 1 | Persistence OFF | |
| Gray scale 4 | ||
| Persistence low | ||
| Re-speed in the midline | ||
Table 2.
ARIC echo imaging protocol required views.
|
A. Brachial Blood pressure B. Parasternal Position |
|
| ☑ Parasternal long axis |
|
| ☑ Parasternal short axis – Aortic valve level |
|
| ☑ Parasternal short axis – Mitral valve level |
|
| ☑ Parasternal short axis – Papillary muscle level |
|
| ☑ Parasternal short axis – LV apex |
|
| C. Apical Position | |
|---|---|
| ☑ Apical 4 chamber view |
|
| ☑ Apical 4 chamber – focused on the RV |
|
| ☑ Apical 5 chamber view |
|
| ☑ Apical 2 chamber view |
|
| ☑ Apical 3 chamber view |
|
| D. Subcostal View | |
| ☑ Inferior vena cava |
|
BP – blood pressure; AV – aortic valve; PW – pulse wave; CW – continuous wave; RVOT – right ventricular outflow tract; LV – left ventricle; LA – left atrium; RV – right ventricle; RA – right atrium; LVOT – left ventricular outflow tract.
Image Acquisition Protocol and Techniques
The ARIC echocardiography imaging protocol is detailed in Table 2. Participant blood pressure is taken within 30 minutes of starting the echo and after the subject has been resting for 5 minutes. Electrocardiographic leads are placed on the subject prior to imaging and sonographers are instructed to ensure an adequate ECG signal with clearly identifiable QRS complex throughout the exam duration. All echos are obtained in a manner most consistent with good subject care.
For patients in sinus rhythm, at least three full cardiac cycles are recorded for each view, with recording beginning once the view is optimized. For subjects in atrial fibrillation, at least one 5 second acquisition per view is recorded. Sonographers did not record any measurements on the images, as all measurements are performed centrally at the ERC.
For 2D imaging, sonographers were instructed to continuously optimize both imaging depth and sector width to maintain a frame rate of 50–80 frames per second. As optimal visualization of endocardial borders is essential for quantitative analysis, sonographers were instructed to increase 2D gain if necessary to optimally demonstrate LV endocardial borders, particularly in the apical views, and to use harmonic imaging except in the unusual situation where this worsens endocardial border definition.
For all color Doppler imaging, the color Doppler Nyquist limit is set at 64 cm/sec. Color Doppler gain is set at a level just below the level at which random background noise is seen. Sonographers were proscribed from altering the color Doppler gain and the Nyquist limit from the ARIC protocol defaults. Color Doppler variance display is not utilized.
For spectral Doppler, sonographers ensure that the ultrasound beam is optimally aligned parallel to the direction of the blood flow of interest, and demonstrates a clear onset and end of flow. Sonographers continuously optimize the baseline shift and velocity range such that the spectral envelope occupies approximately three-fourths of the display. All spectral Doppler acquisitions are performed with the following ARIC protocol defaults: (1) sweep speed 100 cm/sec, and (2) sample volume length 3mm [for pulsed wave Doppler].
For tissue Doppler imaging (TDI), the tissue Doppler sample volume is placed at the level of annulus (mitral or tricuspid depending on the view being obtained) and the baseline shift and velocity range optimized. All TDI is acquired with the following ARIC protocol defaults: (1) sweep speed 100 cm/sec, (2) sample volume length 5mm, and (3) filter setting of 100 Hz.
For 3D echo, a full-volume electrocardiogram (ECG)-gated 3D dataset of both the LV/LA and RV/RA is acquired from the apical position with the matrix array 3D transducer. During breath-hold, depth and sector width are adjusted to optimize spatial and temporal resolution within the sample volume. In the tissue harmonic mode, 4 wedge-shaped sub-volumes are acquired over 4 consecutive cardiac cycles and automatically integrated into a wide-angle pyramidal dataset with the highest frame rate achievable (20–26 Hz in our study).
Measurement Protocol
All conventional echo measures are performed using a proprietary validated echo analysis software, which directly inputs and tracks measurement data into an automated database system, with each measurement linked to a JPEG image of the associated tracing for later review by cardiologist over-readers. Myocardial deformation analysis is performed utilizing the TomTec Cardiac Performance Analysis package (Munich, Germany), a validated vendor independent software package for echo speckle tracking analyses of strain and strain rate. All quantitative measures are performed in a modular fashion by 4 analysts (Figure 2), such that for any given measure the same analyst performs that measure for all echo studies. All measurements are performed in triplicate.
Figure 2.
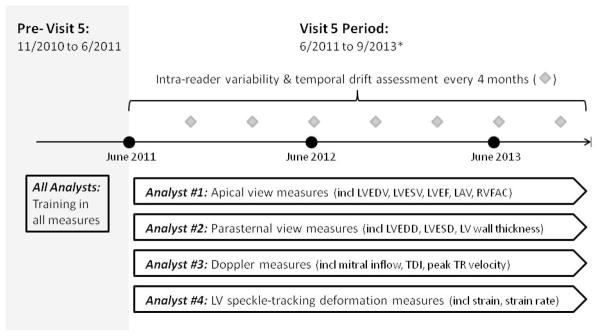
Illustration of the modular analysis approach employed in the ARIC echo study and the timing of serial analyst variability testing during the Visit 5 period. *End date for Visit 5 is approximate.
As outlined in Table 3, LV dimensions, wall thickness, anterior-posterior left atrial (LA) dimension, and outflow tract diameter are measured from the parasternal long axis view according to the recommendations of the American Society of Echocardiography (ASE).12 LV mass is calculated from LV linear dimensions and indexed to body surface area as recommended by ASE guidelines. LV hypertrophy (LVH) is defined as LV mass indexed to body surface area (LV mass index, LVMi) >115 g/m2 in men or >95 g/m2 in women. Relative wall thickness (RWT) was calculated from LV end-diastolic dimension and posterior wall thickness. LV volumes are calculated by the modified Simpson’s method using the apical 4 and 2 chamber views, and LV ejection fraction (LVEF) is derived from volumes in the standard manner.
Table 3.
ARIC echo primary and derived measures.
| Primary measures | Derived measures | |
|---|---|---|
| LV structure | LV end-diastolic dimension (PLAX) LV end-systolic dimension (PLAX) LV wall thickness (PLAX) LV end-diastolic volume (A4C, A2C) LV end-systolic volume (A4C, A2C) LV end-diastolic volume (3D) LV end-systolic volume (3D) |
LV mass (g) = 0.8*{1.04*[(LVEDD+ASWT+PWT)3 –(LVEDD)3]}+0.6 LV mass index (g/m2) = LV mass/BSA LV relative wall thickness = (2*PWT)/LVEDD Mean LV wall thickness (cm) = (PWT+ASWT)/2 |
| LV systolic function | TDI s’ (A4C) Longitudinal S, SR (A4C, A2C) Radial & circumferential S, SR (PSAX) |
Ejection fraction (%) = 100 *(LVEDV – LVESV)/LVEDV Ejection fraction (by 3D) |
| LV dyssynchrony | Standard deviation in time to peak longitudinal strain (12 segemnts), radial strain (6 segments), and circumferential strain (6 segments) | |
| LV diastolic function | Mitral annular TDI e′ (A4C) E wave, A wave, DT (A4C) |
E/A ratio = E wave/A wave E/E′ ratio = E wave/TDI e′ |
| LV-arterial interaction | Arterial elastance (EA) = (SBP × 0.9)/SV LV end-systolic elastance (EES) = [DBP – (ENd(est) x SBP X 0.9)]/[SV/BSA x ENd(est)], where: ENd(est) = 0.0275 – 0.165 × EF + 0.3656 × (DBP/SBP) + 0.515 × ENd(avg), and ENd(avg) = Σai x tNdi where tNd = R→onset/R→end, and ai are (0.35695, −7.2266, 74.249, −307.39, 684.54, − 856.92, 571.95, −159.1) for i = 0 to 7 EA/EES ratio = EA/EES |
|
| Valvular Function | Aortic Valve: LVOT VTI, AV peak velocity, mean gradient, and VTI (A5C) Mitral Valve: MR jet area (A4C) |
MR jet area-to-LA area ratio = MR jet area (cm2)/Left atrial area (cm2)*100 |
| LA structure & function | LA A-P dimension (PLAX) LA volume (A4C, A2C) LA area (A4C, A2C) |
LA volume index (ml/m2) = LA volume/BSA |
| Pulmonary vascular measures | TR velocity (A4C) RVOT VTI (PSAX) |
Peak RV-RA gradient (mmHg) = 4*(peak TR velocity)2 Pulmonary Vascular Resistance (Wood Units) = 0.1618 + 10.006 * (peak TR velocity/RVOT VTI) |
| RV systolic function | RV end-diastolic area (A4C) RV end-systolic area (A4C) Tricuspid annular TDI s’ (A4C) |
RV fractional area change (%) = 100*(RVEDA – RVESA)/RVEDA |
PLAX – parasternal long axis view; A4C – apical 4-chamber view; apical 2-chamber view; PSAX – parasternal short axis view; LVEDD – LV end-diastolic dimension; ASWT – anteroseptal wall thickness; PWT – posterior wall thickness; BSA – body surface area; TDI – tissue Doppler imaging; s′ – peak systolic mitral annular velocity; S – strain; SR – strain rate; LVEDV – LV end-diastolic volume; LVESV – LV end-systolic volume; e′ – peak early diastolic mitral annular velocity; DT – deceleration time; SBP – systolic blood pressure; DBP – diastolic blood pressure; SV – stroke volume; LVOT – LV outflow tract; VTI – velocity-time integral; AV – aortic valve; MR – mitral regurgitation; A-P – anterior-posterior; RVOT – RV outflow tract; TR – tricuspid regurgitation; RVEDA – RV end-diastolic area; RVESA – RV end-systolic area. Speckle-tracking analysis was performed on images acquired at 50–80 frames per second.
LA volume was measured by the method of discs using apical 4- and 2-chamber views at an end-systolic frame preceding mitral valve opening, and was indexed to body surface area to derive LA volume index (LAVi). Mitral regurgitation (MR) is categorized by tracing the jet area (obtained with color Doppler imaging) occupying the left atrium in 4- and 2-chamber views and was expressed as a proportion of LA area. The presence of an eccentric jet raised the grade of MR by 1 degree. Early transmitral velocity (E wave) was measured by pulsed wave Doppler from the apical 4-chamber view with the sample volume positioned at the tip of the mitral leaflets. Peak lateral and septal mitral annular relaxation velocities (e′) were assessed using TDI. E/e′ ratio was calculated as E wave divided by e′.13
In accordance with ASE guidelines,14 RV function was assessed using the tricuspid annular peak systolic velocity (TA s’) measured from the lateral tricuspid annulus, and RV fractional area change (RVFAC) calculated as the percent change in cavity area from end-diastolic to end-systolic tracings of the RV cavity in the apical 4 chamber view. From the parasternal short axis view at the level of the aortic valve, the RV outflow tract time velocity integral (RVOT VTI) by pulse Doppler is measured as a correlate of RV stroke volume. Peak tricuspid regurgitation (TR) velocity is measured and peak RV-to-right atrial systolic gradient calculated as 4·(peak TR velocity)2. Pulmonary vascular resistance is calculated using the RVOT VTI/TR velocity ratio, as previously published.15
To assess ventricular-arterial coupling, effective arterial elastance (EaI) is being estimated as end-systolic pressure divided by stroke volume, determined using the Simpson’s method of discs and indexed to body surface area. LV end-systolic pressure is estimated as 0.9 multiplied by brachial systolic blood pressure performed at the time of echocardiography.16 LV end-systolic elastance (EesI) is estimated from the modified single-beat method using brachial pressures, stroke volume calculated from LV volumes, pre-ejection and total ejection times measured from spectral Doppler tracings, LVEF, and an estimated normalized ventricular elastance at arterial end diastole, and is indexed to body surface area.17
Deformation analysis is performed using the TomTec Cardiac Performance Analysis package, which has been validated against MRI and sono-micrometry.18,19 Analysis is performed on 2D images acquired at a frame rate of 50–80 frames per second. Longitudinal strain (LS) is measured by tracing the endocardial borders in the apical 4-chamber and 2-chamber views, while circumferential (CS) and radial strain (RS) are measured by tracing endocardial and epicardial borders from the parasternal short axis view at the level of the mid-papillary muscle. Studies with inadequate image quality are not measured and are defined as studies with more than 1 segment dropout or significant foreshortening of the LV. The endocardial border is traced at an end-diastolic frame in apical views, where end-diastole is defined as the frame after mitral valve closure, and at end-systole in short axis views. The software tracks speckles along the endocardial and epicardial borders throughout the cardiac cycle. Peak longitudinal and circumferential strain and strain rate are computed automatically, generating regional data from 6 segments and an average value for each view.
Analysis of 3D datasets will be performed using the TomTec software (Image-Arena VA, TomTec, Corp). Epicardial and endocardial borders at end-diastole are automatically traced by the software with minimal manual adjustment. LVEDV, LVESV, LVEF, global 3D strains, 3D longitudinal, circumferential, and radial strains are computed automatically.
Over-Reading
All echocardiograms are over-read by a Board Certified staff cardiologist at the Brigham and Women’s Hospital with COCATS Level 3 advanced training in echocardiography and/or ASE Board Certification in Comprehensive Adult Echocardiography. Over-readers are presented with the following key quantitative measurements made by technicians: LV end-diastolic dimension, wall thickness, end-diastolic volume, end-systolic volume, LVEF, LAVi, RVFAC, MR jet area-to left atrial area ratio, aortic valve peak antegrade velocity, and TR velocity. Over-readers review echocardiograms to confirm the accuracy of these measurements and to identify clinically important findings not otherwise represented by the technical measurements. Such clinically important findings include significant aortic insufficiency, mitral stenosis, pulmonary hypertension, or right ventricular enlargement. Over-readers must approve analysis for each study prior to study data being finalized for transfer to the ARIC Coordinating Center.
Following data transfer, the ARIC Coordinating Center incorporates LVEF, LV end-diastolic dimension, and LV wall thickness into a summary letter of Visit 5 test results, which is sent to participants as a courtesy. Additional clinically relevant findings identified by ERC over-readers are also reported in this letter.
Training and Certification
In April 2011, all ARIC Field Center sonographers underwent an intensive 3 day centralized training at the Brigham and Women’s Hospital, consisting of both: (1) didactic sessions reviewing the exam protocol, machine presets, required views, and image acquisition/optimization tips, and (2) hands-on sessions led by an ERC senior sonographer to facilitate image optimization.
In the weeks following training, all sonographers were required to perform and submit two complete echo studies in accordance with the study protocol specifications and using study echo equipment. Studies were reviewed at the ERC and scrutinized for adherence to protocol, acquisition of all required views, and image quality. Following submission of two adequate echo studies, sonographers were certified. Three new sonographers started during the Visit 5 period after initial study start-up. All underwent the certification process outlined above.
Quality Assurance Procedures
For every study performed during the Visit 5 period, sonographers receive directed feedback from the ERC regarding study quality, typically within a week of study performance, including an itemized list of study deficits if present. In addition to over-reading of all studies by staff cardiologists, the ERC assesses measurement variability at regular intervals during the study period. Given the ERC modular analysis model, whereby each ERC technician is responsible for specific quantitative measures for each echo, the focus of the ERC quality assurance procedures is intra-observer variability and temporal drift. Analysts must re-analyze previously completed studies, blinded to participant ID and prior measurement values. Variability is assessed at 4 month intervals in both: (1) a set of 20 studies blindly repeated throughout study period for assessment of temporal drift, and (2) a set of 20 random ARIC studies newly selected at each reproducibility cycle. Overall, reproducibility assessments will be performed in an estimated 160 unique studies during the Visit 5 period.
Reproducibility metrics for key conventional echo measures from the first 3 assessment cycles are provided in Table 4. Analysis of cardiac deformation started approximately 9 months after conventional 2D and Doppler analysis. Findings from the first strain reproducibility assessment demonstrated the following: mean ± standard deviation of the difference between measurements of 0.2±1.4% for LS in the apical 4 chamber view, 0.8±1.2% for LS in the apical 2 chamber view, and 1.7±2.8% for CS; coefficient of variation (CV) of 7.7% for LS in the apical 4 chamber view, 6.4% for LS in the apical 2 chamber view, and 9.7% for CS.
Table 4.
Intra-observer variability and temporal drift metrics for key echocardiographic measures.
| Cycle 1 | Cycle 2 | Cycle 3 | ||||||||||
|---|---|---|---|---|---|---|---|---|---|---|---|---|
| Mean | Bias±S.D. | CV | ICC | Mean | Bias±S.D. | CV | ICC | Mean | Bias±S.D. | CV | ICC | |
| Analyst 1 | ||||||||||||
| LVEDV (ml) | 95.7 | −4.3±7.8 | 8.2% | 0.98 | 99.9 | −12.7±11.1 | 11.2% | 0.96 | 94.9 | −2.8±9.5 | 10.0% | 0.97 |
| LVESV (ml) | 41.4 | 0.4±5.2 | 12.5% | 0.99 | 42.5 | −1.8±5.2 | 12.3% | 0.98 | 42.0 | −0.7±5.5 | 13.2% | 0.98 |
| LVEF (%) | 59.5 | −2.3±5.2 | 8.7% | 0.93 | 59.5 | −2.8±6.0 | 10.0% | 0.88 | 58.6 | −0.4±4.9 | 8.4% | 0.93 |
| Analyst 2 | ||||||||||||
| LVEDD (cm) | 4.74 | 0.14±0.24 | 5.1% | 0.95 | 4.72 | −0.05±0.20 | 4.2% | 0.97 | 4.75 | −0.10±0.21 | 4.5% | 0.97 |
| LVESD (cm) | 3.22 | 0.09±0.14 | 4.3% | 0.99 | 3.12 | 0.11±0.26 | 8.4% | 0.96 | 3.18 | 0.01±0.26 | 8.1% | 0.96 |
| IVS (cm) | 0.92 | −0.00±0.10 | 11.2% | 0.84 | 0.93 | −0.02±0.09 | 9.8% | 0.89 | 0.91 | 0.03±0.09 | 9.5% | 0.88 |
| LV mass (g) | 156.7 | −3.2±20.2 | 12.9% | 0.97 | 157 | −4.0±13.9 | 8.9% | 0.99 | 156.1 | −2.1±10.2 | 6.5% | 0.99 |
| Analyst 3 | ||||||||||||
| E wave (cm/s) | 67.0 | 2.1±2.2 | 3.3% | 0.98 | 68.6 | −1.1±1.9 | 2.7% | 0.99 | 67.6 | 0.9±2.5 | 3.7% | 0.98 |
| A wave (cm/s) | 61.3 | 0.3±1.7 | 2.8% | 0.99 | 62.6 | −2.5±1.3 | 2.1% | 0.99 | 62.1 | −1.6±1.8 | 2.9% | 0.99 |
| e′ lateral (cm/s) | 10.3 | −0.3±0.6 | 5.6% | 0.99 | 10.2 | 0.1±0.8 | 8.1% | 0.97 | 10.3 | −0.2±0.6 | 6.3% | 0.98 |
| e′ septal (cm/s) | 8.5 | 0.2±0.5 | 5.7% | 0.98 | 8.3 | 0.7±0.4 | 4.5% | 0.99 | 8.4 | 0.4±0.6 | 7.2% | 0.96 |
| E/e′ ratio | 7.2 | 0.4±0.3 | 3.8% | 0.99 | 7.5 | −0.2±0.6 | 7.5% | 0.98 | 7.2 | 0.3±0.6 | 8.5% | 0.97 |
| TR vel (m/s) | 215.3 | −13.2±4.6 | 2.1% | 0.95 | 217.2 | −17.0±8.5 | 4.0% | 0.87 | 216.4 | −15.3±5.1 | 2.3% | 0.97 |
CV – coefficient of variation; ICC – intraclass correlation coefficient; LVEDV – LV end-diastolic volume; LVEDV – LV end-systolic volume; LVEF - LV ejection fraction; LVEDD – LV end-diastolic dimension; LVESD – LV end-systolic dimension; IVS – interventricular septal wall thickness; E wave – peak early diastolic transmitral flow velocity; A wave – peak late diastolic transmitral flow velocity; e′ lateral – peak early diastolic mitral annular tissue velocity at lateral mitral annulus; e′ septal – peak early diastolic mitral annular tissue velocity at septal mitral annulus; TR – tricuspid regurgitation..
Statistical Approach and Power Considerations
Standard descriptive statistics will be used to define the population distribution of echocardiographic measures. The association of these measures with demographic, clinical, and physiologic variables will be assessed using correlation analysis, in addition to univariable and multivariable regression. The relationship between cardiac structural and functional measures and clinical outcomes will be evaluated using univariable and multivariable Cox proportional hazard regression models. Intercurrent events expected to alter cardiac structure and function, including definite or probable MI or coronary revascularization, will be introduced into Cox proportional hazard regression models as time-varying covariates. Additional sensitivity analyses will exclude individuals with intercurrent events. Stratified analyses will also be performed by gender and race/ethnicity. Effect modification by gender or race/ethnicity will be assessed by introducing interaction terms into multivariable models. Analyses will be performed with echocardiographic measures modeled as continuous variables with non-linear relationships assessed using polynomial terms, as quartiles, and as dichotomous. Model assumptions will be assessed using standard techniques.
This study will be one of the largest and most comprehensive echocardiographic datasets in an elderly cohort, including elderly women and African Americans. Multiple analyses are therefore expected, including descriptive analyses to establish normative values, cross-sectional association studies to investigate predictors and correlates, and time-to-event analyses to assess the relationship to clinical outcomes. Echocardiographic measures are inter-correlated, and for statistical purposes do not represent completely independent hypotheses. No unitary approach to adjustment for multiple testing is pre-specified for all anticipated analyses. Instead, the most appropriate approach will be selected for each analysis. Similarly, study power will vary broadly between analyses, as will power to detect effect modification by gender or race/ethnicity. We anticipate the study power to be most limited for the prospective association of measures of cardiac structure and function with incident cardiovascular events, including incident HF. Power calculations for these time to event analyses were performed for log-rank tests with significance defined as a two-sided p-value <0.05, and with echocardiography measures modeled dichotomously, using the stpower function in Stata 11. ARIC participants will be followed for incident HF events over 5 years of follow-up after Visit 5 (through 2017). Based on observed HF incidence in ARIC from 2004 – 2008, we estimate an incidence of HF of ~2%/year, with approximately 726 incident cases of HF during follow-up. This estimate is conservative, as events will also accumulate during the 2.5 year period when Visit 5 is ongoing. Assuming a study population of approximately 6,000, our projected power based on effect size, prevalence of ‘abnormal’, and projected follow-up time is shown in the Table 5. These power estimates are conservative as modeling echocardiographic measures as continuous variables (as opposed to dichotomous) will likely result in greater power. Power estimates for interaction testing by gender and race/ethnicity are provided in the Supplemental Data section.
Table 5.
Power estimates for time-to-event analysis by log-rank test of the association of echocardiographic measures of cardiac structure and function with incident HF at 5 year follow-up at a significance level defined as a two-sided p value of <0.05. These power estimates model echocardiographic measures as dichotomous variables and assume approximately 726 incident cases of HF during follow-up, based on an estimated incidence of HF of ~2%/year, in a study population of 6,000. Power calculations were performed using the stpower function in Stata 11.
| Prevalence of dysfunction | Hazard Ratio
|
||
|---|---|---|---|
| 1.2 | 1.3 | 1.4 | |
| 17% | 0.50 | 0.83 | 0.97 |
| 29% | 0.65 | 0.94 | 0.99 |
| 38% | 0.71 | 0.96 | 0.99 |
| 45% | 0.72 | 0.96 | 0.99 |
Comparison of ARIC to Other Population-Based Echocardiographic Studies
Compared to existing population-based echo studies, the ARIC echo study will be one of the largest (Table 6).20–33 ARIC is also studying one of the most elderly cohorts with a sizeable proportion of African-American participants. The ARIC echo study will be uniquely comprehensive, utilizing 2D, 3D, Doppler, tissue Doppler, and speckle tracking echocardiography to quantify LV structure and function, ventricular deformation, pulmonary arterial pressure and vascular resistance, and RV function.
Table 6.
Summary of some major population studies which incorporated echocardiographic examination.
| Study | Dates | Sampling Comments | n | Mean age | % female | Non-white | TDI | Pulm vasc/RV assessment | Strain | 3D |
|---|---|---|---|---|---|---|---|---|---|---|
| Framingham Heart Study20 | 1979–1983 | 4,977 | ~51±15 | 55% | NR | No | No | No | No | |
|
| ||||||||||
| Flemish Study on Environment, Genes, and Health Outcomes (FLEMENGHO)21 | 1985–2005 | 539 | 52.4±15.3 | 51% | NR | Yes | No | Yes | No | |
|
| ||||||||||
| Cardiovascular Health Study22,23 | 1987–1993 | 5,201 | 73±5.6 | 57% | 7% | No | No | No | No | |
|
| ||||||||||
| CARDIA24,25 | 1990–1991; | 4,243 | (25–36) | 55% | 48%‡ | No | No | No | No | |
| 1995– 1996 | 1,536 | ~30±3 | 54% | 41%‡ | ||||||
|
| ||||||||||
| Rotterdam Study26 | 1990–1993 | 7,983 | 70.5±9.6 | 61% | NR | No | No | No | No | |
|
| ||||||||||
| Strong Heart Study27 | 1993–1995 | 3,501 | ~60±8 | ~64% | 100%* | No | No | No | No | |
|
| ||||||||||
| MONICA-KORA28 | 1984– 1985; 1994–1995 | 2,200 | 51±14 | 51% | NR | Yes | No | No | No | |
|
| ||||||||||
| Echocardiographic Heart of England Screening study 29 | 1995–1999 | PCP | 3,960 | 61±11 | 50% | 3% | No | No | No | No |
|
| ||||||||||
| Olmsted County Study30 | 1997–2000 | 2,042 | 62.8±10.6 | ~53% | NR | Yes | Yes§ | No | No | |
|
| ||||||||||
| LOLIPOP31 | 2004–2007 | PCP Healthy | 453 | 51 | 44% | 57%† | Yes | No | No | No |
|
| ||||||||||
| Nord-Trøndelag Health (HUNT) study32 | 2006–2008 | Healthy | 1,266 | ~49±13.7 | 52% | NR | Yes | Yes§ | No | No |
|
| ||||||||||
| Gutenberg Heart Study33 | 2007–2008 | 5,000 | 56±11 | 49% | NR | No | No | No | No | |
|
| ||||||||||
| ARIC | 2011–2013 | 6,000+ | ~76±5 | ~59% | 24%‡ | Yes | Yes | Yes | Yes | |
PCPs – participants sampled from primary care clinics; Healthy – participants selected to be free of cardiovascular disease or traditional cardiovascular risk factors; NR – not reported;
non-whites were Native Americans;
non-whites were predominantly South Asians;
non-whites were predominantly African Americans;
peak tricuspid regurgitation jet velocity obtained
Conclusions
The ARIC echo study will uniformly acquire and measure cardiac structure and function, including novel assessments of myocardial deformation, in approximately 6,000 elderly cohort participants. Comprehensive echo in this large, well-phenotyped, elderly, biracial cohort offers the unique opportunity for an integrated characterization of the perturbations of cardiac structure and function, and of ventricular-arterial interactions, in advanced age. This comprehensive cardiovascular assessment is necessary to: (1) define age-specific normative values for echo measures of cardiac structure and function in the elderly; (2) further elucidate the mechanisms by which HF risk factors, such as hypertension, diabetes, obesity, and renal insufficiency, influence cardiac structure and function – and HF risk – in older adults; and (3) determine how these age and risk factor related perturbations differ in critically understudied populations, namely women and African Americans.
Supplementary Material
Acknowledgments
The Atherosclerosis Risk in Communities Study is carried out as a collaborative study supported by National Heart, Lung, and Blood Institute contracts (HHSN268201100005C, HHSN268201100006C, HHSN268201100007C, HHSN268201100008C, HHSN268201100009C, HHSN268201100010C, HHSN268201100011C, and HHSN268201100012C). This work was also supported by National Heart, Lung, and Blood Institute cooperative agreement NHLBI-HC-11-08 (Brigham and Women’s Hospital) and grant 1K08HL116792-01A1 (A.M.S.). The authors thank the staff and participants of the ARIC study for their important contributions.
Appendix
ARIC Echocardiography Committee Members
Scott Solomon MD (Brigham and Women’s Hospital, Boston, MA), Chair
Amil Shah MD MPH (Brigham and Women’s Hospital, Boston, MA), Co-Chair
Kenneth Butler PhD (University of Mississippi, Jackson, MS)
Aaron Folsom MD (University of Minnesota, Minneapolis, MN)
Ervin Fox MD MPH (University of Mississippi, Jackson, MS)
Dalane Kitzman MD (Wake Forest University School of Medicine, Winston-Salem, NC)
Suma Konety MD MS (University of Minnesota, Minneapolis, MN)
Laura Loehr MD PhD (University of North Carolina at Chapel Hill, Chapel Hill, NC)
Kunihiro Matsushita MD PhD (Johns Hopkins University, Baltimore, MD)
Hanyu Ni MD (National Heart, Lung, and Blood Institute, Bethesda, MD)
Lisa Reeves (University of North Carolina at Chapel Hill, Chapel Hill, NC)
ARIC Echocardiography Reading Center Staff (Brigham and Women’s Hospital, Boston, MA)
-
Project Leadership
Scott Solomon MD, Director
Amil Shah MD MPH, Co-Director
-
Project Operations
Keri Schoonerman MS, Operations Manager
Karen Smith, Project Coordinator
-
Analysts
Guichu Li, PhD RDCS
Li Liu, MD PhD RDCS
Serhiy Lukenovsky MD
Jennifer Qui MD RDCS
-
Cardiologist Over-Readers
Susan Cheng MD MMSc
Judy Mangion MD
Amil Shah MD MPH
Hicham Skali MD MSc
Justina Wu MD PhD
-
Biostatistician
Hongshu Guan MS PhD
ARIC Echocardiography Field Center Staff
| Field Center | Echo Director | Sonographers |
|---|---|---|
| Forsyth County, NC | Dalane Kitzman MD | Heather Duncan Kathy Stewart |
| Jackson, MS | Kenneth Butler PhD | Chuck Gary Laura Stewart |
| Minneapolis, MN | Suma Konety MD | Carla Belisle Marty Stolzman Nik Illies John Bruhn |
| Washington County, MD | Kunihiro Matsushita MD PhD | Gordon Harris Melisa Lavery Jessica Comly |
Footnotes
Disclosures
The authors report no relevant disclosures.
References
- 1.American Heart Association. Heart disease and stroke statistics – 2009 update. Dallas, Texas: American Heart Association; 2009. [Google Scholar]
- 2.Bhatia RS, Tu JV, Lee DS, Austin PC, Fang J, Haouzi A, Gong Y, Liu P. Outcome of heart failure with preserved ejection fraction in a population-based study. New Engl J Med. 2006;355:260–9. doi: 10.1056/NEJMoa051530. [DOI] [PubMed] [Google Scholar]
- 3.Owan TE, Hodge DO, Herges RM, Jacobsen SJ, Roger VL, Redfield MM. Trends in prevalence and outcome of heart failure with preserved ejection fraction. New Engl J Med. 2006;355:251–9. doi: 10.1056/NEJMoa052256. [DOI] [PubMed] [Google Scholar]
- 4.Vasan RS, Larson MG, Benjamin EJ, Evans JC, Reiss CK, Levy D. Congestive heart failure in subjects with normal versus reduced left ventricular ejection fraction: prevalence and mortality in a population-based cohort. J Am Coll Cardiol. 1999;33:1948–55. doi: 10.1016/s0735-1097(99)00118-7. [DOI] [PubMed] [Google Scholar]
- 5.Hsich EM, Pina IL. Heart failure in women: a need for prospective data. J Am Coll Cardiol. 2009;54:491–8. doi: 10.1016/j.jacc.2009.02.066. [DOI] [PubMed] [Google Scholar]
- 6.Yancy CW. Heart failure in African Americans: pathophysiology and treatment. J Card Fail. 2003;9:s210–5. doi: 10.1054/s1071-9164(03)00590-6. [DOI] [PubMed] [Google Scholar]
- 7.Bahrami H, Kronmal R, Bluemke DA, Olson J, Shea S, Liu K, Burke GL, Lina JAC. Difference in the incidence of congestive heart failure by ethnicity: the Multi-Ethnic Study of Atherosclerosis. Arch Intern Med. 2008;168:2138–45. doi: 10.1001/archinte.168.19.2138. [DOI] [PMC free article] [PubMed] [Google Scholar]
- 8.The ARIC Investigators. The Atherosclerosis Risk in Communities (ARIC) study: design and objectives. Am J Epidemiol. 1989;129:687–702. [PubMed] [Google Scholar]
- 9.Loehr LR, Rosamond WD, Chang PP, Folsom AR, Chambless LE. Heart failure incidence and survival (from the Atherosclerosis Risk in Communities study) Am J Cardiol. 2008;101(7):1016–1022. doi: 10.1016/j.amjcard.2007.11.061. [DOI] [PubMed] [Google Scholar]
- 10.White A, Folsom A, Chambless L, Sharret R, Yang K, Conwill D, Higgins M, Dale Williams O, Tyroler HA the ARIC Investigators. ScienceDirect - Journal of Clinical Epidemiology : Community surveillance of coronary heart disease in the Atherosclerosis Risk in Communities (ARIC) Study: Methods and initial two years’ experience. Journal of clinical Epidemiology. 1996;49(2):223–233. doi: 10.1016/0895-4356(95)00041-0. [DOI] [PubMed] [Google Scholar]
- 11.Rosamond WD, Chang PP, Baggett C, Johnson A, Bertoni AG, Shahar E, Deswal A, Heiss G, Chambless LE. Classification of heart failure in the Atherosclerosis Risk in Communities (ARIC) study: A comparison of diagnostic criteria. Circ Heart Fail. 2012;5:152–9. doi: 10.1161/CIRCHEARTFAILURE.111.963199. [DOI] [PMC free article] [PubMed] [Google Scholar]
- 12.Lang RM, Bierig M, Devereux RB, et al. Recommendations for chamber quantification: a report from the American Society of Echocardiography’s Guidelines and Standards Committee and the Chamber Quantification Writing Group, developed in conjunction with the European Association of Echocardiography, a branch of the European Society of Cardiology. J Am Soc Echocardiogr. 2005;18:1440–63. doi: 10.1016/j.echo.2005.10.005. [DOI] [PubMed] [Google Scholar]
- 13.Nagueh SF, Appleton CP, Gillebert TC, Marino PN, Oh JK, Smiseth OA, Waggoner AD, Flachskampf FA, Pellikka PA, Evangelista A. Recommendations for the evaluation of left ventricular diastolic function by echocardiography. J Am Soc Echocardiogr. 2009;22:107–33. doi: 10.1016/j.echo.2008.11.023. [DOI] [PubMed] [Google Scholar]
- 14.Rudski LG, Lai WW, Afilalo J, Hua L, Handschumacher MD, Chandrasekaran K, Solomon SD, Louie EK, Schiller NB. Guidelines for the echocardiographic assessment of the right heart in adults: A report from the American Society of Echocardiography. J Am Soc Echocardiogr. 2010;23:685–713. doi: 10.1016/j.echo.2010.05.010. [DOI] [PubMed] [Google Scholar]
- 15.Abbas AE, Fortuin D, Schiler NB, Appleton CP, Moreno CA, Lester SJ. A simple method for noninvasive estimation of pulmonary vascular resistance. J Am Coll Cardiol. 2003;41:1021–7. doi: 10.1016/s0735-1097(02)02973-x. [DOI] [PubMed] [Google Scholar]
- 16.Kelley RP, Ting CT, Yang TM, Liu CP, Maughan WL, Chang MS, Kass DA. Effective arterial elastance as index of arterial vascular load in humans. Circulation. 1992;86:513–21. doi: 10.1161/01.cir.86.2.513. [DOI] [PubMed] [Google Scholar]
- 17.Chen C-H, Fetics B, Nevo E, Rochitte CE, Chiou KR, Ding PA, Kawaguchi M, Kass DA. Noninvasive single-beat determination of left ventricular end-systolic elastance in humans. J Am Coll Cardiol. 2001;38:2028–34. doi: 10.1016/s0735-1097(01)01651-5. [DOI] [PubMed] [Google Scholar]
- 18.Amundsen BH, Helle-Velle T, Edvardsen T, et al. Noninvasive myocardial strain measurement by speckle tracking echocardiography: validation against sonomicrometry and tagged magnetic resonance imaging. J Am Coll Cardiol. 2006;47:789–793. doi: 10.1016/j.jacc.2005.10.040. [DOI] [PubMed] [Google Scholar]
- 19.Pirat B, Khoury DS, Hartley CJ, et al. A novel feature-tracking echocardiographic method for the quantification of regional myocardial function: validation in an animal model of ischemia-reperfusion. J Am Coll Cardiol. 2008;51:651–9. doi: 10.1016/j.jacc.2007.10.029. [DOI] [PMC free article] [PubMed] [Google Scholar]
- 20.Levy D, Savage DD, Garrison RJ, Anderson KM, Kannel WB, Castelli WP. Echocardiographic criteria for left ventricular hypertrophy: The Framingham Heart Study. Am J Cardiol. 1987;59:956–60. doi: 10.1016/0002-9149(87)91133-7. [DOI] [PubMed] [Google Scholar]
- 21.Kuznetsova T, Herbots L, Lopez B, Jin Y, Richart T, Thijs L, Gonzalez A, Herregods M-C, Fagard RH, Diez J, Staessen JA. Prevalence of left ventricular diastolic dysfunction in a general population. Circ Heart Fail. 2009;2:105–12. doi: 10.1161/CIRCHEARTFAILURE.108.822627. [DOI] [PubMed] [Google Scholar]
- 22.Gardin JM, Wong N, Bommer W, Klopfenstein HS, Smith V-E, Tabatznik B, Siscovick D, Lobodzinski S, Anton-Culver H, Manolio TA. Echocardiographic design of a multicenter investigation of free-living elderly subjects: the Cardiovascular Health Study. J Am Soc Echocardiogr. 1992;5:63–72. doi: 10.1016/s0894-7317(14)80105-3. [DOI] [PubMed] [Google Scholar]
- 23.Aurigemma GP, Gottdiener JS, Shemanski L, Gardin J, Kitzman D. Predictive value of systolic and diastolic function for incident congestive heart failure in the elderly: the Cardiovascular Health Study. J Am Coll Cardiol. 2001;37:1042–8. doi: 10.1016/s0735-1097(01)01110-x. [DOI] [PubMed] [Google Scholar]
- 24.Gardin JM, Wagenknecht LE, Anton-Culver H, Flack J, Gidding S, Kurosaki T, Wong ND, Manolio TA. Relationship of cardiovascular risk factors to echocardiographic left ventricular mass in healthy young black and white adult men and women: the CARDIA study. Circulation. 1995;92:380–7. doi: 10.1161/01.cir.92.3.380. [DOI] [PubMed] [Google Scholar]
- 25.Gardin JM, Brunner D, Schreiner PJ, Xie X, Reid CL, Ruth K, Bild DE, Gidding SS. Demographics and correlates of five-year change in echocardiographic left ventricular mass in young black and white adult men and women: the Coronary Artery Risk Development in Young Adults (CARDIA) study. J Am Coll Cardiol. 2002;40:529–35. doi: 10.1016/s0735-1097(02)01973-3. [DOI] [PubMed] [Google Scholar]
- 26.Mosterd A, Hoes AW, de Bruyne MC, Deckers JW, Linker DT, Hofman A, Grobbee DE. Prevalence of heart failure and left ventricular dysfunction in the general population. Eur Heart J. 1999;20:447–55. [PubMed] [Google Scholar]
- 27.Devereux RB, Roman MJ, de Simone G, O’Grady MJ, Paranicas M, Yeh JL, Fabsitz RR, Howard BV. Relations of left ventricular mass to demographics and hemodynamic variables in American Indians: the Strong Heart Study. Circulation. 1997;96:1416–23. doi: 10.1161/01.cir.96.5.1416. [DOI] [PubMed] [Google Scholar]
- 28.Schunkert H, Doring A, Kuch B, Holmer S, Luchner A, Muscholl M, Fischer M, Hengstenberg C, Riegger GAJ, Hense H-W. Cardiovascular phenotypes and functional parameters in the general population – results of the MONICA/KORA studies. Gesundheitswesen. 2005;67:S74–8. doi: 10.1055/s-2005-858247. [DOI] [PubMed] [Google Scholar]
- 29.Davies MK, Hobbs FDR, Davis RC, Kenkre JE, Roalfe AK, Hare R, Wosornu D, Lancashire RJ. Prevalence of left-ventricular systolic dysfunction and heart failure in the Echocardiographic Heart of England Screening study: a population based study. Lancet. 2001;358:439–44. doi: 10.1016/s0140-6736(01)05620-3. [DOI] [PubMed] [Google Scholar]
- 30.Redfield MM, Jacobsen SJ, Burnett JC, Mahoney DW, Bailey KR, Rodeheffer RJ. Burden of systolic and diastolic ventricular dysfunction in the community: Appreciating the scope of the heart failure epidemic. JAMA. 2003;289:194–202. doi: 10.1001/jama.289.2.194. [DOI] [PubMed] [Google Scholar]
- 31.Chahal NS, Lim TK, Jain P, Chambers JC, Kooner JS, Senior R. Normative reference values for the tissue Doppler imaging parameters of left ventricular function: a population-based study. Eur J Echocardiogr. 2010;11:51–6. doi: 10.1093/ejechocard/jep164. [DOI] [PubMed] [Google Scholar]
- 32.Dalen H, Thorstensen A, Vatten LJ, Aase SA, Stoylen A. Reference values and distribution of conventional echocardiographic Doppler measures and longitudinal tissue Doppler velocities in a population free from cardiovascular disease. Circ Cardiovasc Imaging. 2010;3:614–22. doi: 10.1161/CIRCIMAGING.109.926022. [DOI] [PubMed] [Google Scholar]
- 33.Wild PS, Sinning CR, Roth A, Wilde S, Schnabel RB, Lubos E, Zeller T, Keller T, Lackner KJ, Blettner M, Vasan RS, Munzel T, Blankenberg S. Distribution and categorization of left ventricular measurements in the general population: Results for the population-based Gutenberg Heart Study. Circ Cardiovasc Imaging. 2010;3:604–13. doi: 10.1161/CIRCIMAGING.109.911933. [DOI] [PubMed] [Google Scholar]
Associated Data
This section collects any data citations, data availability statements, or supplementary materials included in this article.