

Abstract
In a synthetic lethality/viability screen, we identified the serine–threonine kinase RIP1 (RIPK1) as a gene whose knockdown is highly selected against during growth in normal media, in which autophagy is not critical, but selected for in conditions that increase reliance on basal autophagy. RIP1 represses basal autophagy in part due to its ability to regulate the TFEB transcription factor, which controls the expression of autophagy-related and lysosomal genes. RIP1 activates ERK, which negatively regulates TFEB though phosphorylation of serine 142. Thus, in addition to other pro-death functions, RIP1 regulates cellular sensitivity to pro-death stimuli by modulating basal autophagy.
Keywords: autophagy, ERK, RIP1 (RIPK1), TFEB
See also: DR Green (June 2015)
Introduction
Autophagy is a critical regulator of cell death decisions, and it is often a pro-survival process initiated in response to cell stressors, including nutrient starvation, such that inhibition of autophagy can sensitize a cell toward cell death in many instances 1, 2. Conversely, autophagy can also promote cell death in other, perhaps more limited and specific, contexts 1, 3.
The serine–threonine kinase, RIP1 (also known as RIPK1), plays multiple roles in signals that regulate the inflammatory response, cell death, cell growth, proliferation, and survival of cells. Although a kinase, many of RIP's functions are achieved by its ability to act as an adaptor protein in protein complexes triggered by death receptor agonists, as well as ligands of the Toll-like receptor (TLR) family, and likely other growth factor receptors. RIP1 is important for NF-κB signaling to mediate pro-survival signals, as well as the activation of the MAP kinases: JNK, p38, and ERK 4. These activities are associated with its intermediate domain 5, 6. RIP1 has multiple pro-death functions. It is essential for most forms of programmed necrotic cell death (or necroptosis) in combination with RIP3 and MLKL 7. RIP1 also contributes to caspase-8 activation downstream of death receptors through its death-domain-mediated interaction with FADD 8. Additionally, RIP1 contributes to recruitment and activation of FADD/caspase-8 in the Fas/CD95 receptor complex as mediated by membrane-bound FasL to promote apoptotic death 9. This additional organizing activity appears to also be related to interactions between the RIP1 death domain and the death domains of FADD and Fas. Thus, RIP1 has a pivotal role in signaling events that control the balance between the life and death of a cell.
We recently reported that differences in basal autophagy determine future cell fate 3, implying that the genes that regulate basal autophagy rates would be key regulators of cell death/survival decisions. We have reported that some tumor cells rely more on autophagy than others 10, 11, 12. For example, the murine breast cell line 67NR is dependent on efficient basal autophagy to maximize its growth even under nutrient-replete condition 10. Thus, by screening for genes that affect growth/viability in such cells when under stresses that promote reliance on autophagy, we reasoned that it would be possible to identify key modulators of basal autophagy. Using this strategy, a kinome shRNA screen identified RIP1 as a protein that inhibits basal autophagy. This regulation of basal autophagy is achieved by regulating a key transcription factor, TFEB, and can modulate whether a cell lives or dies in response to death agonists.
Results and Discussion
RIP1 knockdown confers a selective disadvantage to cells under normal growth conditions
In an autophagy-dependent mouse breast cancer cell line (67NR) with doxycycline-inducible expression of ATG12 shRNA (Supplementary Fig S1) 10, we conducted a synthetic lethality/viability screen using an shRNA kinome library that represented the known murine kinases (Fig1A; Supplementary Figs S2, S3, S4 and S5). Among the shRNAs that were most highly selected against in normal growth media where basal autophagy is not induced or, presumably, especially critical, were those to the serine–threonine kinase RIP1 (also known as RIPK1) (Fig1B; Supplementary Fig S3). When we examined several other shRNA screens in our laboratory, we found that RIP1 shRNA expression was also selected against in U87 and Daoy cells (A. Thorburn, unpublished data), as well as the breast cell lines MCF12A, MDAMB231, MDAMB468, T47, and MCF7 11. These data are also consistent with a subsequent study where RIP1 was one of several genes identified from analysis of multiple genome-wide shRNA lethality screens, and important for proper viability/growth of 9 of 12 cancer cell lines 13. When a lentivirus expressing RIP1 shRNA was infected in the 67NR cells at high titer, we observed a profound reduction in cell growth, with many cells becoming large and multinucleated compared to control shRNA (Supplementary Fig S6A–C). A reduction in growth and some cell death was also seen in HeLa cells (Supplementary Fig S6D–E). Therefore, loss of RIP1 expression confers a selective disadvantage to cells growing under normal tissue culture conditions.
Figure 1.
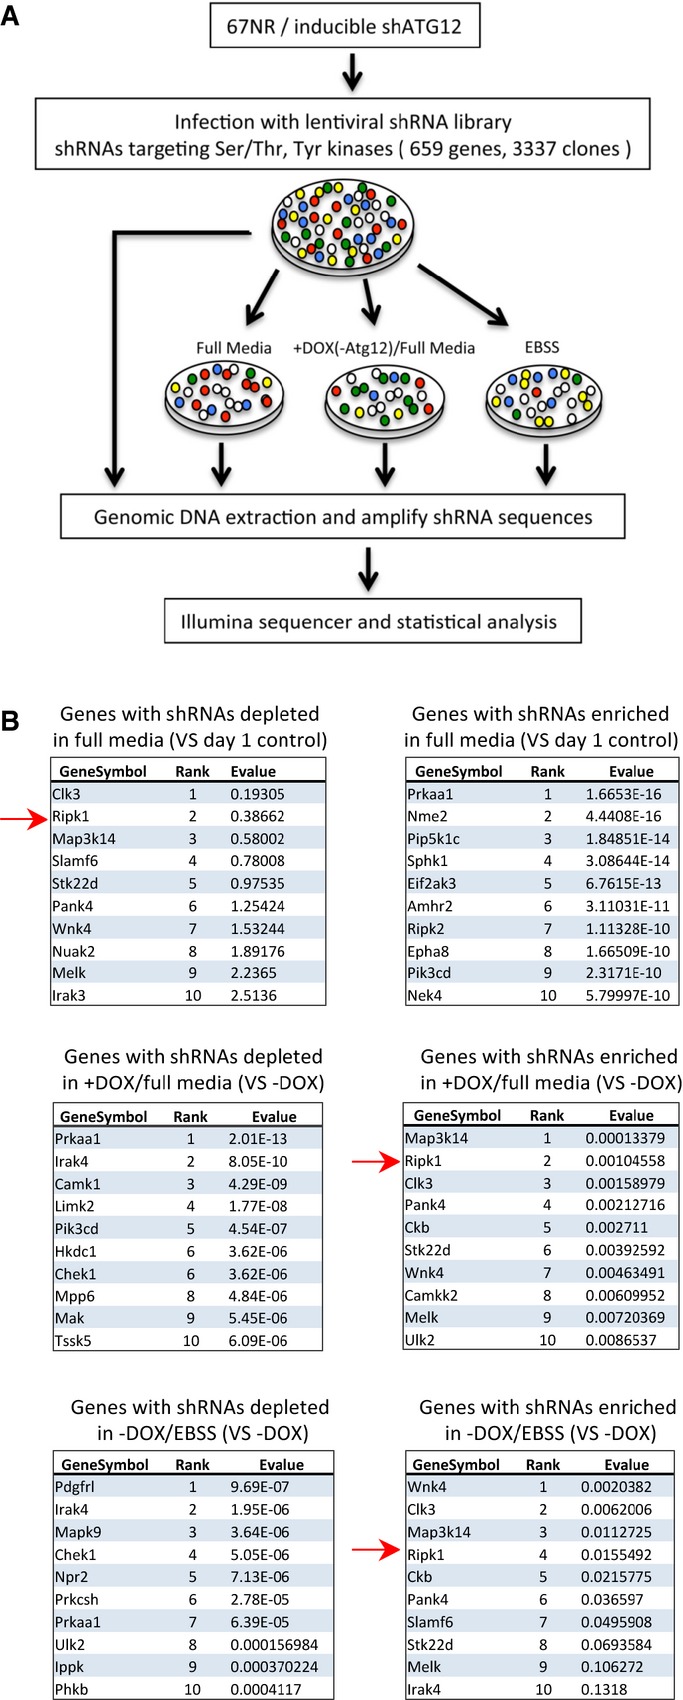
- Strategy for synthetic lethality/viability screen in 67NR cells. After infection with shRNA library virus (˜1.5 MOI, 24 h), some cells were directly harvested the following day, while others were further treated with doxycycline (72 h), and some cells were treated with EBSS (48 h). Chromosomal DNA was analyzed after amplification by next-generation sequencing.
- Identification of genes with highest statistical significance in the shRNA kinome library synthetic lethality/viability screen. Shown are those genes whose shRNAs are most enriched and depleted under normal growth (top), doxycycline-treated (ATG12-deficient) (middle), and EBSS-treated (bottom) conditions.
RIP1 represses basal autophagy
Despite its negative selection under normal growth conditions, RIP1 shRNA was actually selected for during both induced ATG12 partial knockdown and EBSS treatment (Fig1B; Supplementary Fig S3, S4 and S5). Both these conditions are expected to make autophagy-dependent cells such as 67NR 10 either find a way to bypass the need for autophagy or to increase basal autophagy. Thus, we inferred that RIP1 might inhibit autophagy and that knockdown of RIP1 would therefore lead to greater basal autophagy.
Indeed, RIP1 knockdown increased autophagic flux as measured by Western blotting of LC3II accumulation (Fig2A). Microscopic observation revealed that RIP1 knockdown increased LC3 puncta formation in either chloroquine (CQ)-treated or untreated cells (Fig2B), indicating that RIP1 depletion upregulates autophagosome formation. Autophagic flux was measured in HeLa cells expressing a tandem mCherry-GFP-LC3 protein using flow cytometry as we have done previously 3, where increased autophagic flux is indicated by an increase in red/green fluorescent ratio. This confirmed that multiple RIP1 shRNAs increased basal autophagic flux (Supplementary Fig S7A, quantified in Fig2C). Moreover, starvation only marginally increased autophagy in RIP1-knockdown HeLa cells relative to non-silencing cells (Fig2D; Supplementary Fig S7B–C), suggesting that RIP1 largely affects basal autophagy. Experiments in RIP1-knockdown or knockout MEFs and MCF10A cells gave similar results as assessed by Western blotting, the tandem mCherry-GFP-LC3 flow cytometry assay, and accumulation of LC3 puncta as measured by microscopy (Supplementary Fig S7D–J). Restoration of RIP1 expression in RIP1−/− MEFs reduced basal production of LC3II (Supplementary Fig S7H).
Figure 2.
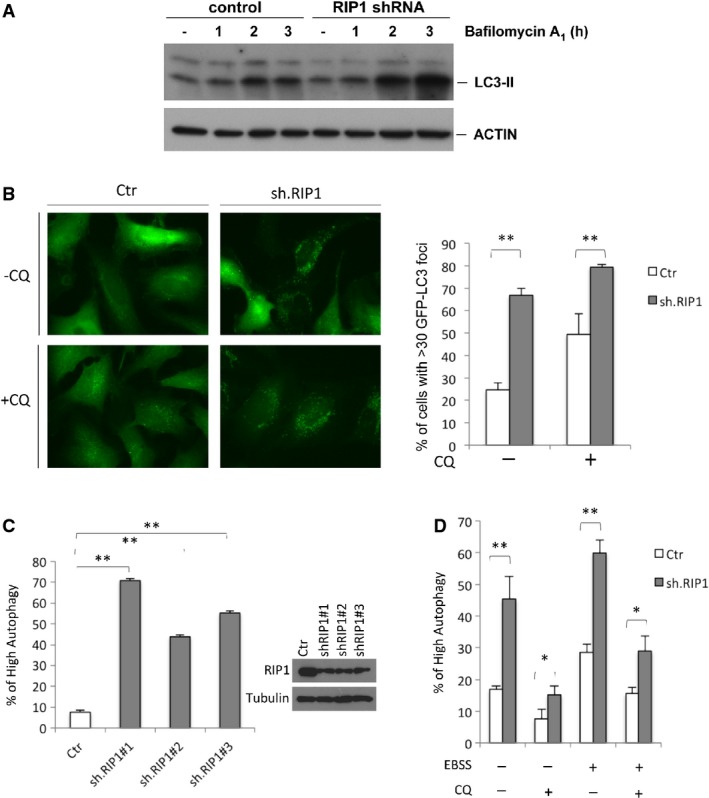
- Western blots of lysates from RIP1-knockdown or control HeLa cells treated with bafilomycin A1 (20 nM) for the indicated time course.
- (Left) Representative images of GFP LC3 puncta in HeLa/Ctr and HeLa/shRIP1 cells with and without CQ (10 μM, 3 h). (Right) Graph indicates the percentage of cells with > 30 LC3 GFP puncta per cell from three independent experiments (mean ± SD). **P < 0.01.
- Flow cytometric analysis of autophagy in HeLa mCherry-GFP-LC3 cells infected with lentivirus carrying three different shRIP1 (#1–3) or non-silencing (Ctr) shRNAs. Percentage of cells with high mCherry/GFP ratio is shown (mean ± SD, n = 3). **P < 0.01.
- Flow cytometric analysis of autophagy in HeLa mCherry-GFP-LC3 cells infected with RIP1 or non-silencing shRNA and treated with starvation medium (EBSS) and/or chloroquine (CQ: 10 μM) for 3 h. Percentage of cells with high mCherry/GFP ratio is shown (mean ± SD, n = 3). *P < 0.05, **P < 0.01.
RIP1 repression of autophagy does not require its kinase activity
RIP1 is essential for necrotic cell death induced by death receptor agonists such as TNF or FasL, where its kinase activity is important for the formation of a downstream complex with RIP3 7. Necrostatin-1 inhibits RIP1 kinase activity and necrotic cell death 14 and was previously reported to repress autophagy in certain contexts 15, 16. However, it had no effect on basal autophagy (Supplementary Fig S8A and B), suggesting that the kinase activity of RIP1 is not required for suppression of autophagy. Furthermore, expression of a kinase-dead RIP1 mutant (K45A) was capable of reducing autophagy in RIP1−/− MEFs to a great extent (Supplementary Fig S8C). A caspase-uncleavable mutant (D324K), a ubiquitination-deficient mutant (K376R), and a construct lacking the death domain (ΔDD) were also capable of repressing LC3II formation (Supplementary Fig S8D). These data suggest that repression of autophagy is associated with the intermediate domain or RHIM domain of RIP1, and since ubiquitination of RIP1 is reported to be necessary for its ability of activate NF-κB 17, this suggests that RIP1's ability to activate NF-κB is not involved in the suppression of autophagy, consistent with the lack of effect of IKK2 inhibitor on LC3II formation (Supplementary Fig S8E). Exclusion of the kinase, NF-κB activation, and the death-domain-associated functions in RIP1-dependent autophagy repression suggests that this effect is due to the remaining (and intermediate-domain-dependent) known functions of RIP1, which are known to activate MAP kinase (MAPK) signaling pathways.
RIP1 knockdown upregulates autophagy and lysosomal activities and is accompanied by reduced phosphorylation of TFEB
To test whether RIP1 knockdown affects expression of autophagy genes, we investigated mRNA levels for 86 autophagy-associated genes using an autophagy qRT–PCR array in shRIP1-treated HeLa cells. Many such genes were upregulated by RIP1 knockdown (Supplementary Table S1). We verified the reproducibility of the upregulation of several of these genes in three independent qRT–PCR experiments using different primer sets (Fig3A). The expression of autophagy genes, ATG9B, UVRAG, WIPI1 and GABARAP, and lysosomal genes, LAMP1, CTSD and CTSS, were significantly upregulated by RIP1 knockdown, while housekeeping genes GAPDH and ACTB were not affected. The lysosomal protein LAMP1 was increased in RIP1-knockdown cells (Fig3B), indicating that RIP1 is involved not only in the repression of autophagosome formation, but also in the repression of lysosomal biogenesis, reminiscent of transcription regulated by TFEB (transcription factor EB), which globally regulates the expression of autophagy and lysosomal proteins 18.
Figure 3.
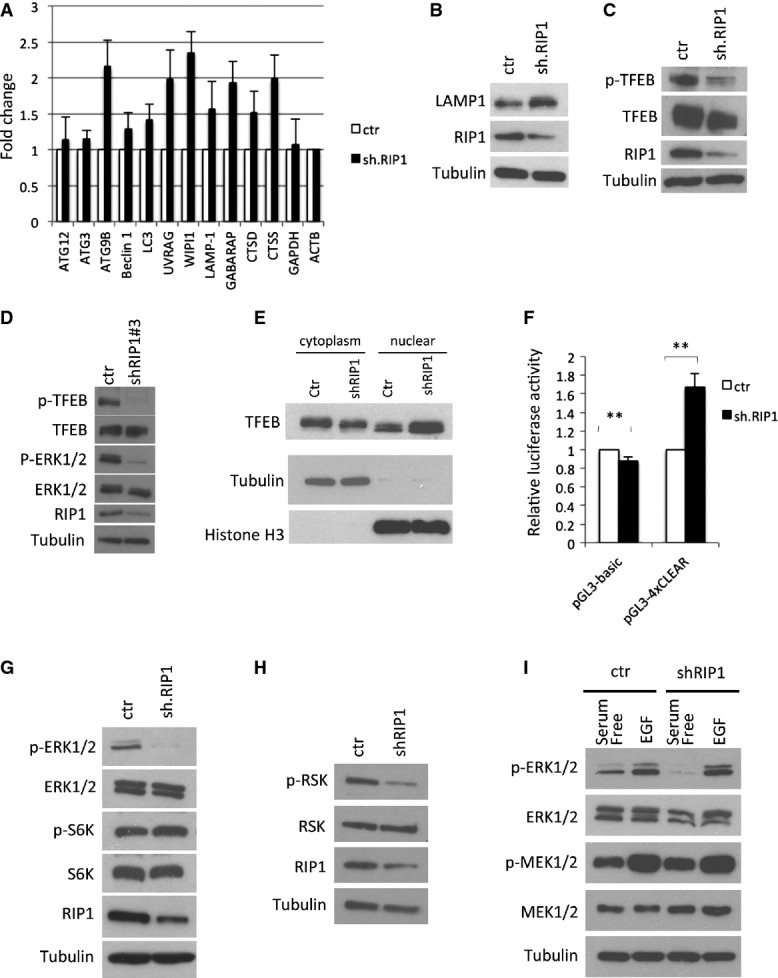
- A qPCR data from HeLa cells indicating the levels of autophagy-related mRNAs in RIP1-knockdown cells normalized relative to ACTB (β-actin) and to non-silencing control cells (mean ± SD, n = 3).
- B Western blotting of the lysosomal protein LAMP-1 48 hours after RIP1 knockdown in HeLa cells.
- C, D Western blots showing TFEB phosphorylation (S142) after RIP1 knockdown in HeLa cells using two different shRNAs (C, shRNA #1; D, shRNA #3).
- E Western blotting of nuclear/cytosolic fractionations of pcDNA-TFEB–expressing HeLa cells with subsequent RIP1 knockdown.
- F Data from luciferase assay in HeLa cells expressing pGL3-basic (empty) or pGL3-4xCLEAR (four tandem TFEB recognition elements) and non-silencing or RIP1 shRNA, normalized to control cells. Data show mean ± SD, n = 3. **P < 0.01.
- G Western blotting analysis of HeLa/Ctr and HeLa/shRIP1 cells showing ERK and S6K phosphorylation states.
- H Western analysis of the lysates from RIP1-knockdown or control HeLa cells showing a decrease in phosphorylation of the MEK substrate RSK.
- I Western blot of lysates from HeLa cells infected with non-silencing control or RIP1 shRNA cultured in serum-free medium for 20 h and subsequently cultured in the presence or absence of EGF (100 ng/ml).
Previous reports demonstrated that two kinases, MAP kinase ERK2 and mTORC1, can phosphorylate TFEB at S142, inhibiting its translocalization to the nucleus and preventing transcriptional enhancement of autophagy and lysosomal genes 18, 19, 20. Phosphorylation of TFEB was inversely correlated with RIP1 deficiency as indicated by Western blotting using a phospho-TFEB (phosphor-S142) antibody (Fig3C and D). Increased TFEB was present in the nucleus of RIP1-knockdown cells and also associated with additional TFEB protein mobility (Fig3E). Luciferase assays indicated that knockdown of RIP1 activated a promoter containing four tandem TFEB recognition elements (4xCLEAR), indicating that RIP1 deficiency was capable of activating TFEB-mediated transcription (Fig3F). ERK phosphorylation was significantly reduced in RIP1-knockdown cells (Fig3D, G), whereas phosphorylation of mTORC1 substrate, p70 S6 kinase, did not differ upon RIP1 knockdown (Fig3G). Phosphorylation of the ERK substrate RSK was also reduced in cells with RIP1 knockdown (Fig3H). Consistent with this mechanism regulating basal activity, both MEK and ERK could be activated in RIP1-knockdown HeLa cells by the acute addition of EGF (Fig3I). Thus, we conclude that the pathway was still functional in RIP1-deficient cells, but basal rates of ERK activity in nutrient-replete conditions are controlled through RIP1 regulation of TFEB activity. To test this, tandem mCherry-GFP-LC3–expressing cells were treated with a pharmacological inhibitor of MEK (U0126), an essential upstream activator of ERK. This led to a pronounced increase in red/green ratio (Fig 4A), indicating that inhibition of basal ERK signaling is sufficient to increase basal autophagy. Ectopic expression of RIP1 and ectopic expression of the kinase-dead RIP1 mutant (K45A) were both sufficient to activate ERK as measured by phospho-ERK immunoblotting (Fig4B), consistent with the ability of the kinase-dead mutant to repress basal autophagy (Supplementary Fig S8C). Importantly, expression of a constitutively active MEK or a TFEB shRNA was sufficient to prevent RIP1 knockdown from inducing autophagy (Fig4C–E).
Figure 4.

- A Flow cytometric analysis of autophagy in MCF10A mCherry-GFP-LC3 cells treated or untreated overnight with an inhibitor of the ERK activator MEK (U0126).
- B Western blot of lysates from HeLa cells expressing GFP, RIP1, or its kinase-deficient mutant showing the ability of RIP1 or its kinase mutant to stimulate ERK activity as measured by ERK phosphorylation.
- C–E In mCherry-GFP-LC3–expressing HeLa and MCF10A cells, the ratio of the amount of high-autophagy cells (measured by flow cytometric analysis) in RIP1 shRNA cells compared to non-silencing control shRNA cells is shown for HeLa cells expressing constitutively active MEK (C), and for HeLa (D) or MCF10A (E) cells expressing non-silencing or TFEB shRNAs. Data show mean ± SEM, n = 3. §MEK activation or TFEB shRNA reduces the ability of RIP1 shRNA to induce autophagy with a P-value < 0.05.
Basal autophagy can regulate cell death both positively and negatively in a stimulus-specific manner 3, 21. In some but not all tumor cells, higher basal autophagy selectively potentiates Fas-ligand-mediated cell death while inhibiting TRAIL-mediated cell death 3. This is achieved through autophagy-dependent degradation of the phosphatase FAP1, which is expressed in a subset of cells, and which is a negative regulator of Fas but not TRAIL-induced apoptosis. We treated MCF10A cells (which express FAP1) with Fas ligand (FasL) and TRAIL. The FAP-1 protein was negatively regulated by the increased autophagy in RIP1-deficient cells (Supplementary Fig S9). Knockdown of RIP1 (Fig5A) increased the sensitivity of these cells to FasL (Fig5B), but protected from TRAIL-induced cell death (Fig5C). ATG7 knockdown had little effect on TRAIL-induced cell death in the non-silencing MCF10A cells, consistent with there being little basal autophagy in these cells; however, knockdown of ATG7 inhibited the ability of RIP1 knockdown to protect from TRAIL-induced cell death (Fig5D). Likewise, expression of TFEB shRNA reduced the protective effect of RIP1 knockdown on TRAIL-induced toxicity (Fig5E–F). In contrast, expression of TFEB shRNA prevented the potentiation of cell death by RIP1 depletion in response to FasL (Fig5G). Finally, pharmacological inhibition of ERK activation protected from TRAIL-induced toxicity (Supplementary Fig S10A), but protection was reduced when TFEB was knocked down (Supplementary Fig S10B). Taken all together, these data suggest that RIP1's ability to repress basal autophagy through activation of ERK and repression of TFEB activity can determine the stimulus-selective response to cell death stimuli. Thus, RIP1 modulates cell death not only by mediating pro-necrotic signals and caspase-8 activation but also through its ability to control basal autophagy.
Figure 5.
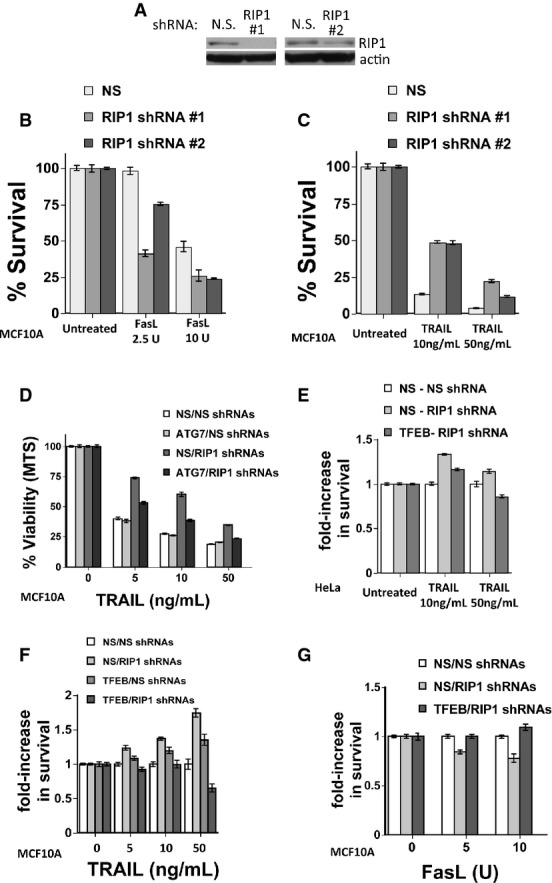
- A Western blot of lysates from MCF10A cells expressing non-silencing control or RIP1 shRNAs.
- B, C Cells were then treated with (B) FasL or (C) TRAIL for 24 h, and cell viability was analyzed by MTS. Data shown are mean ± SEM, n = 4.
- D Cell viability (MTS) of TRAIL-treated (24 h) MCF10A cells with double knockdown using non-silencing, ATG7 and/or RIP1 shRNAs. Data shown are mean ± SEM, n = 4.
- E–G Cell viability (MTS) of TRAIL- or Fas-treated (24 h) HeLa (E) or MCF10A cells (F, G) with double knockdown using non-silencing, TFEB and/or RIP1 shRNAs, as indicated. For these experiments, each data point is normalized to the non-silencing control for each treatment dose and condition. Data shown are mean ± SEM, n = 4.
Materials and Methods
Cell culture
HeLa cells and mouse embryonic fibroblasts (MEFs) were grown in DMEM supplemented with 10% fetal bovine serum. MCF10A cells were grown in DMEM/F12 supplemented with 5% horse serum, 20 ng/ml EGF, 0.5 mg/ml hydrocortisone, 100 ng/ml cholera toxin, and 10 μg/ml insulin. For starvation experiments, cells were grown in EBSS for 3 h. For EGF treatment, cells were washed twice with PBS, cultured in DMEM (w/o serum) for 20 hrs, and then treated with EGF (100 ng/ml) for 20 min. MEF, HeLa, and MCF10A cell lines were infected with retrovirus carrying pBabe puro-mCherry-GFP-LC3 for 2 days and selected with puromycin (2 μg/ml) to obtain stable cell lines.
shRNA screen
The shRNA kinome library was obtained from the Functional Genomics Shared Resource of the University of Colorado Cancer Center that included 3,337 shRNAs encoding all 659 known murine kinases, including tyrosine kinases, each gene target having five different shRNAs. Contents of the library, including individual TRC numbers, can be found at http://functionalgenomics.colorado.edu/documents/panel-mouse-kinase.xls and http://functionalgenomics.colorado.edu/documents/panel-mouse-tyrosinekinase.xls. After infection of the 67NR cells with shRNA library virus (∽1.5 MOI, 24 h), some cells were directly harvested the following day, while others were further treated with doxycycline (72 h), and some cells were treated with EBSS (48 h). Chromosomal DNA was analyzed after amplification by next-generation sequencing. Analysis of the screen data was done as previously described 22.
Western blots
Cells were lysed with RIPA buffer containing protease inhibitor cocktails (Roche) and phosphatase inhibitor cocktail (Thermo Scientific). Protein lysates were sonicated briefly, resolved by SDS–PAGE, analyzed by Western blot, and visualized by enhanced chemiluminescence.
Fluorescence microscopy
Cells/mCherry-GFP-LC3 were grown on coverslips and, after treatment, fixed with 4% formaldehyde in PBS, washed with PBS, and mounted on slides with gelvatol mounting medium. Cells were observed in a ZEISS Axiovert 2000 M microscope using 63× magnification with Volocity software. Images showing 50 cells for each experiment were used for the evaluation of autophagosome formation. A cell having more than 30 GFP-positive LC3 puncta was evaluated as an autophagy-positive cell with respect to this assay.
Measurement of autophagic flux by flow cytometry
Flow cytometry was used to measure autophagy in cells expressing mCherry-GFP-LC3 using a modification of the procedure used by Gump et al 3. Cytometry was performed with a Moflo XDP 100 machine (Beckman Coulter) or a Gallios 561 (Beckman Coulter) using 488- and 561-nM lasers for red and green fluorophore excitation, respectively. Non-viable cells were excluded from analysis by gating on the appropriate forward/side scatter profile. Cells with high autophagy were defined as those gated as having a high mCherry/GFP fluorescence ratio as illustrated in Supplementary Figs S7E and S8C. Bafilomycin A1-treated control cells were used to set this gate. Since bafilomycin A1 inhibits autophagic flux, the bottom of the gate for each set of flow cytometry experiments was set at the rightward base of the bafilomycin A1-treated cells, with the assumption that the cells under the bafilomycin A1 curve represented cells with little or no autophagic flux and that cells to the right of this curve would have higher autophagic flux. The quantitation gate was set such that no more than 2–5% of bafilomycin A1-treated cells from every given condition would be included in the gate. However, an exception to this rule was made in the case of MEF cells, due to a long rightward tail in the bafilomycin A1 curve. For MEFs, therefore, up to 15% of bafilomycin A1-treated cells were allowed within the gate.
Viability and toxicity assays
For MTS assays, cells in 48-well plates were treated for the indicated time course. MTS reagent (Promega) was added according to the manufacturer's instructions, and the absorbance was read at 490 nm.
For clonogenic assays, small numbers of cells were plated in six-well plates. Cells were allowed to recover and grow for 5 days, fixed, and stained with crystal violet (BD). Plates were scanned, stain was solubilized with 30% acetic acid, and absorbance was measured at 540 nm.
Subcellular fractionation analysis
Subcellular fractionation was performed as previously described 18. Briefly, HeLa cells were transiently transfected with pcDNA3.1-TFEB (0.5 μg/10 cm plate). After 24 h, cells were infected with non-silencing shRNA or shRIP1 virus. Cells were lysed with lysis buffer (0.5% Triton X-100, 50 mM Tris–HCl pH 7.5, 137.5 mM NaCl, 10% glycerol, 5 mM EDTA) containing protease inhibitor cocktails and phosphatase inhibitor cocktails for 20 min on ice followed by centrifugation at 1,000 × g for 3 min at 4°C. Supernatants were centrifuged at 15,000 rpm for 5 min, and its supernatant was used as cytosolic fraction for Western blots. After centrifugation at 1,000 × g for 3 min, pellets were washed with lysis buffer twice, and pellets were dissolved in lysis buffer, sonicated, and subjected to Western blot analysis. Antitubulin and histone H3 antibodies were used as cytosolic and nuclear markers each.
Statistical analysis
Statistical analysis was performed using an unpaired Student's t-test.
Acknowledgments
We thank Gerard Karsenty for the phospo-specific TFEB antibody. This work was supported by NIH grant CA 150925 (AT), and Shared Resources from the Cancer Center Support Grant P30CA046934. In addition, this work was supported by a Cancer League of Colorado Cancer Research Grant to MJ Morgan from the Cancer League of Colorado, Inc. in association with the University of Colorado Cancer Center, and also supported by ACS IRG #57-001-53 from the American Cancer Society (MJM).
Author contributions
TY, AT, and MJM conceived, designed, and interpreted the experiments. TY did many of the initial experiments, and TY, GG, and MJM performed the bulk of the experiments in the study. JT repeated some flow cytometry experiments. JG made the pcDNA3-TFEB construct. JK and ACT performed the analysis of the data from the synthetic lethality/viability screen. TY and MJM wrote the manuscript and made the figures, with advice given by AT.
Conflict of interest
The authors declare that they have no conflict of interest.
Supporting Information
Supplementary Figure S1
Supplementary Figure S2
Supplementary Figure S3
Supplementary Figure S4
Supplementary Figure S5
Supplementary Figure S6
Supplementary Figure S7
Supplementary Figure S8
Supplementary Figure S9
Supplementary Figure S10
Supplementary Table S1
Supplementary Figure Legends
Supplementary Materials and Methods
Review Process File
References
- Gump JM, Thorburn A. Autophagy and apoptosis: what is the connection? Trends Cell Biol. 2011;21:387–392. doi: 10.1016/j.tcb.2011.03.007. [DOI] [PMC free article] [PubMed] [Google Scholar]
- Thorburn A, Thamm DH, Gustafson DL. Autophagy and cancer therapy. Mol Pharmacol. 2014;85:830–838. doi: 10.1124/mol.114.091850. [DOI] [PMC free article] [PubMed] [Google Scholar]
- Gump JM, Staskiewicz L, Morgan MJ, Bamberg A, Riches DWH, Thorburn A. Autophagy variation within a cell population determines cell fate through selective degradation of Fap-1. Nat Cell Biol. 2014;16:47. doi: 10.1038/ncb2886. [DOI] [PMC free article] [PubMed] [Google Scholar]
- Lin Y. RIP1-mediated signaling pathways in cell survival and death control. In: Shen H, Vandenabeele P, editors. Cell Death in Biology and Diseases: Necrotic Cell Death. New York: Springer/Humana Press; 2014. pp. 23–43. Vol. 397, 23. [Google Scholar]
- Ting AT, PimentelMuinos FX, Seed B. RIP mediates tumor necrosis factor receptor 1 activation of NF-kappa B but not Fas/APO-1-initiated apoptosis. EMBO J. 1996;15:6189–6196. [PMC free article] [PubMed] [Google Scholar]
- Yuasa T, Ohno S, Kehrl JH, Kyriakis JM. Tumor necrosis factor signaling to stress-activated protein kinase (SAPK)/Jun NH2-terminal kinase (JNK) and p38 - Germinal center kinase couples TRAF2 to mitogen-activated protein kinase/ERK kinase kinase 1 and SAPK while receptor interacting protein associates with a mitogen-activated protein kinase kinase kinase upstream of MKK6 and p38. J Biol Chem. 1998;273:22681–22692. doi: 10.1074/jbc.273.35.22681. [DOI] [PubMed] [Google Scholar]
- Morgan M, Liu Z. Programmed cell death with a necrotic-like phenotype. Biomol Concepts. 2013;4:259–275. doi: 10.1515/bmc-2012-0056. [DOI] [PubMed] [Google Scholar]
- Wang L, Du FH, Wang XD. TNF-alpha induces two distinct caspase-8 activation pathways. Cell. 2008;133:693–703. doi: 10.1016/j.cell.2008.03.036. [DOI] [PubMed] [Google Scholar]
- Morgan MJ, Kim YS, Liu ZG. Membrane-bound Fas ligand requires RIP1 for efficient activation of caspase-8 within the death-inducing signaling complex. J Immunol. 2009;183:3278–3284. doi: 10.4049/jimmunol.0803428. [DOI] [PMC free article] [PubMed] [Google Scholar]
- Maycotte P, Aryal S, Cummings CT, Thorburn J, Morgan MJ, Thorburn A. Chloroquine sensitizes breast cancer cells to chemotherapy independent of autophagy. Autophagy. 2012;8:200–212. doi: 10.4161/auto.8.2.18554. [DOI] [PMC free article] [PubMed] [Google Scholar]
- Maycotte P, Gearheart CM, Barnard R, Aryal S, Mulcahy Levy JM, Fosmire SP, Hansen RJ, Morgan MJ, Porter CC, Gustafson DL, et al. STAT3-Mediated autophagy dependence identifies subtypes of breast cancer where autophagy inhibition can be efficacious. Cancer Res. 2014;74:2579–2590. doi: 10.1158/0008-5472.CAN-13-3470. [DOI] [PMC free article] [PubMed] [Google Scholar]
- Morgan MJ, Gamez G, Menke C, Hernandez A, Thorburn J, Gidan F, Staskiewicz L, Morgan S, Cummings C, Maycotte P, et al. Regulation of autophagy and chloroquine sensitivity by oncogenic RAS in vitro is context-dependent. Autophagy. 2014;10:1814–1826. doi: 10.4161/auto.32135. [DOI] [PMC free article] [PubMed] [Google Scholar]
- Hadji A, Ceppi P, Murmann AE, Brockway S, Pattanayak A, Bhinder B, Hau A, De Chant S, Parimi V, Kolesza P, et al. Death induced by CD95 or CD95 ligand elimination. Cell Rep. 2014;7:208–222. doi: 10.1016/j.celrep.2014.02.035. [DOI] [PMC free article] [PubMed] [Google Scholar]
- He S, Wang L, Miao L, Wang T, Du F, Zhao L, Wang X. Receptor interacting protein kinase-3 determines cellular necrotic response to TNF-alpha. Cell. 2009;137:1100–1111. doi: 10.1016/j.cell.2009.05.021. [DOI] [PubMed] [Google Scholar]
- Wang YQ, Wang L, Zhang MY, Wang T, Bao HJ, Liu WL, Dai DK, Zhang L, Chang P, Dong WW, et al. Necrostatin-1 suppresses autophagy and apoptosis in mice traumatic brain injury model. Neurochem Res. 2012;37:1849–1858. doi: 10.1007/s11064-012-0791-4. [DOI] [PubMed] [Google Scholar]
- Chang P, Dong WW, Zhang MY, Wang ZF, Wang YQ, Wang T, Gao Y, Meng HH, Luo B, Luo CL, et al. Anti-necroptosis chemical necrostatin-1 can also suppress apoptotic and autophagic pathway to exert neuroprotective effect in mice Intracerebral hemorrhage model. J Mol Neurosci. 2014;52:242–249. doi: 10.1007/s12031-013-0132-3. [DOI] [PubMed] [Google Scholar]
- Li HX, Kobayashi M, Blonska M, You Y, Lin X. Ubiquitination of RIP is required for tumor necrosis factor alpha-induced NF-kappa B activation. J Biol Chem. 2006;281:13636–13643. doi: 10.1074/jbc.M600620200. [DOI] [PubMed] [Google Scholar]
- Settembre C, Di Malta C, Polito VA, Garcia Arencibia M, Vetrini F, Erdin S, Erdin SU, Huynh T, Medina D, Colella P, et al. TFEB links autophagy to lysosomal biogenesis. Science. 2011;332:1429–1433. doi: 10.1126/science.1204592. [DOI] [PMC free article] [PubMed] [Google Scholar]
- Settembre C, Zoncu R, Medina DL, Vetrini F, Erdin S, Huynh T, Ferron M, Karsenty G, Vellard MC, Facchinetti V, et al. A lysosome-to-nucleus signalling mechanism senses and regulates the lysosome via mTOR and TFEB. EMBO J. 2012;31:1095–1108. doi: 10.1038/emboj.2012.32. [DOI] [PMC free article] [PubMed] [Google Scholar]
- Martina JA, Chen Y, Gucek M, Puertollano R. MTORC1 functions as a transcriptional regulator of autophagy by preventing nuclear transport of TFEB. Autophagy. 2012;8:903–914. doi: 10.4161/auto.19653. [DOI] [PMC free article] [PubMed] [Google Scholar]
- Thorburn J, Andrysik Z, Staskiewicz L, Gump J, Maycotte P, Oberst A, Green DR, Espinosa JM, Thorburn A. Autophagy controls the kinetics and extent of mitochondrial apoptosis by regulating PUMA levels. Cell Rep. 2014;7:45–52. doi: 10.1016/j.celrep.2014.02.036. [DOI] [PMC free article] [PubMed] [Google Scholar]
- Kim J, Tan AC. BiNGS!SL-seq: a bioinformatics pipeline for the analysis and interpretation of deep sequencing genome-wide synthetic lethal screen. Methods Mol Biol. 2012;802:389–398. doi: 10.1007/978-1-61779-400-1_26. [DOI] [PubMed] [Google Scholar]
Associated Data
This section collects any data citations, data availability statements, or supplementary materials included in this article.
Supplementary Materials
Supplementary Figure S1
Supplementary Figure S2
Supplementary Figure S3
Supplementary Figure S4
Supplementary Figure S5
Supplementary Figure S6
Supplementary Figure S7
Supplementary Figure S8
Supplementary Figure S9
Supplementary Figure S10
Supplementary Table S1
Supplementary Figure Legends
Supplementary Materials and Methods
Review Process File