

1. Introduction
Image-guided thermal therapies are now routinely applied in a variety of clinical settings. For laser, RF, microwave, and high-intensity focused ultrasound (HIFU) therapies, several medical imaging modalities have been proposed, tested, and employed in the guidance of these therapies in research, culminating now with MRI-guided HIFU (MR-HIFU) for patients in the clinic. Despite the positive clinical experience with MR-HIFU and the ongoing clinical trials for new systems and indications, image-guidance with ultrasound remains particularly attractive in simplicity, portability, accessibility, and cost. While many groups have explored the potential for both quantitative ultrasound thermometry and qualitative ablation monitoring with ultrasound, ultrasound-guided focused ultrasound surgery (USgFUS) has many outstanding questions and technical challenges before clinical use of the technology to monitor and control thermal therapies is routine. Here, we review the current status of ultrasound thermometry and ablation monitoring, with emphasis on the diverse approaches published in the literature and with an eye on which methods are closest to clinical reality. Although ultrasound thermometry would have applications to all thermal therapies, this paper refers to HIFU as the specific energy-based thermal therapy modality of interest.
A review of the English language literature indexed in PubMed from 1967 to the present was completed for the following search expressions: (i) ultrasound thermometry, and (ii) ( “ultrasonic” OR “ultrasound” ) AND (“temperature” OR “thermal”) AND ( “estimation” OR “measurement” OR “imaging”). In some cases, these citations led to additional citations in Scopus and Web of Science, primarily in physics, acoustics, and signal processing journals not indexed by PubMed. In most cases, the related term “thermography” refers to methods for measuring the temperature at the surface of the breast, scrotum, intravascular vulnerable plaque, or other sites using thermal or optical methods. While these methods may provide information about lesions at depth, the thermography literature (which is older than thermometry) is not reviewed here, except for the exceptional papers where the term “ultrasound thermography” was noted. It is hoped that this review will serve as a guide to the expansion of sonographic methods for treatment monitoring and thermometry since the last brief review included in Rivens et al eight years ago (1).
2. Why measure temperature?
The measurement of temperature during thermal therapy provides an accurate estimate of the region of thermal damage that will occur in tissue. The relationship between time, temperature, and cell survival has been confirmed in numerous studies ranging from cells, to excised tissue, animals, and patients. The influence of temperature on cells has been observed to follow an Arrhenius relationship from mild heating to coagulative temperatures (2). Histological evaluation of tissues following ablative treatments supports the notion that temperature shows a strong correlation with regions of coagulative necrosis for short duration exposures as typically encountered during HIFU (3). As a result, the ability to image the spatial temperature distribution during treatment provides a form of “in vivo dosimetry” that is unavailable with other energy-based therapies such as ionizing radiation. In addition to predicting regions of thermal damage, in vivo temperature imaging can also be used to monitor sensitive areas to protect them from unwanted damage, thereby enhancing the safety of a treatment.
Over 35 years ago, Christsensen noted that temporal resolution requirements for thermometry were reduced by the large thermal mass of treated tissues (4). The temporal resolution required to effectively monitor a thermal therapy depends on the rate of heating and the time response of tissue governed by the bioheat equation. For interstitial treatments where the heating duration can last up to 15 minutes, a temporal sampling of 10–30 seconds may be sufficient. For HIFU treatments where a single exposure reaches coagulative temperatures in 10–30 seconds, a temporal resolution of a few seconds is necessary to adequately track and control treatment. Spatial resolution requirements are also tightly related to the type of heating. Interstitial treatments or hyperthermic exposures that gradually heat a volume many cubic centimeters in size typically have gentler thermal gradients and can be monitored effectively with a spatial resolution of 2–3 mm. HIFU treatments have very sharp thermal gradients and heat volumes much less than 1 cc in a single exposure; hence a spatial resolution of 1 mm is often desirable (but usually not attainable). In general external HIFU treatments place the strictest requirements on spatial and temporal resolution for thermometry. The final consideration is the temperature precision required for a thermometry method. In the case of ablative treatments, elevating temperature beyond a critical temperature is often sufficient to achieve irreversible tissue destruction. Beyond this threshold, the effects are largely the same until the temperature exceeds the boiling point in tissue. Therefore, a precision of 2–3°C for thermometry is often acceptable for these types of treatments. On the other hand, for hyperthermic treatments, a difference in 1°C results in a requirement for double the exposure time to achieve the same biological endpoint in tissue. Therefore for these treatments, a much higher precision, ideally less than 1°C, is necessary for adequate monitoring and control. The reader will appreciate that spatial, temporal and temperature resolution are intrinsically linked and are traded off for one another to customize for a particular heating application. HIFU treatments typically try to achieve the highest spatial and temporal resolution with a trade-off on the temperature precision, which is acceptable for coagulative treatments. In hyperthermia treatments, a lower spatial and temporal resolution can be tolerated, with a concomitant gain in temperature precision. A few studies have looked at these trade-offs through simulations, and have evaluated their impact on treatment accuracy and precision (5–7).
3. Gold standards for in vivo thermometry
3.1 Invasive temperature sensors
The gold standard for in vivo temperature measurement is the utilization of invasive, temperature sensing probes (8). Temperature sensors generally fall into two classes: thermocouples and fiber-optics. The ideal invasive sensor would not modulate the thermal therapy field and would be insensitive to strains due to thermal expansion and/or patient motion. Significant distortion of the HIFU field was reported for metallic thermocouple probes larger than , but probes smaller than produced only local perturbations that are thought to have negligible effect on the overall thermal distribution (9) but may create a discrepancy between the temperature at the probe and the surrounding tissue (10). Fiber-optic probes are generally insensitive to environmental electromagnetic interference, but can be influenced by light in the case of laser thermal therapy (11).
The use of invasive temperature probes reduces the advantage of non-invasive thermal therapies such as HIFU. Further, accurate temperature measurements are only obtained at the spatial location of the sensor, precluding estimation of the spatial distribution of temperature in biological tissue due to heterogeneous blood flow and energy absorption. As a result, multiple temperature sensors are typically required for adequate monitoring of spatial heating, which is often impractical clinically because of the inconvenience or anatomy (ie. brain, bone).
3.2 MR Thermometry
The current clinical standard for non-invasive temperature measurement in the body is with magnetic resonance imaging (MRI). Generally speaking, the advantage of MRI for thermometry is that it provides quantitative temperature measurements in the body without the need for a priori calibration in the target tissue. Furthermore, it is non-invasive, non-ionizing, and can be acquired in multiple planes or volumetrically. The spatial, temporal and temperature resolutions are acceptable for clinical thermal therapies such as hyperthermia and thermal ablation. The primary disadvantage is the cost and lack of portability associated with the method, as well as the need to design custom therapy systems to work within the strong magnetic field of the scanner. Excellent reviews can be found on this topic and its application in medicine (12–15). Almost all the tissue parameters associated with MRI exhibit some form of temperature dependence including relaxation parameters (T1, T2), water diffusion, magnetization, and proton resonant frequency. Exploiting these physical phenomena, MRI can be used to measure relative temperature changes or absolute temperature in vivo. The most mature and utilized technique for MR thermometry is the proton resonant frequency shift (PRF shift) method (16, 17), which provides relative temperature measurements in soft tissues (excluding fat).
The PRF shift method is based on the physical phenomenon that in a magnetic field, water protons experience an approximately −0.01 ppm/°C shift in the Larmor frequency as the temperature changes. The origin of this frequency shift is attributed to the temperature dependence of hydrogen bonding in water, which affects the local microscopic magnetic field experienced by protons on water molecules. The change in magnetic field is reflected as a change in the resonant frequency of these protons when excited with a radiofrequency pulse in a static magnetic field. With the development of MRI, efforts were successful in implementing imaging strategies to exploit this phenomenon based on the phase information in MR images (16, 18). Since the change in phase due to temperature is much smaller than other changes in phase due to factors including susceptibility variations in tissue and static field inhomogeneities within the scanner, a subtraction of a reference image is usually performed to remove these static variations (leaving behind only changes in the magnetic field due to temperature). While this subtraction is generally robust, it renders the method a relative temperature technique, and the temperature of the reference image must be known or assumed. Early studies of this technique demonstrated that the PRF shift was approximately the same across different tissue types, and in native and coagulated tissues (19). Further, it was sensitive to other factors including magnetic field drift, motion, and susceptibility variations from sources including lung volume changes, and moving devices in the vicinity. In addition, it was observed that fat did not exhibit the same temperature dependent frequency shift, and the technique could not measure temperature in this tissue. As a result, applying PRF shift methods in fat-rich organs such as breast has been challenging and typically requires alternative methods based on T1 or T2 relaxation (20, 21). Furthermore, PRF shift thermometry is challenging to apply in the abdomen due to the proximity of the lungs and subsequent motion of organs due to respiration. Techniques to overcome the challenges in performing simple subtraction based thermometry include the reference-less method of thermometry and multi-baseline MR thermometry (22, 23). Nonetheless, this technique enables measurement of relative temperature changes in the body with a resolution of a few mm, temporal resolution of seconds, and a temperature precision of approximately 1°C in human subjects on a clinical scanner. The temperature dependence of phase changes is independent of patient, organ, and whether tissue is treated or untreated, when the optimal conditions are met. Finally, numerous studies have been performed to validate the quantitative accuracy and precision of this method. It is for these reasons that the technique is used in conjunction with approved medical devices for the delivery of thermal therapy in the body using MRI-guided high-intensity focused ultrasound therapy (24, 25).
3.3 Other non-ultrasonic approaches to thermometry
Despite the desire to minimize ionizing radiation, investigations on CT-based thermometry date back to shortly after clinical introduction of the modality in the 1970s. From a physics perspective, the linear attenuation coefficient is a product of the mass attenuation coefficient of the tissue and the density. Since density changes slightly with temperature, the linear attenuation coefficient μ and consequently the Hounsfield units for a heated pixel will change compared to baseline. Unfortunately, the thermal sensitivity coefficient for CT thermometry is on the order of −0.50 HU per °C which limits the thermal resolution. For mild hyperthermia, this sensitivity is most likely limiting. However, the spatial resolution of underlying modality is quite high and offers the prospect for high-resolution thermometry with the cost of increasing dose. An excellent historical and current status review of CT-based thermometry was covered in a recent review article on thermometry methods for laser-induced thermotherapy (LITT) (8).
Using temperature measurements on the surface (thermography), numerical inversion of the bioheat equation has also been attempted (26). In this ambitious study, the investigators also attempt the simultaneous reconstruction of not only the temperature increase map in the subsurface volume, but also the acoustic absorption coefficient and the thermal diffusivity. As inverse problems for models related to the modified Helmholtz equation are in general ill-posed, parameter estimation with the bioheat equation is extremely challenging: the expected resolution at depth can not compete with image-based guidance. Since ill-posed inverse problems are commonly regularized using prior information from an ancillary imaging modality, it is doubtful that this approach will have advantages over ultrasound thermometry, even in the developmental stage.
4. Ultrasound Considerations for HIFU Monitoring
In this section, we review both the types of ultrasound acquisition geometries employed in ultrasound thermometry and ablation monitoring, the various types of raw data that are incorporated in the subsequent temperature estimation problem, and the potential forms of ultrasound contrast that can be exploited.
4.1 Ultrasound Acquisition Geometries
Passive
Passive acoustic mapping is a recent area of interest for monitoring HIFU. At present, it appears to be only applicable to detecting non-thermal signals from processes such as cavitation. However, since the passive acoustic signals from cavitation and thermal strain are also affected by temperature-dependent changes in speed of sound and attenuation, it may be possible to estimate relative temperature changes using these signals.
In passive imaging, the instrumentation for data acquisition is relaxed since transmit control is not required. In some passive applications, a single, focused ultrasound transducer is used as a sensor to receive acoustic emissions generated in the HIFU treatment zone. Confocal HIFU and diagnostic transducer probes work in this regard. With larger array-based apertures and receiver-side beamforming, larger volumes may be monitored, and in practice diagnostic transducers may be used in this application, but they may not be optimally matched in terms of bandwidth to the acoustic emissions. In some case, the same transducer is used for both passive and active cavitation detection (27). While circular apertures associated with tomographic imaging could be utilized for passive mapping, they have not been fully explored due to the limited number of organs outside the breast and brain that can be investigated with ultrasound tomography.
Pulse-echo
Pulse-echo is the most common ultrasound geometry due to its routine use in diagnostic ultrasound instrumentation. Exploiting the principle of reciprocity, an ultrasound transducer is used to both transmit an acoustic wave into tissue and receive waves that arise through interaction processes inside the tissue. If the interaction of the ultrasound wave with tissue is temperature dependent, then the signals received as echoes will exhibit some modulation from which temperature could ideally be estimated. As with the passive geometry, single element and array-based transducers are both commonplace. Depending upon the nature of the temperature estimation method, entire portions of the normal diagnostic ultrasound image formation chain can be utilized as is.
Pitch-catch
If the transmitter and receiver transducers are distinctly off-set from each other, then a pitch-catch geometry is invoked. Unlike pulse-echo, pitch-catch geometries facilitate transmission of acoustic waves through tissue sections if the transducers are facing each other. The information content for transmission signals is in many ways complementary to reflected signals in pulse-echo. For example, the transmitted acoustic wave is more directly influenced by speed of sound (as seen in propagation time) than the subtle effects of speed of sound on pulse-echo data. While pulse-echo is sensitive to changes in attenuation due to scattering, the transmitted wave is directly modulated by attenuation due to both scattering and absorption. The most complete pitch-catch geometry is of course the full aperture tomographic geometry, where transmitted waves are captured along with waves scattered at all angles.
Hybrid
Hybrid geometries combine ultrasonics with another imaging modality to produce an imaging system with increased performance. The hybrid imaging geometry of most interest in thermometry is photoacoustics: high spatial resolution but low contrast ultrasonics is combined with techniques from optical imaging where the resolution is poor but the contrast due to endogenous chromophores is good. In the photoacoustic geometry, a brief but intense pulse of light is produced by a nanosecond laser capable of outputting more than 10 milliJoule per pulse on the order of 10 times per second. Due to differential optical absorption, small temperature increases in tissue lead to thermal expansion and the subsequent generation of an acoustic wave. Similar to passive imaging above, ultrasound receivers can be synchronized to the illuminating light, and the photoacoustic waves can be detected. Reconstruction of the sources of the photoacoustic waves can be accomplished either by raster-scanning a focused transducer or through receiver-side beamforming with arrays.
4.2 Data Types
The numerous ultrasound temperature estimation algorithms found in the literature span the entire image formation chain. At the lowest level, a temperature estimation algorithm can work with the raw RF data from the ultrasound transducer or array (the so-called channel or pre-beamformed RF data). Data at the level of the individual transducer is only available on select ultrasound research platforms (ex. Verasonics). More commonly, the post-beamformed RF data is available, and in some cases this has been demodulated at the center frequency and filtered into in-phase/quadrature-phase (I/Q) data. I/Q data are also available on some systems for pre-beamformed channel data. In clinical ultrasound systems, data up to this point in the image formation chain are available only in few, select systems from a minority of vendors. At the highest level, temperature estimation algorithms can take as input the processed images produced by the scanner, including B-mode, Doppler, and in the latest generation of clinical devices elastography images. The speed at which these images can be derived from a clinical device is highly variable and an important consideration for research purposes. It should also be noted that recent ultrasound research platforms also allow significant transmitter-side control, including arbitrary waveform generation and the integration of HIFU interleaved with imaging in custom probes.
4.3 Contrast
The predominant source of ultrasound contrast is variation in acoustic impedance, the product of density and ultrasound velocity. In the vast majority of ultrasound applications, variations in density are essentially ignored. Even in ultrasound tomography, modeling and image formation using the constant density wave equation is much more common than the variable density wave equation. While direct detection of temperature dependent changes in density are not possible with ultrasound, the underlying thermal expansion or contraction can be detected using strain based techniques, as described below.
The speed of sound (SOS) in mammalian tissues is also temperature dependent (28). For fat, the ultrasonic speed decreases monotonically with increasing temperature. For most tissues, however, the speed of sound increases, levels off near 60° C, and then decreases at higher temperatures. It is unfortunate that the regime where the SOS sensitivity to temperature is lowest is also in the range where tissue destruction occurs in ablative treatments. So while methods that estimate SOS may be applicable to hyperthermia temperatures below 50° C, temperature estimation in the ablative zone is challenging.
While the attenuation of water is known to decrease monotonically with temperature (28, 29), attenuation measurements in various tissues produce mixed results. Complicating the attenuation measurement is the fact that attenuation is also frequency dependent. In bovine tissues, attenuation decreases with temperature until a point above 50° C where the attenuation begins to rise. For canine muscle, liver, and kidney, ultrasound attenuation was reported to double between 50° C and 65° C (30). Bamber and Hill did not observe this attenuation rise in human liver, but Techavipoo reported similar sigmoidal behavior in canine liver (31, 32). Qualitative 3D maps of relative ultrasound attenuation changes have also been reported as indicative of tissue coagulation for other thermal therapies (33–35).
Since ultrasound is a coherent imaging modality, it is sensitive to multiple scattering centers in a single resolution cell. The subsequent speckle has proven to be a useful tool for estimating thermal strain and for motion estimation that must be dealt with in many in vivo applications. For that reason, image formation chains that utilize techniques to reduce speckle (ex. spatial and frequency compounding, tomography) may not be optimal for temperature estimation methods that rely on speckle tracking.
Bubbles in the thermal treatment zone have one of three sources: cavitation (both inertial and non-inertial), gross tissue boiling, or an exogenous source in the form of a contrast agent. Since boiling is a clear indication that certain temperature thresholds have been reached, efforts have succeeded in monitoring the onset of boiling using passive acoustic detectors. Cavitation bubbles occur before boiling and are a function of ultrasound power, not temperature. In many cases, cavitation is a nuisance to be minimized, since it distorts most ultrasonic ablation monitoring techniques. Some groups have reported both active and passive detection of cavitation bubbles for therapeutic monitoring. Doppler imaging modes, which are sensitive to both flow and exogenous contrast agents such as microbubbles, have recently been used in HIFU studies. Li et al more recently described the combination of color, pulse-inversion, and decorrelation Doppler to detect pulsed HIFU-induced cavitation bubbles with short transient times (36). Color Doppler has also be used to detect hollow silica nanoshells delivered to a tumor to enhance the HIFU therapy (37).
At temperatures below boiling, other phase transitions can occur in tissue due to chemical and structural modification of proteins and other cellular components. These changes are generally classified as coagulation, but surprisingly these changes are not reliably monitored using B-mode ultrasound. Coagulation also leads to destruction of tissue blood flow and perfusion. Using B-flow imaging, a non-Doppler mode for imaging blood flow, Andrioli and Valcavi reported monitoring of RF ablation in the thyroid (38). This method has not been tested with HIFU ablation though.
The ultrasound nonlinearity parameter B/A has also been reported to exhibit temperature dependence. Using a technique that appears similar to but antecedes vibroacoustography, Ueno at al reported a hyperthermia thermometry system targeting this parameter with validation studies in pig thigh (39). Van Dongen and Verwij also reported using the non-linearity parameter to estimate temperature in a glycerol-based phantom (40) using the Burgers equation as the model.
To test ultrasound thermometry and ablation monitoring methods, appropriate phantoms are required (41). In many cases, phantoms and standards adopted from the HIFU literature are utilized (42). Recently, a dual modality (ultrasound and CT) phantom specifically for noninvasive ultrasound thermometry calibration was reported using agarose mixed with variable amounts of fat-mimicking glyceryl trioleate (43). Gelatin-based phantoms that match both the acoustic and thermal properties of tissue are also possible (44).
5. Specific Strategies for Ultrasound Thermometry and Ablation Monitoring
The ideal ultrasound ablation monitoring system would provide accurate, precise, and quick measurements of tissue temperature in the range from 37° C to boiling. Unlike MR thermometry, however, nature is not kind and conspires against the use of ultrasound thermometry above 50° C through a variety of physical and acoustic complexities, including non-linear temperature dependencies of contrast parameters, tissue phase transitions, and the stochastic generation of cavitation bubbles. In general, ultrasound thermometry is only applicable for tissue hyperthermia. For HIFU tissue ablation, non-thermometric ultrasound methods are required for therapy monitoring.
5.1 B-mode Imaging
In general, the diagnostic ultrasound imaging can not take place while the HIFU treatment is active, but rather must be interleaved. Even with a 10–15 millisecond delay after cessation of HIFU, a 31.25 ms interference band artifact was reported on B-mode imaging (45). A recent report however described a potential method for simultaneous HIFU therapy at 4 MHz with ultrasound imaging in the 3–9 MHz bandwidth using pulse compression and the application of second order infinite impulse response notch filters on the received data to eliminate cross-talk from the HIFU (46). Pulse inversion has also been described as a method to facilitate simultaneous US therapy and imaging (47).
The correlation between increased echogenicity and temperature in tissue is slight. In one study, a correlation coefficient of r=0.455 was reported (48). It is assumed by many groups that the relationship between B-mode echogenicity and temperature is complicated by the fact that the structures that result in increased echogenicity (and in some case post-lesion shadowing) also severely modulate the HIFU beam and the subsequent temperature distribution, potentially leading to overtreatment. While B-mode ultrasound is available on clinical HIFU systems popular in China, the feedback from the imaging modality is often qualitative (49, 50).
Alvarenga, Teixeira and collaborators have studied the possibility of using the grey-level co-occurrence matrix (GLCM), the GLCM-derived entropy, and the average gray-level content (AVGL) to estimate temperature in vivo (51–53). Since there is excellent correlation between temperature and these B-mode image-derived indices up to 44° C, these easy to implement methods could be utilized for quantitative monitoring of hyperthermia. Unfortunately proof-of-principle studies have been limited to only phantoms and tissue samples.
As described below in thermal strain imaging, a subset of systems and groups use the B-mode image for speckle displacement estimate, but the trend is clearly toward using lower level RF data from the scanner.
5.2 Nakagami imaging
Ultrasound Nakagami imaging is a recently developed mode of imaging that spatially maps the shape parameter for an assumed probability density function for the backscatter envelope (54–56). The Nagakami distribution is defined by two parameters: m and a scaling parameter Ω:
where Γ is the gamma function, and U is the Heaviside step function. The Nakagami parameter m can be directly estimated from statistical averages of the envelope R of the backscattered ultrasound signal (available either indirectly from RF data or directly in B-mode images)
The scaling factor is simply the time-average intensity:
During HIFU, both cavitation and boiling may produce bubbles that produce acoustic shadowing. Zhang et al at Xi’an Jiaotong University (China) explored the potential of using Nakagami imaging to overcome the artifacts in traditional B-mode images (57). By inserting a digitizer at the appropriate point in a modified diagnostic ultrasound scanner (DP9990, Mindray Inc., China), they captured all post-beamformed RF lines and estimated the Nakagami parameter along each A-line using a 1D sliding window. 2D Nakagami images were then derived from the collection of A-lines. They found that the Nakagami parameter was statistically higher in the zone of thermal ablation compared to any regions where bubbles formed. However, the lesion size predicted by the Nakagami image underestimated the true lesion size as confirmed in polyacrylamide+BSA phantoms. More recently, the same group has proposed a lesion-to-bubble ratio (LBR) derived from Nakagami (and other imaging modes) to monitor thermal ablation (58). They reported that a ratio of 2.0 on Nakagami images was indicative of protein coagulative necrosis despite shadowing of the therapy lesion by bubbles. However, the authors acknowledge that this approach may only be valid for small thermal lesions.
The Tsui group at Chang Gung University (Taiwan) have also explored Nakagami imaging for monitoring both RF (59) and ultrasound ablation. Compared to B-mode imaging, the Nakagami image exhibited better contrast-to-noise ratio in the lesion versus background. Although using microwave ablation for their investigation, the Nakagami images were produced from a Terason commercial ultrasound system (Burlington, MA, USA) using a Nakagami window three times the width of the transmitted pulse. In a related study of the temperature-dependence of the Nakagami parameter and derived parameters such as absolute regional ratio of change in Nakagami parameter (ACRN), the same groups reports that “the magnitude of change in the statistical distribution of the backscattered-signal envelope is a monotonic function of temperature over a temperature range from 37° C to approximately 45° C (60). Since these methods involve a polynomial fit to the derived data, this latter work includes a discussion of the potential differences in appropriate polynomial for HIFU versus RF and microwave ablation.
In a recent report, investigators in Toronto, Canada and Tehran, Iran reported similar experiences with Nakagami imaging using a confocal arrangement of a HIFU transducer with an endocavity convex array probe applied to ex vivo porcine muscle (61).
5.3 Speckle Tracking and Thermal Strain Imaging
In an imaging scenario with no motion, the apparent displacements of the ultrasound speckle due to localized heating is correlated with both changes in the speed of sound and thermal expansion of the tissue. Local displacements can be estimated from the time shifts Δt in the RF data, and given a known speed of sound C0 at baseline temperature T0, the temperature change can be related to the rate of change of time shifts with depth z:
where α is the thermal expansion coefficient and the speed-of-sound sensitivity to temperature is known ( ). This linear relationship is most often assumed to be valid for hyperthermia below 50° C. In the range above 50° C up to phase transitions such as coagulation, the relationship is non-linear and may be difficult to calibrate. A more complete derivation of the basic thermal strain theory can be found in a recent review (62).
Since both the thermal expansion and the change in ultrasound velocity lead to shifts, it is important to understand the relative contribution of these two competing processes. In general, the change in speed of sound dominates thermal expansion by an order of magnitude (63–65). Souchon and colleagues modeled the contributions of thermal expansion and speed of sound change in a 1D model (66). As shown in Figure 1, the largest echo strain is shifted to lower temperatures compared to the temperature of maximum speed of sound. Thus, there is the potential for quantitative temperature measurements above 60° C provided that the speckle pattern is not destroyed by coagulation or other destructive phenomena.
Figure 1.
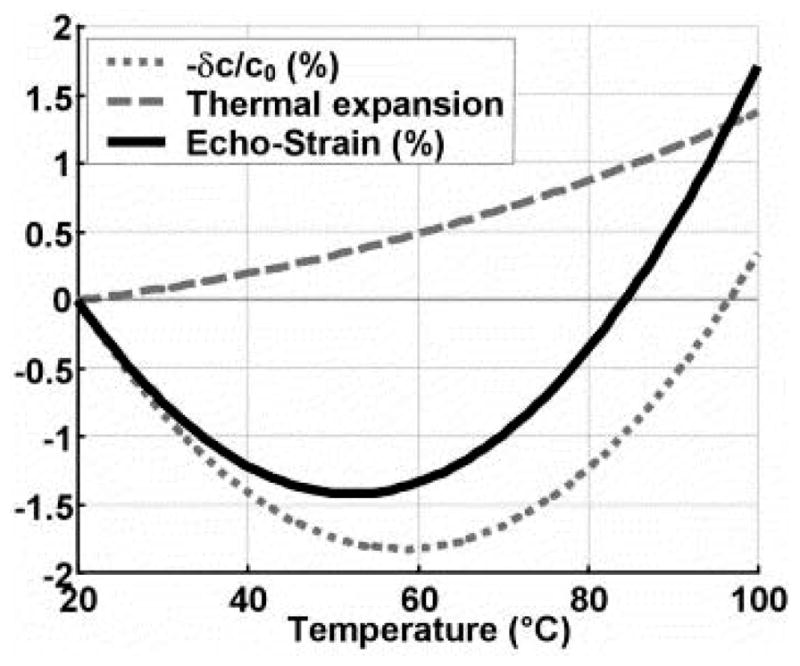
1D simulation of relative contributions of SOS change and thermal expansion to observed strain. Reprinted, with permission, from Souchon et al, 2005 (66).
In pioneering work, Seip and Ebbini modeled the RF A-line signal as an autoregressive (AR) model of discrete tissue scatterers that are shifted by thermal expansion and pseudo-shifted by changes in speed of sound. Through careful analysis, a relationship between the temperature change and changes in the power spectral density (PSD) for this model were developed and tested in phantoms (67). Of particular note, the authors commented that standard data analysis techniques using the fast Fourier transform would not be able to detect temperature changes on the order of 1° C. By utilizing the AR PSD approach however, arbitrary subdegree temperature resolution is enabled, subject to noise considerations.
In practice though, cross-correlation techniques quickly supplanted the original PSD approach (64, 68). To estimate displacements in either RF data or B-mode images, the most common algorithm today is the maximum normalized cross-correlation:
where S0 and S1 are the baseline and subsequent ultrasound data, with the bar quantities denoting spatial averages. A straight two-dimensional cross-correlation is known to be sensitive to changes in intensity. The kernel or window area for the cross-correlation must also be considered. We note in passing that these methods can also be applied to regions-of-interest (ROIs) outside the HIFU intent-to-treat zone. In those cases, displacements are related to gross motion of the animal or patient, and this information can be used for motion correction or compensation with other temperature estimation methods (see backscatter section below). For real time temperature imaging, speckle tracking algorithms have been implemented on graphical processing units (GPUs) (69–72). The 500 Hz temporal resolution reported in Liu and Ebbini (69, 71) is probably the best reported in the literature. This extreme temporal resolution is not useful from a heat transfer perspective, but it may be advantageous for minimizing artifacts due to respiratory and cardiac cycles in limited fields-of-view and for rapidly detecting bubble formation.
The other important aspect of this model is that the temperature change is related to the gradient of the time shifts as a function of depth. This gradient can be numerically calculated by a variety of methods. In Lai et al, the Sobel operator is recommended since it has a smoothing effect which offsets the increase in noise associated with numerical differentiation (73). An alternate approach also adopted from elastography is to estimate the displacement using a local parametric model, avoiding differentiation. Ye et al reported the implementation of an iterative Kalman filter to estimate a model-based temperature map from B-mode images (74). A typical processing pipeline for thermal strain imaging as described in (73) is reproduced in Figure 2.
Figure 2.
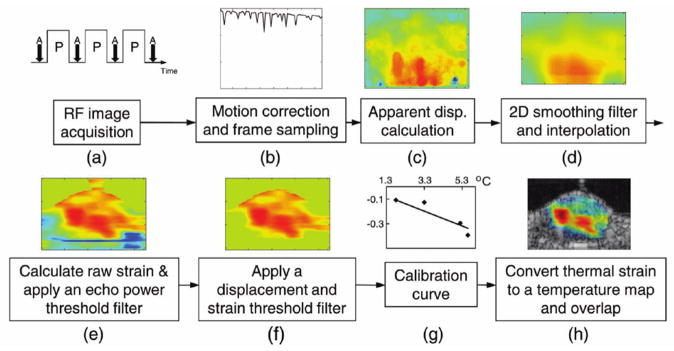
Prototypical thermal strain image formation chain. © 2010 IEEE. Reprinted, with permission, from Lai et al, 2010 (73).
Adolhassani and colleagues reported that isotropic speckle-tracking kernels from 2 mm to 4 mm had similar performance when maximum normalization cross-correlation was applied to B-mode images (75). In later work, Mehrabani et al utilized the Horn-Shunck method for visualizing optical flow to estimate the speckle displacement (76). Their B-mode ultrasound thermometry technique was ultimately tested in a sheep model where occlusion of the renal segmental artery led to a decreased renal lobular temperature (77).
When strain imaging was used for qualitative ablation monitoring during HIFU, the contrast for strain imaging was superior to B-mode imaging. The Chapelon group reported a mean contrast ratio between treated and untreated ROIs in porcine liver to be 22.0 ± 10.3 dB for strain images compared to 9.3 ± 5.5 dB (78). The B-mode image analysis was complicated by the fact that the treated zone exhibited both hyper- and hypo-echoic subregions. When analyzed separately, neither subzone contrast was better than strain imaging. Ultrasound in this work was however applied at rather high frequency (12 MHz). Miller, Bamber, and Meaney analyzed the minimum signal to noise ratio in strain images that would be required to visualize a thermal lesion of a known size: in this case, an ellipsoid 10 mm long and 1 mm wide (79). The authors estimated that strain images with an SNR greater than 20 dB exceed the threshold for detection. In the case that the thermal lesion size is unknown, they reported a lower bound on the SNR threshold for size estimation of 26 dB. Miller and colleagues also analyzed echo strain imaging for coaxial and perpendicular geometries relative to the HIFU transducer (80). In an atypical coaxial geometry, the imaging transducer was opposite the therapy transducer. Although the coaxial geometry is more appropriate for clinical utility, the perpendicular geometry actually exhibited a higher contrast-to-noise ratio (2.00 ± 0.72 vs 0.37 ± 0.24). In more recent work, this group attempted to calibrate the relationship between strain and temperature deviations up to 8° C using a 2nd order polynomial model (81).
Thermal strain imaging has been one of the most prolifically studies methods for estimating temperature with ultrasound. Many groups have reported success using techniques of this type, but for the sake of brevity, the interested reader is also directed to the following literature: (82–91). Some continued work on temperature estimation using frequency shifts in the spectral domain due to thermal strain has been reported (92, 93). Frequency domain estimation of pulse-echo time shifts has also been reported using a zero-crossing detector (94–96). Recently, axial-shear strain elastograms have been proposed as an improvement to traditional axial-strain elastograms in thermal strain imaging, especially when cavitation bubbles are present (97). Using strong reflectors in tissue (ex. implanted thermocouples), Teixeira and colleagues in Portugal utilized neural networks to estimate temperature from echo-shift RF lines (98–100). In their initial work, the neural network input consisted of five data channels for five scatterers. It is not clear if this approach would scale to systems for speckle tracking.
In a separate approach, ultrasound-estimated strain has also been used to estimate the thermal diffusivity K (m2/sec) in tissue. Anand and colleagues showed that the rate of change of a secondary parameter derived from the estimated strain and displacement profile widths is directly proportional to K (101). They used this noninvasive procedure to estimate K for the bioheat equation inverse approach described in the Passive section below. The authors proposed that a spatial map of K over a larger region of interest containing the target zone would be feasible.
The achievable spatial resolution of thermal strain imaging is limited by the same physical considerations as in ultrasound elastography (102). The size of the spatial kernel utilized in speckle tracking directly influences both the SNR and the spatial resolution of the strain image, but with opposite effects. In practice, Shah et al reported using an anisotropic kernel (0.6 mm axial vs 2.1 mm lateral) as a compromise between these competing outcomes (103), but the optimal kernel may be tissue and depth dependent. In their phantoms, the lateral spatial temperature resolution was reported to be on the order of several millimeters, while in the axial direction the resolution was sub-millimeter. For further investigation of the effects of SNR on echo strain estimation for thermometry, the reader is also directed to early work in Miller et al (79).
5.4 Tissue Stiffness Monitoring and Elastography
The mechanical properties of soft tissue are temperature dependent, and both bulk and shear elastic properties exhibit changes with temperature (104–106). The temperature dependence is non-linear, with a large transition occurring when tissues undergo thermal coagulation (107). A number of groups have investigated the possibility of exploiting this physical property of tissue to monitor or control a thermal ablation therapy, with both ultrasound and MRI. Most efforts have focused on utilizing this effect for mapping or visualizing the region of thermal coagulation in tissue after treatment is completed due to the large change in mechanical properties that occur after reaching this endpoint in tissue. Indeed, before the development of thermal strain imaging, classical ultrasound elastography using strain estimation was reported to be sensitive to changes in strain contrast due to both acoustic and optical thermal delivery (108–110). However, some methods have attempted to track the changes in mechanical properties dynamically during heating to track temperature of stiffness changes as they occur.
There are obvious links between tissue stiffness monitoring and the previously described thermal strain imaging methods. In some case, similar data analysis methods are used for both. For example, Sumi et al used estimate displacement and strain in paired RF data frames to solve for the relative change in shear modulus after coagulation in fresh calf liver (111). Quasi-static elastography with a compression plate can also be used to monitor lesion stiffness after ablation (112), but both the pre-post contrast-to-noise ratio (CNRe) and tissue modulus are non-linear with temperature.
5.4.1 Shear wave thermometry
Imaging of shear wave propagation in tissues is possible with both MRI and ultrasound (113, 114). In the case of ultrasound this can be accomplished by generating tissue displacements remotely in tissue through the radiation force principle or low frequency mechanical stimulation. The displacement of tissues results in shear waves propagating from the location of the displacement, at a speed of approximately 2–8 m/s. Ultra-fast ultrasound imaging can be used to track the propagation of these shear waves, which is related to the underlying shear elastic properties of the tissue. One method developed for this type of imaging is referred to as supersonic shear wave imaging (115) in which a series of localized focal regions are generated in a linear fashion with depth in tissue, generating a cylindrical shear wave around these points. This serves to cover an entire imaging field of view with shear waves, enabling mapping of the elastic properties throughout a region of interest. One of the first applications investigated with this technique was the visualization of thermally-induced lesions in tissue due to the inherent change in elastic properties upon undergoing thermal coagulation (116). A factor of three-fold increase in shear modulus was measured in coagulated chicken breast using this technique in this preliminary study. Subsequent to this work, the same group demonstrated the ability to visualize thermal lesions after RF ablation in vivo in a pig model using shear wave imaging (117). In this study, the mean elasticity of lesions was 38.1 ± 2.5 kPa versus 6.4 ± 0.3 kPa in normal liver. The authors concluded that by using a threshold of 20 kPa, the presence of coagulation could be detected with a sensitivity of 0.8 and a positive predictive value of 0.83 in vivo, which represents some of the best data to date reported for ultrasound imaging of coagulated tissue. In addition to visualization of thermal coagulation in tissues, Arnal et al (118) investigated the temperature dependence of the shear modulus using shear wave imaging, to evaluate the potential to use this imaging method for thermometry. The changes in shear modulus with temperature were compared to the temperature also measured with ultrasound imaging (using the method of Seip (67) ), and a strong correlation was observed for heating below 40°C. These measurements in ex vivo tissue samples indicated a change of approximately 1kPa/°C in muscle and the authors suggested this may have application for monitoring temperature changes below 45°C. They also claimed that this method was very robust to motion which overcomes one of the limitations of traditional echo-shift approaches for ultrasound thermometry. Similar trends in the shear modulus with temperature and coagulation have been observed in other studies using 1D transient elastography (119, 120). Sapin-de Brosses et al performed a series of studies investigating the relationship between shear modulus as measured with shear wave imaging and thermal dose in excised tissues and in vivo (104, 105). As highlighted in Figure 3, these studies identified a strong dependence of shear modulus with temperature and thermal dose, with different trends observed across tissue types and in the case of muscle depending on the orientation of the measurement with respect to fiber orientation. The in vivo studies, performed in rat muscle, demonstrated a consistent increase in shear modulus of at least five times upon reaching a thermal dose of approximately 150 cumulative equivalent minutes at 43°C (CEM 43). When the time required to cause this stiffness increase was plotted against the temperature of the muscle, an exponential relationship that overlapped with previous measurements of the same relationships for cells was observed. Through this careful analysis, the authors were able to conclude that the changes in stiffness observed with shear wave imaging were indicative of cellular necrosis. This work represents some of the more thorough evaluations of the use of ultrasound imaging for monitoring temperature and thermal damage.
Figure 3.
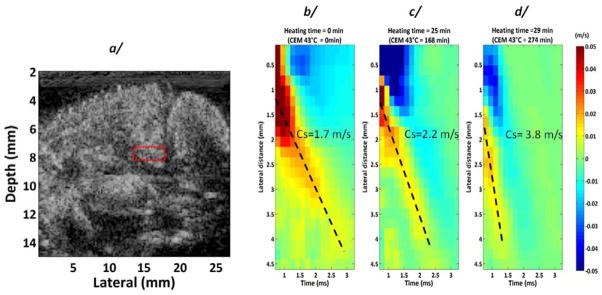
Variation of shear wave velocity as a function of temperature, as assessed using shear wave elastography. © 2011 Institute of Physics and Engineering in Medicine. Reproduced by permission of IOP Publishing from Sapin-de Brosses et al, 2011 (105). All rights reserved.
In shear elasticity estimation using speckle tracking, the axial spatial resolution is dependent upon the correlation time window widths and delays (121). Using a total data acquisition time of 23 ms, a pulse repetition frequency of 3500 Hz, and 2.4 microsecond correlation windows with 60% overlaps, Benech and Negreira reported a 0.7 mm axial spatial resolution in a 1D transient elastography geometry (119).
5.4.2 Local Harmonic Motion (LHM) imaging
This method, also referred to as Harmonic motion imaging (HMI), is more of a coagulation monitoring technique using ultrasound. The principle is based on the idea that an amplitude modulated acoustic wave can be used to simultaneously heat and perturb tissue in a harmonic fashion. The amplitude modulation is typically less than 100Hz in most studies and produces motion in the 10–50 μm range. The harmonic motion generated in tissues is dependent on the local absorption of ultrasound energy as well as the underlying mechanical properties of the tissue. The technique monitors the displacement of the tissue element undergoing harmonic oscillation, and relies on the premise that upon coagulation, the changes in absorption and mechanical properties produce a measurable change (typically a reduction) in this displacement. This change in displacement can be used to indicate when coagulation occurs and can be used to terminate a sonication in the absence of a direct temperature measurement. The method was first described by Konofagou and Hynynen in 2003 (122) as an alternative to ultrasound stimulated acoustic emission imaging, and was later evaluated for its diagnostic applications. In parallel, efforts were also made to evaluate the application of this technique for monitoring and controlling focused ultrasound surgery. A series of studies were performed in muscle and implanted tumors in rabbits comparing the signals obtained using LHM during HIFU with temperature measurements acquired using MR thermometry to validate the technique against an accepted standard (123, 124). These studies demonstrated a repeatable change in LHM amplitude that was frequency dependent and typically higher at lower frequencies (<100Hz). They also indicated that the difference in LHM between native and coagulated tissue was significantly different and occurred at temperatures and thermal doses associated with thermal coagulation. In a study in implanted tumors it was observed that control of HIFU exposures using LHM resulted in successful coagulation in 69% of the exposures delivered (123, 125). Similar results were observed in excised tissues, gel phantoms and in vivo by Maleke and Konofagou (126), with these authors presenting M-mode imaging of the HIFU exposed region as a function of time to estimate the extent of thermal coagulation depth in tissue (127). These results were obtained using a confocal imaging and therapy system enabling B-mode monitoring of LHM during HIFU (128). The results in vivo from this group indicated an LHM amplitude before and after coagulation of a mammary tumor from 27.34 ± 1.34 to 20.98 ± 1.82 μm across 16 lesions. Using GPU processing, real-time harmonic motion imaging has been reported (129). A review of results and progress with this technique was recently published by Konofagou et al (130).
5.4.3 Stimulated acoustic emissions
The method of ultrasound stimulated acoustic emissions (USAE), or vibroacoustography, was introduced in 1998 (131), and is a technique for probing the mechanical properties of a medium through the use of two incident ultrasound waves with a slight frequency difference. The technique is based on the idea that the frequency difference between the beams (typically in the low kHz range) results in an oscillatory mechanical stimulation of tissue. This results in an acoustic emission that can be measured with a hydrophone or acoustic sensor, and is reflective of the underlying mechanical properties of the tissue. Building of earlier simulations work, Konofagou investigated the temperature dependence of this signal in excised muscle and fat tissue samples and observed a correlation between the USAE signal and temperature measured by a thermocouple at the focus of an ultrasound beam in both tissues (132, 133). The change in the USAE signal was measured to be approximately 0.8–1%/°C, and was most linear between the range of room temperature to approximately 45°C. Above the coagulation threshold, nonlinear responses were observed, and the response was different between fat and muscle. One challenge with this technique is that the signal depends both on the change in absorption and stiffness of tissue with temperature, and decoupling these two effects from the signal is impossible. Later investigations suggested that a strong frequency response exists in the temperature dependent USAE response, and that the shift in frequency may be a more robust method for temperature measurement in tissue using this technique. Since this body of work, the technique has not progressed, and no results in vivo have been presented.
5.5 Backscattered Energy and Quantitative Ultrasound
Scattering cross-section depends on differences in the compressibility and density of a sub-wavelength scatterer with respect to the surrounding medium. The compressibility of the two materials changes with temperature based on their respective temperature-dependent changes in speed of sound, which results in a change in the scattering coefficient. Changes in scattering properties can be quantified by measuring the change in backscattered power received from a heated tissue volume, relative to power received at resting temperature (134).
Simulations from Straube and colleagues suggest that changes in backscattered energy will be monotonic with temperature for individual scatterers (134) and in images of random distributions of scatterers (135). Experimental results in ex vivo tissue samples confirmed that CBE is monotonically positive (increasing power) with increasing temperature for lipid-based scatterers, and negative (decreasing power) for aqueous scatterers. For collections of heterogeneous individually tracked scatterers in 1D (136), or for image regions in 2D (137) or 3D (138), the overall standard deviation of the CBE was monotonically positive in the range of 37 to 50°C. At 7.5 MHz, the calibrated temperature sensitivity of CBE was 0.300 ± 0.016 dB/°C (linear correlation coefficient 0.991–0.999) in ex vivo turkey breast, which allowed temperature measurement with 0.5°C accuracy and 1 cm3 resolution in other samples of the same tissue type (138).
The accuracy of this technique depends on tissue composition, region size, SNR, and apparent motion. Because the technique aims to compare backscattered energy for individual scattering regions, the RF data must be compensated for changes in apparent scatterer location caused by changes in speed of sound or motion. In 1D, echoes from individual scattering regions were manually identified in the RF waveform and compensated (136). For 2D and 3D CBE quantification with a linear phased array diagnostic probe, automatic echo-tracking was accomplished by maximizing cross-correlation of the RF signal between consecutive images using either rigid (137) or non-rigid (138) registration. During homogeneous water bath heating and heterogeneous HIFU hyperthermia, 2D non-rigid registration identified and corrected between −0.1 and 0.7 mm of displacement in the axial direction where speed of sound changes are expected, and −1.1 to 1.1 mm (mean 0.4 mm) in the lateral direction which are primarily due to motion (139). In three mouse tumors heated from 37.5 to 43°C with HIFU, after motion compensation, the means of image pixels with positive CBE monotonically increased by a mean of 3.5 dB (3.1 to 3.6 dB); the negative CBE monotonically decreased by −3.4 dB (−2.0 to −4.5 dB). Li et al reported similar findings for small transducer displacements in both elevation and axial directions (140). Breaking from the motion- and echo shifted-compensation CBE paradigm though, Tsui and colleagues proposed in 2012 that CBE imaging without echo shifting may have improved sensitivity to increased temperature detection (141).
Seo and colleagues reported using an L7-4 transducer with the Verasonics data acquisition system to monitor HIFU treatments in tumor bearing mice (142). While they utilized CBE for temperature estimation, speckle tracking was also employed for a motion-mapped reference model. Motion compensation reduced the RMSE for temperature estimation from 4.2° C to 1.1° C.
In a related method, techniques from quantitative ultrasound for tissue characterization have been used to assess the effects of different thermal doses. The Oelze group measured both attenuation and backscatter coefficient (BSC). Using a parametric model of the backscattered signal, the effective scatter diameter (ESD) and effective acoustic concentration (EAC) were also estimated (143). In the hyperthermia range below 50° C, attenuation changes up to 10–20%, BSC changes of an order of magnitude, and 30% changes in ESD and EAC were all reported as more sensitive than thermally-induced changes in speed of sound. In their most recent work (144), the relationship between ESD, EAC, and temperature was extended up to 80° C in experiments with in situ rat tumors. Good linear regression with temperature was observed in three out of four rats. The interested reader should also consider exploring the existing literature on the use of quantitative ultrasound for detecting other forms of cell death in vivo (145).
In another non-thermal strain technique that uses post-beamformed, I/Q data, Mast and colleagues at the University of Cincinnati have explored echo decorrelation imaging, which is dependent upon the formation of an integrated backscatter image (146). Echo decorrelation imaging is reported be more robust to tissue motion and bubble activity than thermal strain imaging, but at higher temperatures the images are qualitative, not quantitative. Initial application of this technique was for RF ablation, but the technique should be compatible with HIFU (147).
In terms of temporal resolution, proponents of CBE report temperature maps upgraded every 1 to 2 seconds, which is competitive with MR thermometry (138). While the temporal resolution is limited by the specific imaging hardware that implements CBE and the volume of interest, the authors developed a five-image 3D image acquisition that ran at 10 Hz. The ultimate temporal resolution was reduced by subsequent 3D motion compensation for the central slice and CBE processing.
5.6 Phase-contrast and Thermo-acoustic Lensing
Changes in the speed of sound due to temperature modulation can also be viewed as another form of phase aberration. In a transmission pitch-catch geometry, the received signal is sensitive to these slight aberrations, and this idea for thermometry was explored as early as 1977 by Sachs and Janney in fixed human brains (148). Of particular note in this early work, the authors reported a spatial resolution better than 3 mm. Extending this approach, Clement and Hynynen developed a frequency-domain phase contrast filter to directly image the aberrations created by an orthogonal HIFU transducer (149, 150). To test this method, they simulated a continuous wave signal transmitted through a treated tissue and then detected using an array with time-averaged field intensity sensitivity. Since this algorithm is sensitive to attenuation, frequencies below 1 MHz were simulated. At a localized heating event at the interface of fat and soft tissue, they report the successful mapping of a 5° C temperature anomaly in both tissue compartments. The spatial resolution for ultrasound phase contrast thermal imaging can potentially be superior to MR thermometry. Farny and Clement recently reported 0.3 mm isotropic spatial resolution with a 1.68-MHz center frequency (150). Phase contrast in transmission ultrasound has also been reported to have sufficient sensitivity to detect sub-100 milliKelvin temperature increases associated with radiation therapy (151)!
The phase aberration due to this thermal lens effect was also studied by Le Floch et al since it also produces self-defocusing in the therapy beam (152) and is known to corrupt other temperature estimation methods. For pulse-echo temperature estimation methods, spatial compounding has been proposed and investigated as a method to reduce the effect of phase aberrations due to thermo-acoustic lensing in ultrasound temperature estimation (153). With seven steered plane waves utilized in the spatial compounding, the variance in the temperature estimation was reduced in half.
5.7 Ultrasound tomography
Given the explicit relationship between speed of sound and temperature in water and soft tissue, it is perhaps not surprising that thermometry was proposed as an application of ultrasound computed tomography (USCT) shortly after its introduction in the 1970s (4). In the 1980s, time-of-flight tomography based on linear propagation paths was investigated for internal temperature monitoring in industrial processes (154–157). At present, a sole vendor markets an FDA-approved breast ultrasound tomography system in the United States (158, 159). The original device approval was based on reflection imaging predicates, but recently a color elastographic image (qualitative for tissue stiffness) derived from the quantitative SOS and attenuation images was also cleared. While the underlying SOS images are sensitive to temperature changes, the quantitative images are evidently not available to the clinical observer. Fortunately, there is much interest in the field for both FDA-approval and clinical indication for quantitative transmission imaging.
Ultrasound tomography employs a 360 degree aperture to collect either reflection (pulse echo) and/or transmission (pitch-catch) data. From a k-space perspective, the reflection data fills an annulus in the frequency domain and is therefore high-resolution but non-quantitative. Since the reflection ultrasound tomography image is essentially compounded over 360 degrees, there is significantly reduced speckle and shadowing compared to B-mode imaging. The transmission data however contains quantitative information on both the speed of sound and attenuation. With a suitable image reconstruction algorithm applied to the tomographic data, a map of the complex index of refraction can be generated for the tissue of interest, with the real component representing the spatially-varying speed of sound and as the imaginary, the attenuation coefficient. In advanced ultrasound tomography systems, the speed of sound map can be used to improve the reflection tomography image (160–163) which may have artifacts due to beamformers that incorrectly assume a constant speed of sound. In other cases, full wave inversion can be performed using all of the scattering data. It should also be noted that reflection and transmission tomography can be performed with the same transducer if a strong reflecting surface is placed on the opposite side of the object (164–166).
The most significant disadvantage of ultrasound tomography-based thermography is the inferior temporal resolution. Most systems use a gantry to rotate reflection and transmission transducers around the object to produce a 2D slice. Motion of the gantry in elevation then produces a stack of images in three dimensions. To generate new speed of sound images in intervals less than 5 seconds would require the engineering of non-rotating, high channel count tomographic systems. The alternative is to attempt the tomographic reconstruction using less data. Zhu, Jiang, and Kato proposed and simulated limited angle USCT for temperature measurements in thermal engineering (167). In their approach, the missing projection data is extrapolated using the x-ray transform consistency conditions for a TOF, no-refraction ultrasound propagation model. It may also be possible to exploit the sparsity of temperature changes in the field-of-view by using an approach similar to keyhole MRI or compressive sensing (168).
Using a prototype USCT system, Azhari recently investigated the feasibility of HIFU-guidance using both ultrasound tomography and projection-based transmission images. For tomographic guidance, a baseline SOS image is formed and then segmented into three compartments based on SOS values: fat, non-fat, and tumor (in order of typically increasing SOS). Immediately after therapy, a second USCT image is acquired, and the SOS differential from baseline (ΔSOS) is calculated on a pixel-by-pixel basis. Using values taken from the literature, the temperature change is related to the change in SOS by a compartment-dependent coefficient:
Since this linear relationship is inexact, this method is only applicable to non-ablative hyperthermia less than 45 Celsius. For ablation application, Azhari proposes that the SOS is tracked over time, and when the SOS begins to decrease in non-fat tissues one may infer that ablation has succeeded. Given the aforementioned poor temporal resolution, this ∂SOS/∂t approach may be difficult in practice. Azhari proposes a faster approach by abandoning rotation for tomography, and instead forming a 2D TOF projection in a manner similar to phase contrast techniques above. This acquisition requires only a movement in elevation, and in a first approximation the change in TOF is a function of the integrated temperature change along a line of propagation. The quantitative accuracy of this approach will be a function of volume of the zone of treatment with best performance with the smallest HIFU therapy volumes.
5.8 Passive Monitoring
Passive monitoring strategies focus on the detection of bubble activity associated with ultrasound ablation. In general, there are thought to be two sources of bubble activity: cavitation and boiling. A less-explored source of acoustic emission is broadband emissions associated with other phase transitions such as tissue coagulation.
In a groundbreaking study (48), Mast and colleagues investigated the temperature dependence of three different types of acoustic emissions received by a 1 MHz unfocused passive cavitation detector (PCD) during HIFU in fresh bovine liver at 3.1 MHz. The PCD was oriented orthogonal to the HIFU beam produced by an array, and acoustic emissions were filter bank processed for a subharmonic band at 1.55 MHz, a 0.3–1.1 MHz broadband, and low frequency band below 30 kHz. The authors conjectured that the subharmonic band would be indicative of nonlinear bubble vibrations from stable cavitation activity, while the broadband and low frequency channels would monitor inertial cavitation and tissue boiling respectively. Acoustic emissions captured by the PCD were correlated with increasing temperature measured using an invasive thermocouple. While the low frequency and broadband acoustic emission were generally observed to increase as a function of temperature, the subharmonic emissions were not a reliable indicator of ablation rate or tissue temperature. The following year, Mast and colleagues reported passive acoustic emissions with a 192-element array operating around 520 kHz (169). Using a novel frequency domain beamformer (equation 10 in previous reference), they passively imaged sources in both simulations, PBS solution, bovine liver, and in an in vitro flow phantom with echogenic liposomes as cavitation nuclei (170). Although the linear array was 192-elements, experiments were limited to sub-apertures of 64 elements. The authors proposed that changes in temperature during HIFU therapy may alter the thresholds for inertial cavitation and the related processes such as rectified diffusion, and they offer a method for generating a “worst case” estimate for temperature elevation.
Rabkin, Zderic, and Vaezy compared the appearance time of B-mode hyperechogenicity with inertial cavitation measured with broadband PCD (0.5–5.5 MHz). They defined the onset of inertial cavitation “as the time of the first HIFU pulse in which the maximal amplitude of the broadband noise was greater than three SD above mean broadband noise measured during recordings of acoustic emissions before each HIFU exposure” (27). Above HIFU intensities of 800 W/cm2, they reported the inertial cavitation detection with PCD to precede the visualization of a hyperechoic region on B-mode by up to 0.5 seconds.
The Coussios group at Oxford also considered PCD, but using a 128 element, 38 mm aperture, 5–10 Mhz diagnostic probe (L10-5, Zonare Medical Systens, California) as the passive cavitation detector. Rather than utilizing dynamic receive beamforming with a null transmit profile, Coussios and colleagues employed a novel time exposure acoustics (TEA) beamforming algorithm that is well-suited for passive imaging of broadband and near-field sources (171, 172). They evaluated the PCD using both non-cavitating (active) sources and single bubble inertial cavitation before tests with larger contiguous and disjoint cavitating regions in agar phantoms. Compared to real human tissue where the energy deposition tends to migrate towards the HIFU transducers, the Coussios gel phantom experiments exhibited bubbles that tended to migrate away from the HIFU transducer, according to the authors due to acoustic radiation force and phantom melting. In further studies in freshly excised, degassed bovine livers, Coussious and colleagues determined at 84% correction detection rate for lesion formation with all HIFU exposures over 5.4 MPa (173). In comparison, only 53% of B-mode images with hyperechogenecity correctly mapped the lesion formation. While the lateral resolution of the PCD point-spread-function for their custom beamformer was good (1 mm), the axial PSF was predicted and observed to be on the order of 5 mm. The authors expressed a hope to reduce this limitation to below 2 mm through future developments. Indeed, in more recent work using compressive sensing-like beamformers (174) and the Robust Capon beamformer (175–177), improved axial spatial resolution has been achieved. Recent implementation of the renamed Passive Acoustic Mapping (PAM) approach on an NVIDIA GTX260 graphics processing unit (GPU) produced real time cavitation monitoring at 5 Hz (178).
In addition to ultrasonics, efforts have been made to detect acoustic emissions solely below 20 kHz due to boiling. In Anand and Kaczkowski, the authors used a medical stethoscope coupled to a microphone sampled at 44.1kHz by a standard PC sound card (101, 179). Using this approach, time domain output from the stethoscope was acquired for 45 seconds continuously, even during small time periods when the HIFU system was turned off to acquire B-mode images. After 30 seconds, the onset of acoustic emission below 2 kHz was indicative of boiling and a time to onset of boiling (tboil) was estimated. Using this boiling time, the known spatial HIFU beam profile, and the heat transfer equation (no cooling due to perfusion) in alginate and turkey breast phantoms, the local heating rate was then estimated. Since the stethoscope is an unfocused sensor, spatial mapping of the local heating rate was not possible. While Anand and colleagues utilized linear acoustics in their modeling of acoustic emission due to boiling, the Coussios group has used the nonlinear Khokhlov-Zabolotskaya-Kuznetsov (KZK) equation to model cavitation-enhanced heating, including the experimentally observed sharp temperature rises (180).
Lastly, since MRI is generally assumed to be incapable for detecting cavitation, Arvanitis and McDannold has reported attempts to co-register both MR temperature imaging and PAM in order to simultaneously monitor cavitation and temperature during HIFU (181). To accomplish this, a custom 10 meter(!) extension cable for a 128-element clinical imaging probe previously determined to be MR compatible was fabricated.
As stated above, passive cavitation detection and source localization with tomographic apertures has received limited attention (182–185).
5.9 Hybrid Methods
A variety of hybrid imaging modalities have been explored as potential solutions to the thermometry and ablation monitoring problems. In work by the Emelianov group at the University of Texas(103, 186), the contrast in photoacoustic (optoacoustic) imaging (PAI) was theoretically taken to be a function of the dimensionless Grueneisen parameter Γ which in turn is a function of both the thermal coefficient of volume expansion β and the squared speed of sound. Both of these latter parameters are temperature dependent in a nearly linear fashion from 37–55° C. Emelianov and colleagues then showed that a change in tissue temperature would be proportional to changes in the normalized photoacoustic signal:
Furthermore, they argued that the use of photoabsorbers such as gold nanoparticles as contrast agents would not change this relationship (187). In comparison to the small changes seen on ultrasound strain images with temperature, changes of up to 40% in the photoacoustic signal were observed for 9° C temperature changes. Lihong Wang and colleagues reported similar success applying photoacoustic thermometry in phantoms (188) and chicken tissue (189). In a dual modality experiment with ultrasound transmission tomography, a group at the Univeristy of Twente (Netherlands) combined a photoacoutic tomography (PAT) image with speed-of-sound tomography to measure temperature increase of up to 9° C (190).
For ablation monitoring, a reduction in the photoacoustic signal within the ablated zone has been reported with a preclinical PAI system (191). The authors attribute the reduced signal to a “reduced concentration of blood, tissue dehydration, denaturation of proteins and porphyrins, and reduction of thermoacoustic efficiency in the thermally treated tissue.” However, other researchers have reported an increased PA signal in images acquired at 720 and 845 nm in HIFU-induced thermal lesions in chicken breast (192).
One potential advantage of PAT thermometry is high spatial resolution compared to other methods (189). With a 3D tomographic geometry, Chitnis et al reported an impressive isotropic spatial resolution of 0.5 mm (191). In terms of time, though, the required signal averaging produces a 2 second temporal resolution which is not the fastest thermometry method but sufficient for in vivo applications (188). Due to optical attenuation, imaging at depths greater than 1 cm may require further trade-off in temporal resolution.
In acousto-optics, limited studies have demonstrated a reduction in AO signal during formation of a thermal lesion, but the mechanism of modulation is not well-understood (193).
In an experimental system capable of measuring both electrical impedance and ultrasound velocity in phantoms undergoing mild hyperthermia, Islam et al reported mixed reports on the accuracy of temperature estimation using combined measurements, especially when the percentage of fat in tissue was in error (194).
6.0 Conclusions
As summarized in Table 1, ultrasound methods have made significant progress in the areas of thermometry for hyperthermia below 50° C and in qualitative ablation monitoring which targets tissue coagulation and bubble formation. There is however a dearth of evidence that robust ultrasound thermometry exists for temperatures above 50° C. This shortcoming is at present adequately filled by the availability of mature MR thermometry techniques. While Nakagami imaging, axial shear strain elastograms, and echo decorrelation imaging have all shown promise for improved performance at higher HIFU power levels and temperatures, it is unknown if any of these new techniques has the quantitative precision required for real-time control.
Table 1.
Summary of various methods for ultrasound thermometry and ablation monitoring. For our purposes, current clinical equipment includes ultrasound research systems such as Verasonics and Ultrasonix that utilize FDA-approved probes. Techniques that require accessory equipment such as mechanical stimulators, lasers, or custom transducers are not included in that category even though they may include a clinical or research ultrasound system in the method.
| Method | Relative thermometry | Absolute thermometry | Quantitative 37°–50° C | Quantitative >50° C | Ablation monitoring | Detects cavitation & boiling | Implementable using current clinical equipment |
|---|---|---|---|---|---|---|---|
| PRFMR thermometry |

|
|
|
|
|||
| Spectroscopic MR thermometry |
|
|
|
|
|
||
| CT thermometry |
|
|
|
||||
| B-mode imaging |
|
|
|
||||
| Nakagami imaging |
|
|
|||||
| Thermal strain imaging |
|
|
|
||||
| Shear wave thermometry |
|
|
|
||||
| Local harmonic motion |
|
||||||
| Stimulated acoustic emissions |
|
|
|||||
| Backscattered energy & QUS |
|
|
|
||||
| Transmission imaging & ultrasound tomography |
|
|
|
|
|||
| Passive monitoring |
|
|
|
||||
| Photoacoustics |
|
|
One possible route for improvement is the combination of two or more techniques into a multi-parametric analysis. For example, Chen et al recently described a hybrid method for temperature measurement that combines changes in B-mode images with thermal strain imaging (195). For temperature deviations less than 10° C, they reported a linear relationship between their combined index (CI) and temperature, but above 60° C non-linearity was still unavoidable in pork tenderloin. It is unknown at this time however if any combination of the described methods can expand the quantitative thermometry regime to treatment temperatures above 50° C. With elastography modes now routinely available on clinical scanners, ultrasound thermometry based on thermal strain imaging may be the most appropriate technique for future clinical evaluation for thermal therapies above 50° C, especially if coupled with a secondary system for cavitation detection.
Acknowledgments
MAL acknowledges support from 1R01CA138536-01A2. RMS is a paid employee of Philips Research. RC is a CPRIT Scholar in Cancer Research supported by Grant R1308 from the Cancer Prevention and Research Initiative of Texas and has also received generous support from the MR and Evelyn Hudson Foundation.
References
- 1.Rivens I, Shaw A, Civale J, Morris H. Treatment monitoring and thermometry for therapeutic focused ultrasound. Int J Hyperthermia. 2007 Mar;23(2):121–39. doi: 10.1080/02656730701207842. [DOI] [PubMed] [Google Scholar]
- 2.Borrelli MJ, Thompson LL, Cain CA, Dewey WC. Time-temperature analysis of cell killing of BHK cells heated at temperatures in the range of 43.5 degrees C to 57.0 degrees C. Int J Radiat Oncol Biol Phys. 1990 Aug;19(2):389–99. doi: 10.1016/0360-3016(90)90548-x. [DOI] [PubMed] [Google Scholar]
- 3.Graham SJ, Chen L, Leitch M, Peters RD, Bronskill MJ, Foster FS, et al. Quantifying tissue damage due to focused ultrasound heating observed by MRI. Magnet Reson Med. 1999 Feb;41(2):321–8. doi: 10.1002/(sici)1522-2594(199902)41:2<321::aid-mrm16>3.0.co;2-9. [DOI] [PubMed] [Google Scholar]
- 4.Christensen DA. Thermal dosimetry and temperature measurements. Cancer Res. 1979 Jun;39(6 Pt 2):2325–7. [PubMed] [Google Scholar]
- 5.Pisani LJ, Ross AB, Diederich CJ, Nau WH, Sommer FG, Glover GH, et al. Effects of spatial and temporal resolution for MR image-guided thermal ablation of prostate with transurethral ultrasound. J Magn Reson Imaging. 2005 Jul;22(1):109–18. doi: 10.1002/jmri.20339. [DOI] [PubMed] [Google Scholar]
- 6.Chopra R, Wachsmuth J, Burtnyk M, Haider MA, Bronskill MJ. Analysis of factors important for transurethral ultrasound prostate heating using MR temperature feedback. Phys Med Biol. 2006 Feb 21;51(4):827–44. doi: 10.1088/0031-9155/51/4/005. [DOI] [PubMed] [Google Scholar]
- 7.Lin WL, Roemer RB, Hynynen K. Theoretical and Experimental Evaluation of a Temperature Controller for Scanned Focused Ultrasound Hyperthermia. Medical Physics. 1990 Jul-Aug;17(4):615–25. doi: 10.1118/1.596581. [DOI] [PubMed] [Google Scholar]
- 8.Saccomandi P, Schena E, Silvestri S. Techniques for temperature monitoring during laser-induced thermotherapy: an overview. Int J Hyperthermia. 2013 Nov;29(7):609–19. doi: 10.3109/02656736.2013.832411. [DOI] [PubMed] [Google Scholar]
- 9.Hynynen K, Edwards DK. Temperature measurements during ultrasound hyperthermia. Med Phys. 1989 Jul-Aug;16(4):618–26. doi: 10.1118/1.596364. [DOI] [PubMed] [Google Scholar]
- 10.Morris H, Rivens I, Shaw A, ter Haar G. Investigation of the viscous heating artefact arising from the use of thermocouples in a focused ultrasound field. Phys Med Biol. 2008 Sep 7;53(17):4759–76. doi: 10.1088/0031-9155/53/17/020. [DOI] [PubMed] [Google Scholar]
- 11.Davidson SRH, Vitkin IA, Sherar MD, Whelan WM. Characterization of measurement artefacts in fluoroptic temperature sensors: Implications for laser thermal therapy at 810 nm. Laser Surg Med. 2005 Apr;36(4):297–306. doi: 10.1002/lsm.20155. [DOI] [PubMed] [Google Scholar]
- 12.Rieke V, Pauly KB. MR thermometry. J Magn Reson Imaging. 2008 Feb;27(2):376–90. doi: 10.1002/jmri.21265. [DOI] [PMC free article] [PubMed] [Google Scholar]
- 13.de Senneville BD, Mougenot C, Quesson B, Dragonu I, Grenier N, Moonen CTW. MR thermometry for monitoring tumor ablation. Eur Radiol. 2007 Sep;17(9):2401–10. doi: 10.1007/s00330-007-0646-6. [DOI] [PubMed] [Google Scholar]
- 14.Quesson B, de Zwart JA, Moonen CTW. Magnetic resonance temperature imaging for guidance of thermotherapy. J Magn Reson Imaging. 2000 Oct;12(4):525–33. doi: 10.1002/1522-2586(200010)12:4<525::aid-jmri3>3.0.co;2-v. [DOI] [PubMed] [Google Scholar]
- 15.Kuroda K. Non-invasive MR thermography using the water proton chemical shift. Int J Hyperther. 2005 Sep;21(6):547–60. doi: 10.1080/02656730500204495. [DOI] [PubMed] [Google Scholar]
- 16.Ishihara Y, Calderon A, Watanabe H, Okamoto K, Suzuki Y, Kuroda K. A precise and fast temperature mapping using water proton chemical shift. Magn Reson Med. 1995 Dec;34(6):814–23. doi: 10.1002/mrm.1910340606. [DOI] [PubMed] [Google Scholar]
- 17.De Poorter J, De Wagter C, De Deene Y, Thomsen C, Stahlberg F, Achten E. Noninvasive MRI thermometry with the proton resonance frequency (PRF) method: in vivo results in human muscle. Magn Reson Med. 1995 Jan;33(1):74–81. doi: 10.1002/mrm.1910330111. [DOI] [PubMed] [Google Scholar]
- 18.Corbett RJ, Laptook AR, Tollefsbol G, Kim B. Validation of a noninvasive method to measure brain temperature in vivo using 1H NMR spectroscopy. J Neurochem. 1995 Mar;64(3):1224–30. doi: 10.1046/j.1471-4159.1995.64031224.x. [DOI] [PubMed] [Google Scholar]
- 19.Peters RD, Hinks RS, Henkelman RM. Ex vivo tissue-type independence in proton-resonance frequency shift MR thermometry. Magnet Reson Med. 1998 Sep;40(3):454–9. doi: 10.1002/mrm.1910400316. [DOI] [PubMed] [Google Scholar]
- 20.Baron P, Ries M, Deckers R, de Greef M, Tanttu J, Kohler M, et al. In vivo T2 -based MR thermometry in adipose tissue layers for high-intensity focused ultrasound near-field monitoring. Magn Reson Med. 2014 Oct;72(4):1057–64. doi: 10.1002/mrm.25025. [DOI] [PubMed] [Google Scholar]
- 21.Todd N, Diakite M, Payne A, Parker DL. In vivo evaluation of multi-echo hybrid PRF/T1 approach for temperature monitoring during breast MR-guided focused ultrasound surgery treatments. Magn Reson Med. 2014 Sep;72(3):793–9. doi: 10.1002/mrm.24976. [DOI] [PMC free article] [PubMed] [Google Scholar]
- 22.Rieke V, Instrella R, Rosenberg J, Grissom W, Werner B, Martin E, et al. Comparison of temperature processing methods for monitoring focused ultrasound ablation in the brain. J Magn Reson Imaging. 2013 Dec;38(6):1462–71. doi: 10.1002/jmri.24117. [DOI] [PMC free article] [PubMed] [Google Scholar]
- 23.Rieke V, Vigen KK, Sommer G, Daniel BL, Pauly JM, Butts K. Referenceless PRF shift thermometry. Magn Reson Med. 2004 Jun;51(6):1223–31. doi: 10.1002/mrm.20090. [DOI] [PubMed] [Google Scholar]
- 24.Bradley WG., Jr MR-guided focused ultrasound: a potentially disruptive technology. J Am Coll Radiol. 2009 Jul;6(7):510–3. doi: 10.1016/j.jacr.2009.01.004. [DOI] [PubMed] [Google Scholar]
- 25.Schlesinger D, Benedict S, Diederich C, Gedroyc W, Klibanov A, Larner J. MR-guided focused ultrasound surgery, present and future. Med Phys. 2013 Aug;40(8) doi: 10.1118/1.4811136. [DOI] [PMC free article] [PubMed] [Google Scholar]
- 26.Yin L, Gudur MSR, Hsiao YS, Kumon RE, Deng CX, Jiang HB. Tomographic Reconstruction of Tissue Properties and Temperature Increase for High-Intensity Focused Ultrasound Applications. Ultrasound in Medicine and Biology. 2013 Oct;39(10):1760–70. doi: 10.1016/j.ultrasmedbio.2013.04.009. [DOI] [PMC free article] [PubMed] [Google Scholar]
- 27.Rabkin BA, Zderic V, Vaezy S. Hyperecho in ultrasound images of HIFU therapy: Involvement of cavitation. Ultrasound in Medicine and Biology. 2005 Jul;31(7):947–56. doi: 10.1016/j.ultrasmedbio.2005.03.015. [DOI] [PubMed] [Google Scholar]
- 28.Bamber JC, Hill CR. Ultrasonic attenuation and propagation speed in mammalian tissues as a function of temperature. Ultrasound Med Biol. 1979;5(2):149–57. doi: 10.1016/0301-5629(79)90083-8. [DOI] [PubMed] [Google Scholar]
- 29.Smith MC, Beyer RT. Ultrasonic Absorption in Water in the Temperature Range 0-Degrees-C-80-Degrees-C. J Acoust Soc Am. 1948;20(5):608–10. [Google Scholar]
- 30.Damianou CA, Sanghvi NT, Fry FJ, Maass-Moreno R. Dependence of ultrasonic attenuation and absorption in dog soft tissues on temperature and thermal dose. J Acoust Soc Am. 1997 Jul;102(1):628–34. doi: 10.1121/1.419737. [DOI] [PubMed] [Google Scholar]
- 31.Techavipoo U, Varghese T, Chen Q, Stiles TA, Zagzebski JA, Frank GR. Temperature dependence of ultrasonic propagation speed and attenuation in excised canine liver tissue measured using transmitted and reflected pulses. J Acoust Soc Am. 2004 Jun;115(6):2859–65. doi: 10.1121/1.1738453. [DOI] [PubMed] [Google Scholar]
- 32.Techavipoo U, Varghese T, Zagzebski JA, Stiles T, Frank G. Temperature dependence of ultrasonic propagation speed and attenuation in canine tissue. Ultrason Imaging. 2002 Oct;24(4):246–60. doi: 10.1177/016173460202400404. [DOI] [PubMed] [Google Scholar]
- 33.Lemor RM, Hoss M, Peter L, Weiss EC, Tretbar SH, Cappius HJ, et al. Three dimensional ultrasonic monitoring of interstitial thermal tumor therapies: in vivo results. Ultrasonics; 2003 IEEE Symposium on; 2003 5–8 Oct; 2003. [Google Scholar]
- 34.Bevan PD, Sherar MD. B-scan ultrasound imaging of thermal coagulation in bovine liver: frequency shift attenuation mapping. Ultrasound Med Biol. 2001 Jun;27(6):809–17. doi: 10.1016/s0301-5629(01)00380-5. [DOI] [PubMed] [Google Scholar]
- 35.Bevan PD, Sherar MD. B-scan ultrasound imaging of thermal coagulation in bovine liver: log envelope slope attenuation mapping. Ultrasound Med Biol. 2001 Mar;27(3):379–87. doi: 10.1016/s0301-5629(00)00358-6. [DOI] [PubMed] [Google Scholar]
- 36.Li T, Khokhlova TD, Sapozhnikov OA, O’Donnell M, Hwang JH. A new active cavitation mapping technique for pulsed HIFU applications--bubble Doppler. IEEE Trans Ultrason Ferroelectr Freq Control. 2014 Oct;61(10):1698–708. doi: 10.1109/TUFFC.2014.006502. [DOI] [PMC free article] [PubMed] [Google Scholar]
- 37.Liberman A, Wu Z, Barback CV, Viveros RD, Wang J, Ellies LG, et al. Hollow iron-silica nanoshells for enhanced high intensity focused ultrasound. The Journal of surgical research. 2014 Aug;190(2):391–8. doi: 10.1016/j.jss.2014.05.009. [DOI] [PMC free article] [PubMed] [Google Scholar]
- 38.Andrioli M, Valcavi R. Ultrasound B-flow imaging in the evaluation of thermal ablation of thyroid nodules. Endocrine. 2014 Jun 1; doi: 10.1007/s12020-014-0302-2. [DOI] [PubMed] [Google Scholar]
- 39.Ueno S, Hashimoto M, Fukukita H, Yano T, editors. Ultrasound thermometry in hyperthermia; Ultrasonics Symposium, 1990 Proceedings; 1990 4–7 Dec 1990.IEEE; 1990. [Google Scholar]
- 40.van Dongen KWA, Verweij MD. A feasibility study for non-invasive thermometry using non-linear ultrasound. Int J Hyperther. 2011;27(6):612–24. doi: 10.3109/02656736.2011.599357. [DOI] [PubMed] [Google Scholar]
- 41.Bazan I, Vazquez M, Ramos A, Vera A, Leija L. A performance analysis of echographic ultrasonic techniques for non-invasive temperature estimation in hyperthermia range using phantoms with scatterers. Ultrasonics. 2009 Mar;49(3):358–76. doi: 10.1016/j.ultras.2008.10.012. [DOI] [PubMed] [Google Scholar]
- 42.Shaw A. Prediction of temperature rise in layered media from measured ultrasonic intensity data. Phys Med Biol. 1994 Aug;39(8):1203–18. doi: 10.1088/0031-9155/39/8/002. [DOI] [PubMed] [Google Scholar]
- 43.Chun-Yen L, Kruse DE, Ferrara KW, Caskey CF. Creation and Characterization of an Ultrasound and CT Phantom for Noninvasive Ultrasound Thermometry Calibration. Biomedical Engineering, IEEE Transactions on. 2014;61(2):502–12. doi: 10.1109/TBME.2013.2282775. [DOI] [PMC free article] [PubMed] [Google Scholar]
- 44.Chen D, Fan T, Zhang D, Wu J. A feasibility study of temperature rise measurement in a tissue phantom as an alternative way for characterization of the therapeutic high intensity focused ultrasonic field. Ultrasonics. 2009 Dec;49(8):733–42. doi: 10.1016/j.ultras.2009.05.008. [DOI] [PubMed] [Google Scholar]
- 45.Rabkin BA, Zderic V, Crum LA, Vaezy S. Biological and physical mechanisms of HIFU-induced hyperecho in ultrasound images. Ultrasound in Medicine and Biology. 2006 Nov;32(11):1721–9. doi: 10.1016/j.ultrasmedbio.2006.04.010. [DOI] [PubMed] [Google Scholar]
- 46.Jeong JS, Chang JH, Shung KK. Pulse compression technique for simultaneous HIFU surgery and ultrasonic imaging: a preliminary study. Ultrasonics. 2012 Aug;52(6):730–9. doi: 10.1016/j.ultras.2012.01.016. [DOI] [PMC free article] [PubMed] [Google Scholar]
- 47.Song JH, Yoo Y, Song TK, Chang JH. Real-time monitoring of HIFU treatment using pulse inversion. Physics in Medicine and Biology. 2013 Aug;7(15):58. doi: 10.1088/0031-9155/58/15/5333. [DOI] [PubMed] [Google Scholar]
- 48.Mast TD, Salgaonkar VA, Karunakaran C, Besse JA, Datta S, Holland CK. Acoustic emissions during 3.1 MHz ultrasound bulk ablation in vitro. Ultrasound in Medicine and Biology. 2008 Sep;34(9):1434–48. doi: 10.1016/j.ultrasmedbio.2008.02.007. [DOI] [PMC free article] [PubMed] [Google Scholar]
- 49.Ge HY, Miao LY, Wang JR, Xiong LL, Yan F, Zheng CS, et al. Correlation between Ultrasound Reflection Intensity and Tumor Ablation Ratio of Late-Stage Pancreatic Carcinoma in HIFU Therapy: Dynamic Observation on Ultrasound Reflection Intensity. Sci World J. 2013 doi: 10.1155/2013/852874. [DOI] [PMC free article] [PubMed] [Google Scholar]
- 50.Wu F, Wang ZB, Chen WZ, Zou JZ, Bai J, Zhu H, et al. Extracorporeal focused ultrasound surgery for treatment of human solid carcinomas: early Chinese clinical experience. Ultrasound Med Biol. 2004 Feb;30(2):245–60. doi: 10.1016/j.ultrasmedbio.2003.10.010. [DOI] [PubMed] [Google Scholar]
- 51.Alvarenga AV, Teixeira CA, Ruano MG, Pereira WCA. Influence of temperature variations on the entropy and correlation of the Grey-Level Co-occurrence Matrix from B-Mode images. Ultrasonics. 2010 Feb;50(2):290–3. doi: 10.1016/j.ultras.2009.09.002. [DOI] [PubMed] [Google Scholar]
- 52.Alvarenga AV, Teixeira CA, Ruano MG, Pereira WCA. Evaluation of the influence of large temperature variations on the grey level content of B-Mode images. Physcs Proc. 2010;3(1):415–9. [Google Scholar]
- 53.Teixeira CA, Alvarenga AV, Cortela G, von Kruger MA, Pereira WC. Feasibility of non-invasive temperature estimation by the assessment of the average gray-level content of B-mode images. Ultrasonics. 2014 Aug;54(6):1692–702. doi: 10.1016/j.ultras.2014.02.021. [DOI] [PubMed] [Google Scholar]
- 54.Mohana Shankar P. A general statistical model for ultrasonic backscattering from tissues. IEEE transactions on ultrasonics, ferroelectrics, and frequency control. 2000;47(3):727–36. doi: 10.1109/58.842062. [DOI] [PubMed] [Google Scholar]
- 55.Shankar PM. Ultrasonic tissue characterization using a generalized Nakagami model. Ieee T Ultrason Ferr. 2001 Nov;48(6):1716–20. doi: 10.1109/58.971725. [DOI] [PubMed] [Google Scholar]
- 56.Tsui PH, Hsu CW, Ho MC, Chen YS, Lin JJ, Chang CC, et al. Three-dimensional ultrasonic Nakagami imaging for tissue characterization. Phys Med Biol. 2010 Oct 7;55(19):5849–66. doi: 10.1088/0031-9155/55/19/015. [DOI] [PubMed] [Google Scholar]
- 57.Zhang SY, Zhou FY, Wan MX, Wei M, Fu QY, Wang X, et al. Feasibility of using Nakagami distribution in evaluating the formation of ultrasound-induced thermal lesions. J Acoust Soc Am. 2012 Jun;131(6):4836–44. doi: 10.1121/1.4711005. [DOI] [PubMed] [Google Scholar]
- 58.Zhang S, Li C, Zhou F, Wan M, Wang S. Enhanced lesion-to-bubble ratio on ultrasonic Nakagami imaging for monitoring of high-intensity focused ultrasound. J Ultrasound Med. 2014 Jun;33(6):959–70. doi: 10.7863/ultra.33.6.959. [DOI] [PubMed] [Google Scholar]
- 59.Wang CY, Geng X, Yeh TS, Liu HL, Tsui PH. Monitoring radiofrequency ablation with ultrasound Nakagami imaging. Med Phys. 2013 Jul;40(7):072901. doi: 10.1118/1.4808115. [DOI] [PubMed] [Google Scholar]
- 60.Tsui PH, Shu YC, Chen WS, Liu HL, Hsiao IT, Chien YT. Ultrasound temperature estimation based on probability variation of backscatter data. Med Phys. 2012 May;39(5):2369–85. doi: 10.1118/1.3700235. [DOI] [PubMed] [Google Scholar]
- 61.Rangraz P, Behnam H, Tavakkoli J. Nakagami imaging for detecting thermal lesions induced by high-intensity focused ultrasound in tissue. Proc Inst Mech Eng H. 2014 Jan;228(1):19–26. doi: 10.1177/0954411913511777. [DOI] [PubMed] [Google Scholar]
- 62.Seo CH, Shi Y, Huang SW, Kim K, O’Donnell M. Thermal strain imaging: a review. Interface Focus. 2011 Aug 6;1(4):649–64. doi: 10.1098/rsfs.2011.0010. [DOI] [PMC free article] [PubMed] [Google Scholar]
- 63.Maass-Moreno R, Damianou CA. Noninvasive temperature estimation in tissue via ultrasound echo-shifts. Part I. Analytical model. J Acoust Soc Am. 1996 Oct;100(4 Pt 1):2514–21. doi: 10.1121/1.417359. [DOI] [PubMed] [Google Scholar]
- 64.Simon C, VanBaren P, Ebbini ES. Two-dimensional temperature estimation using diagnostic ultrasound. Ultrasonics, Ferroelectrics, and Frequency Control, IEEE Transactions on. 1998;45(4):1088–99. doi: 10.1109/58.710592. [DOI] [PubMed] [Google Scholar]
- 65.Maass-Moreno R, Damianou CA, Sanghvi NT. Noninvasive temperature estimation in tissue via ultrasound echo-shifts. Part II. In vitro study. J Acoust Soc Am. 1996 Oct;100(4 Pt 1):2522–30. doi: 10.1121/1.417360. [DOI] [PubMed] [Google Scholar]
- 66.Souchon R, Bouchoux G, Maciejko E, Lafon C, Cathignol D, Bertrand M, et al. Monitoring the formation of thermal lesions with heat-induced echo-strain imaging: A feasibility study. Ultrasound in Medicine and Biology. 2005 Feb;31(2):251–9. doi: 10.1016/j.ultrasmedbio.2004.11.004. [DOI] [PubMed] [Google Scholar]
- 67.Seip R, Ebbini ES. Noninvasive estimation of tissue temperature response to heating fields using diagnostic ultrasound. Biomedical Engineering, IEEE Transactions on. 1995;42(8):828–39. doi: 10.1109/10.398644. [DOI] [PubMed] [Google Scholar]
- 68.Ebbini ES, Simon C. Temperature imaging using diagnostic ultrasound: methods for guidance and monitoring of thermal treatments of tissue. P Soc Photo-Opt Ins. 1999;3594:150–8. [Google Scholar]
- 69.Dalong L, Ebbini ES, editors. Real-time two-dimensional temperature imaging using ultrasound; Engineering in Medicine and Biology Society, 2009 EMBC 2009 Annual International Conference of the IEEE; 2009 3–6 Sept; 2009. [DOI] [PubMed] [Google Scholar]
- 70.Dalong L, Ebbini ES. Real-Time 2-D Temperature Imaging Using Ultrasound. Biomedical Engineering, IEEE Transactions on. 2010;57(1):12–6. doi: 10.1109/TBME.2009.2035103. [DOI] [PMC free article] [PubMed] [Google Scholar]
- 71.Casper A, Dalong L, Ebbini ES. Realtime Control of Multiple-focus Phased Array Heating Patterns Based on Noninvasive Ultrasound Thermography. Biomedical Engineering, IEEE Transactions on. 2012;59(1):95–105. doi: 10.1109/TBME.2011.2162105. [DOI] [PMC free article] [PubMed] [Google Scholar]
- 72.Casper AJ, Dalong L, Ballard JR, Ebbini ES. Real-Time Implementation of a Dual-Mode Ultrasound Array System: In Vivo Results. Biomedical Engineering, IEEE Transactions on. 2013;60(10):2751–9. doi: 10.1109/TBME.2013.2264484. [DOI] [PMC free article] [PubMed] [Google Scholar]
- 73.Lai CY, Kruse DE, Caskey CF, Stephens DN, Sutcliffe PL, Ferrara KW. Noninvasive thermometry assisted by a dual-function ultrasound transducer for mild hyperthermia. IEEE Trans Ultrason Ferroelectr Freq Control. 2010 Dec;57(12):2671–84. doi: 10.1109/TUFFC.2010.1741. [DOI] [PMC free article] [PubMed] [Google Scholar]
- 74.Ye G, Smith PP, Noble JA. Model-based ultrasound temperature visualization during and following HIFU exposure. Ultrasound Med Biol. 2010 Feb;36(2):234–49. doi: 10.1016/j.ultrasmedbio.2009.10.001. [DOI] [PubMed] [Google Scholar]
- 75.Abolhassani MD, Norouzy A, Takavar A, Ghanaati H. Noninvasive temperature estimation using sonographic digital images. J Ultras Med. 2007 Feb;26(2):215–22. doi: 10.7863/jum.2007.26.2.215. [DOI] [PubMed] [Google Scholar]
- 76.Mehrabani BM, Tavakoli V, Abolhassani MD, Alirezaie J, Ahmadian A. An Efficient Temperature Estimation Using Optical-Flow in Ultrasound B-Mode Digital Images. Ieee Eng Med Bio. 2008:86–9. doi: 10.1109/IEMBS.2008.4649097. [DOI] [PubMed] [Google Scholar]
- 77.Abolhassani MD, Tavakoli V, Sahba N. Optimized noninvasive monitoring of thermal changes on digital B-mode renal sonography during revascularization therapy. J Ultrasound Med. 2009 Nov;28(11):1535–47. doi: 10.7863/jum.2009.28.11.1535. [DOI] [PubMed] [Google Scholar]
- 78.Chenot J, Melodelima D, N’Djin WA, Souchon R, Rivoire M, Chapelon JY. Intra-operative ultrasound hand-held strain imaging for the visualization of ablations produced in the liver with a toroidal HIFU transducer: first in vivo results. Physics in Medicine and Biology. 2010 Jun 7;55(11):3131–44. doi: 10.1088/0031-9155/55/11/010. [DOI] [PMC free article] [PubMed] [Google Scholar]
- 79.Miller NR, Bamber JC, Meaney PM. Fundamental limitations of noninvasive temperature imaging by means of ultrasound echo strain estimation. Ultrasound in Medicine and Biology. 2002 Oct;28(10):1319–33. doi: 10.1016/s0301-5629(02)00608-7. [DOI] [PubMed] [Google Scholar]
- 80.Miller NR, Bograchev KM, Bamber JC. Ultrasonic temperature imaging for guiding focused ultrasound surgery: Effect of angle between imaging beam and therapy beam. Ultrasound in Medicine and Biology. 2005 Mar;31(3):401–13. doi: 10.1016/j.ultrasmedbio.2004.11.014. [DOI] [PubMed] [Google Scholar]
- 81.Civale J, Rivens I, Ter Haar G, Morris H, Coussios C, Friend P, et al. Calibration of ultrasound backscatter temperature imaging for high-intensity focused ultrasound treatment planning. Ultrasound Med Biol. 2013 Sep;39(9):1596–612. doi: 10.1016/j.ultrasmedbio.2013.04.001. [DOI] [PubMed] [Google Scholar]
- 82.Varghese T, Zagzebski JA, Chen Q, Techavipoo U, Frank G, Johnson C, et al. Ultrasound monitoring of temperature change during radiofrequency ablation: Preliminary in-vivo results. Ultrasound in Medicine and Biology. 2002 Mar;28(3):321–9. doi: 10.1016/s0301-5629(01)00519-1. [DOI] [PubMed] [Google Scholar]
- 83.Daniels MJ, Varghese T, Madsen EL, Zagzebski JA. Non-invasive ultrasound-based temperature imaging for monitoring radiofrequency heating - phantom results. Physics in Medicine and Biology. 2007 Aug 21;52(16):4827–43. doi: 10.1088/0031-9155/52/16/008. [DOI] [PubMed] [Google Scholar]
- 84.Miller NR, Bamber JC, ter Haar GR. Imaging of temperature-induced echo strain: Preliminary in vitro study to assess feasibility for guiding focused ultrasound surgery. Ultrasound in Medicine and Biology. 2004 Mar;30(3):345–56. doi: 10.1016/j.ultrasmedbio.2003.11.016. [DOI] [PubMed] [Google Scholar]
- 85.Anand A, Savery D, Hall C. Three-dimensional spatial and temporal temperature imaging in gel phantoms using backscattered ultrasound. Ultrasonics, Ferroelectrics, and Frequency Control, IEEE Transactions on. 2007;54(1):23–31. doi: 10.1109/tuffc.2007.208. [DOI] [PubMed] [Google Scholar]
- 86.Huang SW, Kim K, Witte RS, Olafsson R, O’Donnell M. Inducing and Imaging thermal strain using a single ultrasound linear array. Ieee T Ultrason Ferr. 2007 Sep;54(9):1718–20. doi: 10.1109/tuffc.2007.454. [DOI] [PubMed] [Google Scholar]
- 87.Mahmoud AM, Ding X, Dutta D, Singh VP, Kim K. Detecting hepatic steatosis using ultrasound-induced thermal strain imaging: an ex vivo animal study. Physics in Medicine and Biology. 2014 Feb 21;59(4):881–95. doi: 10.1088/0031-9155/59/4/881. [DOI] [PMC free article] [PubMed] [Google Scholar]
- 88.Pouch AM, Cary TW, Schultz SM, Sehgal CM. In vivo noninvasive temperature measurement by B-mode ultrasound imaging. J Ultrasound Med. 2010 Nov;29(11):1595–606. doi: 10.7863/jum.2010.29.11.1595. [DOI] [PubMed] [Google Scholar]
- 89.Daoud MI, Mousavi P, Imani F, Rohling R, Abolmaesumi P. Tissue Classification Using Ultrasound-Induced Variations in Acoustic Backscattering Features. Biomedical Engineering, IEEE Transactions on. 2013;60(2):310–20. doi: 10.1109/TBME.2012.2224111. [DOI] [PubMed] [Google Scholar]
- 90.Liu HL, Huang SM, Li ML. High frame rate ultrasound monitoring of high intensity focused ultrasound-induced temperature changes: a novel asynchronous approach. Med Phys. 2010 Nov;37(11):5921–8. doi: 10.1118/1.3488902. [DOI] [PubMed] [Google Scholar]
- 91.Liu HL, Li ML, Tsui PH, Lin MS, Huang SM, Bai J. A unified approach to combine temperature estimation and elastography for thermal lesion determination in focused ultrasound thermal therapy. Physics in Medicine and Biology. 2011 Jan 7;56(1):169–86. doi: 10.1088/0031-9155/56/1/011. [DOI] [PubMed] [Google Scholar]
- 92.Amini AN, Ebbini ES, Georgiou TT. Noninvasive estimation of tissue temperature via high-resolution spectral analysis techniques. Biomedical Engineering, IEEE Transactions on. 2005;52(2):221–8. doi: 10.1109/TBME.2004.840189. [DOI] [PubMed] [Google Scholar]
- 93.Amini AN, Ebbini ES, Georgiou TT, editors. Noninvasive tissue temperature estimation via state-covariance spectral estimation; Digital Signal Processing Workshop, 2004 and the 3rd IEEE Signal Processing Education Workshop 2004 IEEE 11th; 2004 1–4 Aug; 2004. [Google Scholar]
- 94.Liu HL, Li ML, Shih TC, Huang SM, Lu IY, Lin DY, et al. Instantaneous frequency-based ultrasonic temperature estimation during focused ultrasound thermal therapy. Ultrasound Med Biol. 2009 Oct;35(10):1647–61. doi: 10.1016/j.ultrasmedbio.2009.05.004. [DOI] [PubMed] [Google Scholar]
- 95.Ju KC, Liu HL. Zero-Crossing Tracking Technique for Noninvasive Ultrasonic Temperature Estimation. J Ultras Med. 2010 Nov;29(11):1607–15. doi: 10.7863/jum.2010.29.11.1607. [DOI] [PubMed] [Google Scholar]
- 96.Huang CW, Lien DH, Chen BT, Shieh J, Tsui PH, Chen CS, et al. Ultrasound thermal mapping based on a hybrid method combining cross-correlation and zero-crossing tracking. J Acoust Soc Am. 2013 Aug;134(2):1530–40. doi: 10.1121/1.4812874. [DOI] [PubMed] [Google Scholar]
- 97.Xia R, Thittai AK. Real-time monitoring of high-intensity focused ultrasound treatment using axial strain and axial-shear strain elastograms. Ultrasound Med Biol. 2014 Mar;40(3):485–95. doi: 10.1016/j.ultrasmedbio.2013.10.006. [DOI] [PubMed] [Google Scholar]
- 98.Teixeira CA, Ruano MG, Ruano AE, Pereira WC. Neuro-genetic non-invasive temperature estimation: intensity and spatial prediction. Artif Intell Med. 2008 Jun;43(2):127–39. doi: 10.1016/j.artmed.2008.03.008. [DOI] [PubMed] [Google Scholar]
- 99.Teixeira CA, Ruano MG, Ruano AE, Pereira WCA. A Soft-Computing Methodology for Noninvasive Time-Spatial Temperature Estimation. Biomedical Engineering, IEEE Transactions on. 2008;55(2):572–80. doi: 10.1109/TBME.2007.901029. [DOI] [PubMed] [Google Scholar]
- 100.Teixeira CA, Pereira WC, Ruano AE, Ruano MG. On the possibility of non-invasive multilayer temperature estimation using soft-computing methods. Ultrasonics. 2010 Jan;50(1):32–43. doi: 10.1016/j.ultras.2009.07.005. [DOI] [PubMed] [Google Scholar]
- 101.Anand A, Byrd L, Kaczkowski PJ, editors. In situ thermal parameter estimation for HIFU therapy planning and treatment monitoring; Ultrasonics Symposium, 2004 IEEE; 2004 23–27 Aug; 2004. [Google Scholar]
- 102.Srinivasan S, Righetti R, Ophir J. Trade-offs between the axial resolution and the signal-to-noise ratio in elastography. Ultrasound Med Biol. 2003 Jun;29(6):847–66. doi: 10.1016/s0301-5629(03)00037-1. [DOI] [PubMed] [Google Scholar]
- 103.Shah J, Aglyamov SR, Sokolov K, Milner TE, Emelianov SY. Ultrasound imaging to monitor photothermal therapy - Feasibility study. Opt Express. 2008 Mar 17;16(6):3776–85. doi: 10.1364/oe.16.003776. [DOI] [PubMed] [Google Scholar]
- 104.Sapin-de Brosses E, Gennisson JL, Pernot M, Fink M, Tanter M. Temperature dependence of the shear modulus of soft tissues assessed by ultrasound. Phys Med Biol. 2010 Mar 21;55(6):1701–18. doi: 10.1088/0031-9155/55/6/011. [DOI] [PubMed] [Google Scholar]
- 105.Sapin-de Brosses E, Pernot M, Tanter M. The link between tissue elasticity and thermal dose in vivo. Physics in Medicine and Biology. 2011 Dec 21;56(24):7755–65. doi: 10.1088/0031-9155/56/24/005. [DOI] [PubMed] [Google Scholar]
- 106.Kiss MZ, Daniels MJ, Varghese T. Investigation of temperature-dependent viscoelastic properties of thermal lesions in ex vivo animal liver tissue. J Biomech. 2009 May 29;42(8):959–66. doi: 10.1016/j.jbiomech.2009.03.002. [DOI] [PMC free article] [PubMed] [Google Scholar]
- 107.Shahmirzadi D, Hou GY, Chen J, Konofagou EE. Ex Vivo characterization of canine liver tissue viscoelasticity after high-intensity focused ultrasound ablation. Ultrasound Med Biol. 2014 Feb;40(2):341–50. doi: 10.1016/j.ultrasmedbio.2013.09.016. [DOI] [PMC free article] [PubMed] [Google Scholar]
- 108.Righetti R, Kallel F, Stafford RJ, Price RE, Krouskop TA, Hazle JD, et al. Elastographic characterization of HIFU-induced lesions in canine livers. Ultrasound in Medicine and Biology. 1999 Sep;25(7):1099–113. doi: 10.1016/s0301-5629(99)00044-7. [DOI] [PubMed] [Google Scholar]
- 109.Kallel F, Stafford RJ, Price RE, Righetti R, Ophir J, Hazle JD. The feasibility of elastographic visualization of HIFU-induced thermal lesions in soft tissues. Ultrasound in Medicine and Biology. 1999 May;25(4):641–7. doi: 10.1016/s0301-5629(98)00184-7. [DOI] [PubMed] [Google Scholar]
- 110.Stafford RJ, Kallel F, Price RE, Cromeens DM, Krouskop TA, Hazle JD, et al. Elastographic imaging of thermal lesions in soft tissue: A preliminary study in vitro. Ultrasound in Medicine and Biology. 1998 Nov;24(9):1449–58. doi: 10.1016/s0301-5629(98)00099-4. [DOI] [PubMed] [Google Scholar]
- 111.Sumi C, Ichiki Y, Kanai H, editors. Monitoring of the effectiveness of the interstitial RF electromagnetic wave thermal therapy by shear modulus reconstruction; Ultrasonics Symposium, 2000 IEEE; Oct 2000.2000. [Google Scholar]
- 112.Bharat S, Techavipoo U, Kiss MZ, Liu W, Varghese T. Monitoring stiffness changes in lesions after radiofrequency ablation at different temperatures and durations of ablation. Ultrasound in Medicine and Biology. 2005 Mar;31(3):415–22. doi: 10.1016/j.ultrasmedbio.2004.12.020. [DOI] [PubMed] [Google Scholar]
- 113.Gennisson JL, Deffieux T, Fink M, Tanter M. Ultrasound elastography: principles and techniques. Diagn Interv Imaging. 2013 May;94(5):487–95. doi: 10.1016/j.diii.2013.01.022. [DOI] [PubMed] [Google Scholar]
- 114.Glaser KJ, Manduca A, Ehman RL. Review of MR elastography applications and recent developments. J Magn Reson Imaging. 2012 Oct;36(4):757–74. doi: 10.1002/jmri.23597. [DOI] [PMC free article] [PubMed] [Google Scholar]
- 115.Bercoff J, Tanter M, Fink M. Supersonic shear imaging: a new technique for soft tissue elasticity mapping. IEEE transactions on ultrasonics, ferroelectrics, and frequency control. 2004 Apr;51(4):396–409. doi: 10.1109/tuffc.2004.1295425. [DOI] [PubMed] [Google Scholar]
- 116.Bercoff J, Pernot M, Tanter M, Fink M. Monitoring thermally-induced lesions with supersonic shear imaging. Ultrason Imaging. 2004 Apr;26(2):71–84. doi: 10.1177/016173460402600201. [DOI] [PubMed] [Google Scholar]
- 117.Mariani A, Kwiecinski W, Pernot M, Balvay D, Tanter M, Clement O, et al. Real time shear waves elastography monitoring of thermal ablation: in vivo evaluation in pig livers. Journal of Surgical Research. 2014 May;188(1):37–43. doi: 10.1016/j.jss.2013.12.024. [DOI] [PubMed] [Google Scholar]
- 118.Arnal B, Pernot M, Tanter M. Monitoring of thermal therapy based on shear modulus changes: I. shear wave thermometry. IEEE Trans Ultrason Ferroelectr Freq Control. 2011 Feb;58(2):369–78. doi: 10.1109/TUFFC.2011.1814. [DOI] [PubMed] [Google Scholar]
- 119.Benech N, Negreira CA. Monitoring heat-induced changes in soft tissues with 1D transient elastography. Phys Med Biol. 2010 Mar 21;55(6):1753–65. doi: 10.1088/0031-9155/55/6/014. [DOI] [PubMed] [Google Scholar]
- 120.Benech N, Negreira C, Catheline S, editors. Monitoring local temperature changes in soft tissues by time-reversal elastography; Ultrasonics Symposium (IUS), 2009 IEEE International; 2009 20–23 Sept; 2009. [Google Scholar]
- 121.Walker WF, Trahey GE. A Fundamental Limit on Delay Estimation Using Partially Correlated Speckle Signals. Ieee T Ultrason Ferr. 1995 Mar;42(2):301–8. [Google Scholar]
- 122.Konofagou EE, Hynynen K. Localized harmonic motion imaging: theory, simulations and experiments. Ultrasound Med Biol. 2003 Oct;29(10):1405–13. doi: 10.1016/s0301-5629(03)00953-0. [DOI] [PubMed] [Google Scholar]
- 123.Curiel L, Huang Y, Vykhodtseva N, Hynynen K. Focused ultrasound treatment of VX2 tumors controlled by local harmonic motion. Phys Med Biol. 2009 Jun 7;54(11):3405–19. doi: 10.1088/0031-9155/54/11/009. [DOI] [PubMed] [Google Scholar]
- 124.Curiel L, Chopra R, Hynynen K. In Vivo Monitoring of Focused Ultrasound Surgery Using Local Harmonic Motion. Ultrasound in Medicine and Biology. 2009 Jan;35(1):65–78. doi: 10.1016/j.ultrasmedbio.2008.07.001. [DOI] [PMC free article] [PubMed] [Google Scholar]
- 125.Curiel L, Hynynen K. Localized harmonic motion imaging for focused ultrasound surgery targeting. Ultrasound Med Biol. 2011 Aug;37(8):1230–9. doi: 10.1016/j.ultrasmedbio.2011.05.013. [DOI] [PMC free article] [PubMed] [Google Scholar]
- 126.Maleke C, Konofagou EE. An all-ultrasound-based system for real-time monitoring and sonication of temperature change and ablation. Conf Proc IEEE Eng Med Biol Soc. 2006;1:164–7. doi: 10.1109/IEMBS.2006.260845. [DOI] [PubMed] [Google Scholar]
- 127.Maleke C, Konofagou EE. Harmonic motion imaging for focused ultrasound (HMIFU): a fully integrated technique for sonication and monitoring of thermal ablation in tissues. Phys Med Biol. 2008 Mar 21;53(6):1773–93. doi: 10.1088/0031-9155/53/6/018. [DOI] [PubMed] [Google Scholar]
- 128.Maleke C, Konofagou EE. In vivo feasibility of real-time monitoring of focused ultrasound surgery (FUS) using harmonic motion imaging (HMI) IEEE Trans Biomed Eng. 2010 Jan;57(1):7–11. doi: 10.1109/TBME.2009.2027423. [DOI] [PubMed] [Google Scholar]
- 129.Hou G, Provost J, Grondin J, Wang S, Marquet F, Bunting E, et al. Sparse matrix beamforming and image reconstruction for real-time 2D HIFU monitoring using Harmonic Motion Imaging for Focused Ultrasound (HMIFU) with in vitro validation. Medical Imaging, IEEE Transactions on. 2014;(99):1. doi: 10.1109/TMI.2014.2332184. [DOI] [PMC free article] [PubMed] [Google Scholar]
- 130.Konofagou EE, Maleke C, Vappou J. Harmonic Motion Imaging (HMI) for Tumor Imaging and Treatment Monitoring. Curr Med Imaging Rev. 2012;8(1):16–26. doi: 10.2174/157340512799220616. [DOI] [PMC free article] [PubMed] [Google Scholar]
- 131.Fatemi M, Greenleaf JF. Vibro-acoustography: an imaging modality based on ultrasound-stimulated acoustic emission. Proc Natl Acad Sci U S A. 1999 Jun 8;96(12):6603–8. doi: 10.1073/pnas.96.12.6603. [DOI] [PMC free article] [PubMed] [Google Scholar]
- 132.Konofagou E, Thierman J, Hynynen K. A focused ultrasound method for simultaneous diagnostic and therapeutic applications - a simulation study. Physics in Medicine and Biology. 2001 Nov;46(11):2967–84. doi: 10.1088/0031-9155/46/11/314. [DOI] [PubMed] [Google Scholar]
- 133.Konofagou EE, Thierman J, Karjalainen T, Hynynen K. The temperature dependence of ultrasound-stimulated acoustic emission. Ultrasound in Medicine and Biology. 2002 Mar;28(3):331–8. doi: 10.1016/s0301-5629(01)00525-7. [DOI] [PubMed] [Google Scholar]
- 134.Straube WL, Arthur RM. Theoretical estimation of the temperature dependence of backscattered ultrasonic power for noninvasive thermometry. Ultrasound Med Biol. 1994;20(9):915–22. doi: 10.1016/0301-5629(94)90051-5. [DOI] [PubMed] [Google Scholar]
- 135.Trobaugh JW, Arthur RM, Straube WL, Moros EG. A simulation model for ultrasonic temperature imaging using change in backscattered energy. Ultrasound in Medicine and Biology. 2008 Feb;34(2):289–98. doi: 10.1016/j.ultrasmedbio.2007.07.015. [DOI] [PMC free article] [PubMed] [Google Scholar]
- 136.Arthur RM, Straube WL, Starman JD, Moros EG. Noninvasive temperature estimation based on the energy of backscattered ultrasound. Med Phys. 2003 Jun;30(6):1021–9. doi: 10.1118/1.1570373. [DOI] [PubMed] [Google Scholar]
- 137.Arthur RM, Trobaugh JW, Straube WL, Moros EG. Temperature dependence of ultrasonic backscattered energy in motion-compensated images. IEEE Trans Ultrason Ferroelectr Freq Control. 2005 Oct;52(10):1644–52. doi: 10.1109/tuffc.2005.1561620. [DOI] [PubMed] [Google Scholar]
- 138.Arthur RM, Basu D, Yuzheng G, Trobaugh JW, Moros EG. 3-D in vitro estimation of temperature using the change in backscattered ultrasonic energy. Ultrasonics, Ferroelectrics, and Frequency Control, IEEE Transactions on. 2010;57(8):1724–33. doi: 10.1109/TUFFC.2010.1611. [DOI] [PubMed] [Google Scholar]
- 139.Arthur RM, Straube WL, Trobaugh JW, Moros EG. In vivo change in ultrasonic backscattered energy with temperature in motion-compensated images. Int J Hyperther. 2008;24(5):389–98. doi: 10.1080/02656730801942199. [DOI] [PubMed] [Google Scholar]
- 140.Li X, Ghoshal G, Lavarello RJ, Oelze ML. Exploring potential mechanisms responsible for observed changes of ultrasonic backscattered energy with temperature variations. Med Phys. 2014 May;41(5):052901. doi: 10.1118/1.4870964. [DOI] [PMC free article] [PubMed] [Google Scholar]
- 141.Tsui PH, Chien YT, Liu HL, Shu YC, Chen WS. Using ultrasound CBE imaging without echo shift compensation for temperature estimation. Ultrasonics. 2012 Sep;52(7):925–35. doi: 10.1016/j.ultras.2012.03.001. [DOI] [PubMed] [Google Scholar]
- 142.Seo J, Kim S, Kim Y, Bang W, Choi K, Kong D. Motion Compensation for Ultrasound Thermal Imaging using Motion-mapped Reference Model: An in vivo Mouse Study. Biomedical Engineering, IEEE Transactions on. 2014;(99):1. doi: 10.1109/TBME.2014.2325070. [DOI] [PubMed] [Google Scholar]
- 143.Ghoshal G, Luchies AC, Blue JP, Oelze ML. Temperature dependent ultrasonic characterization of biological media. J Acoust Soc Am. 2011 Oct;130(4):2203–11. doi: 10.1121/1.3626162. [DOI] [PMC free article] [PubMed] [Google Scholar]
- 144.Ghoshal G, Kemmerer JP, Karunakaran C, Abuhabsah R, Miller RJ, Sarwate S, et al. Quantitative ultrasound imaging for monitoring in situ high-intensity focused ultrasound exposure. Ultrason Imaging. 2014 Oct;36(4):239–55. doi: 10.1177/0161734614524179. [DOI] [PMC free article] [PubMed] [Google Scholar]
- 145.Sadeghi-Naini A, Papanicolau N, Falou O, Tadayyon H, Lee J, Zubovits J, et al. Low-frequency quantitative ultrasound imaging of cell death in vivo. Med Phys. 2013 Aug;40(8):082901. doi: 10.1118/1.4812683. [DOI] [PubMed] [Google Scholar]
- 146.Subramanian S, Rudich SM, Alqadah A, Karunakaran CP, Rao MB, Mast TD. In Vivo Thermal Ablation Monitoring Using Ultrasound Echo Decorrelation Imaging. Ultrasound in Medicine and Biology. 2014 Jan;40(1):102–14. doi: 10.1016/j.ultrasmedbio.2013.09.007. [DOI] [PMC free article] [PubMed] [Google Scholar]
- 147.Mast TD, Pucke DP, Subramanian SE, Bowlus WJ, Rudich SM, Buell JF. Ultrasound monitoring of in vitro radio frequency ablation by echo decorrelation imaging. J Ultrasound Med. 2008 Dec;27(12):1685–97. doi: 10.7863/jum.2008.27.12.1685. [DOI] [PubMed] [Google Scholar]
- 148.Sachs TD, Janney CD. A two-beam acoustic system for tissue analysis. Phys Med Biol. 1977 Mar;22(2):327–40. doi: 10.1088/0031-9155/22/2/012. [DOI] [PubMed] [Google Scholar]
- 149.Clement GT, Hynynen K. Ultrasound phase-contrast transmission imaging of localized thermal variation and the identification of fat/tissue boundaries. Phys Med Biol. 2005 Apr 7;50(7):1585–600. doi: 10.1088/0031-9155/50/7/018. [DOI] [PubMed] [Google Scholar]
- 150.Farny CH, Clement GT. Ultrasound Phase Contrast Thermal Imaging with Reflex Transmission Imaging Methods in Tissue Phantoms. Ultrasound in Medicine and Biology. 2009 Dec;35(12):1995–2006. doi: 10.1016/j.ultrasmedbio.2009.05.019. [DOI] [PMC free article] [PubMed] [Google Scholar]
- 151.Malyarenko EV, Heyman JS, Chen-Mayer HH, Tosh RE. High-resolution ultrasonic thermometer for radiation dosimetry. J Acoust Soc Am. 2008 Dec;124(6):3481–90. doi: 10.1121/1.2997431. [DOI] [PubMed] [Google Scholar]
- 152.Le Floch C, Tanter M, Fink M. Self-defocusing in ultrasonic hyperthermia: Experiment and simulation. Appl Phys Lett. 1999 May 17;74(20):3062–4. [Google Scholar]
- 153.Pernot M, Tanter M, Bercoff J, Waters KR, Fink M. Temperature estimation using ultrasonic spatial compound imaging. Ieee T Ultrason Ferr. 2004 May;51(5):606–15. [PubMed] [Google Scholar]
- 154.Norton SJ, Testardi LR, Wadley HNG. Reconstructing Internal Temperature Distributions from Ultrasonic Time-of-Flight Tomography and Dimensional Resonance Measurements. J Res Nat Bur Stand. 1984;89(1):65–74. doi: 10.6028/jres.089.007. [DOI] [PMC free article] [PubMed] [Google Scholar]
- 155.Norton SJ, Wadley HNG. Tomographic Reconstruction of Internal Temperature. In: Thompson D, Chimenti D, editors. Review of Progress in Quantitative Nondestructive Evaluation. Springer; US: 1985. pp. 309–18. [Google Scholar]
- 156.Wadley HNG, Norton SJ, Mauer F, Droney B. Ultrasonic Measurement of Internal Temperature Distribution. Philos T R Soc A. 1986 Nov 26;320(1554):341–61. [Google Scholar]
- 157.Basarab-Horwath I, Dorozhevets MM, editors. Measurement of the temperature distribution in fluids using ultrasonic tomography; Ultrasonics Symposium, 1994 Proceedings, 1994 IEEE; Oct. 31 1994–Nov. 3 1994.1994. [Google Scholar]
- 158.Duric N, Boyd N, Littrup P, Sak M, Myc L, Li CP, et al. Breast density measurements with ultrasound tomography: A comparison with film and digital mammography. Med Phys. 2013 Jan;40(1) doi: 10.1118/1.4772057. [DOI] [PMC free article] [PubMed] [Google Scholar]
- 159.Duric N, Littrup P, Li CP, Roy O, Schmidt S, Cheng XY, et al. Breast Imaging with SoftVue: Initial clinical evaluation. Medical Imaging 2014: Ultrasonic Imaging and Tomography. 2014:9040. [Google Scholar]
- 160.Andre M, Wiskin J, Borup D, Johnson S, Ojeda-Fournier H, Olson L. Quantitative Volumetric Breast Imaging with 3D Inverse Scatter Computed Tomography. Ieee Eng Med Bio. 2012:1110–3. doi: 10.1109/EMBC.2012.6346129. [DOI] [PubMed] [Google Scholar]
- 161.Wiskin J, Borup D, Andre M, Johnson S, Greenleaf J, Parisky Y, et al. Three-dimensional nonlinear inverse scattering: Quantitative transmission algorithms, refraction corrected reflection, scanner design, and clinical results. The Journal of the Acoustical Society of America. 2013;133(5):3229. [Google Scholar]
- 162.Wiskin J, Borup D, Johnson S, Berggren M, Robinson D, Smith J, et al. Inverse scattering and refraction corrected reflection for breast cancer imaging. P Soc Photo-Opt Ins. 2010:7629. [Google Scholar]
- 163.Wiskin J, Borup DT, Johnson SA, Berggren M. Non-linear inverse scattering: High resolution quantitative breast tissue tomography. J Acoust Soc Am. 2012 May;131(5):3802–13. doi: 10.1121/1.3699240. [DOI] [PMC free article] [PubMed] [Google Scholar]
- 164.Nebeker J, Nelson TR. Imaging of Sound Speed Using Reflection Ultrasound Tomography. J Ultras Med. 2012 Sep;31(9):1389–404. doi: 10.7863/jum.2012.31.9.1389. [DOI] [PubMed] [Google Scholar]
- 165.Natterer F. Ultrasound mammography with a mirror. Physics in Medicine and Biology. 2010 May 21;55(10):N275–N9. doi: 10.1088/0031-9155/55/10/N02. [DOI] [PubMed] [Google Scholar]
- 166.Natterer F. Reflectors in wave equation imaging. Wave Motion. 2008 Jun;45(6):776–84. [Google Scholar]
- 167.Zhu N, Jiang Y, Kato S. Ultrasonic computerized tomography (CT) for temperature measurements with limited projection data based on extrapolated filtered back projection (FBP) method. Energy. 2005 Feb-Mar;30(2–4):509–22. [Google Scholar]
- 168.Hua SY, Ding MY, Ming YC. Sparse-View Ultrasound Diffraction Tomography Using Compressed Sensing with Nonuniform FFT. Comput Math Method M. 2014 doi: 10.1155/2014/329350. [DOI] [PMC free article] [PubMed] [Google Scholar]
- 169.Salgaonkar VA, Datta S, Holland CK, Mast TD. Passive cavitation imaging with ultrasound arrays. The Journal of the Acoustical Society of America. 2009;126(6):3071–83. doi: 10.1121/1.3238260. [DOI] [PMC free article] [PubMed] [Google Scholar]
- 170.Haworth KJ, Mast TD, Radhakrishnan K, Burgess MT, Kopechek JA, Huang SL, et al. Passive imaging with pulsed ultrasound insonations. J Acoust Soc Am. 2012 Jul;132(1):544–53. doi: 10.1121/1.4728230. [DOI] [PMC free article] [PubMed] [Google Scholar]
- 171.Gyongy M, Coussios CC. Passive Spatial Mapping of Inertial Cavitation During HIFU Exposure. Ieee T Bio-Med Eng. 2010 Jan;57(1):48–56. doi: 10.1109/TBME.2009.2026907. [DOI] [PubMed] [Google Scholar]
- 172.Gyongy M, Coussios CC. Passive cavitation mapping for localization and tracking of bubble dynamics. J Acoust Soc Am. 2010 Oct;128(4):E175–E80. doi: 10.1121/1.3467491. [DOI] [PubMed] [Google Scholar]
- 173.Jensen CR, Ritchie RW, Gyongy M, Collin JRT, Leslie T, Coussios CC. Spatiotemporal Monitoring of High-Intensity Focused Ultrasound Therapy with Passive Acoustic Mapping. Radiology. 2012 Jan;262(1):252–61. doi: 10.1148/radiol.11110670. [DOI] [PubMed] [Google Scholar]
- 174.Gyongy M, Coviello CM. Passive cavitation mapping with temporal sparsity constraint. J Acoust Soc Am. 2011 Nov;130(5):3489–97. doi: 10.1121/1.3626138. [DOI] [PubMed] [Google Scholar]
- 175.Coviello CM, Faragher SR, Coussios CC. Robust Capon beamforming for passive cavitation mapping during high-intensity focused ultrasound therapy. The Journal of the Acoustical Society of America. 2010;128(4):2280. doi: 10.1121/1.3467491. [DOI] [PubMed] [Google Scholar]
- 176.Coviello C, Choi J, Collin J, Carlisle R, Gyongy M, Coussios CC. Passive acoustic mapping of stable and inertial cavitation during ultrasound therapy. The Journal of the Acoustical Society of America. 2014;136(4):2300. [Google Scholar]
- 177.Coviello C, Kozick RJ, Choi JJ, Gyöngy M, Collin J, Jensen C, et al. Passive acoustic mapping using optimal beamforming for real-time monitoring of ultrasound therapy. Proceedings of Meetings on Acoustics. 2013;19(1) [Google Scholar]
- 178.Collin J, Coviello C, Lyka E, Leslie T, Coussios CC. Real-time three-dimensional passive cavitation detection for clinical high intensity focussed ultrasound systems. Proceedings of Meetings on Acoustics. 2013;19(1) [Google Scholar]
- 179.Anand A, Kaczkowski PJ. Noninvasive Determination of in Situ Heating Rate Using Khz Acoustic Emissions and Focused Ultrasound. Ultrasound in Medicine and Biology. 2009 Oct;35(10):1662–71. doi: 10.1016/j.ultrasmedbio.2009.05.015. [DOI] [PMC free article] [PubMed] [Google Scholar]
- 180.Jensen CR, Cleveland RO, Coussios CC. Real-time temperature estimation and monitoring of HIFU ablation through a combined modeling and passive acoustic mapping approach. Phys Med Biol. 2013 Sep 7;58(17):5833–50. doi: 10.1088/0031-9155/58/17/5833. [DOI] [PubMed] [Google Scholar]
- 181.Arvanitis CD, McDannold N. Integrated ultrasound and magnetic resonance imaging for simultaneous temperature and cavitation monitoring during focused ultrasound therapies. Med Phys. 2013 Nov;40(11) doi: 10.1118/1.4823793. [DOI] [PMC free article] [PubMed] [Google Scholar]
- 182.Faragher S, Gyöngy M, Hodnett M, Shaw A, Coussios CC. Development of a tomographic cavitation sensor for quality assessment of clinical high intensity focused ultrasound systems. The Journal of the Acoustical Society of America. 2009;125(4):2742. [Google Scholar]
- 183.Jones RM, O’Reilly MA, Hynynen K. Passive mapping of acoustic sources within the human skull cavity with a hemispherical sparse array using computed tomography-based aberration corrections. The Journal of the Acoustical Society of America. 2014;135(4):2208–9. [Google Scholar]
- 184.O’Reilly MA, Rahman S, Hynynen K. Cavitation monitoring and passive beamforming using a hemispherical random sparse array. AIP Conference Proceedings. 2012;1481(1):271–5. [Google Scholar]
- 185.Jones R, O’Reilly M, Hynynen K. Simulations of transcranial passive acoustic mapping with hemispherical sparse arrays using computed tomography-based aberration corrections. Proceedings of Meetings on Acoustics. 2013;19(1) doi: 10.1088/0031-9155/58/14/4981. [DOI] [PMC free article] [PubMed] [Google Scholar]
- 186.Pearce JA, Valvano JW, Emelianov S. Temperature Measurements. In: Welch AJ, van Gemert MJC, editors. Optical-Thermal Response of Laser-Irradiated Tissue. Springer; 2011. pp. 399–453. [Google Scholar]
- 187.Shah J, Park S, Aglyamov S, Larson T, Ma L, Sokolov K, et al. Photoacoustic imaging and temperature measurement for photothermal cancer therapy. Journal of Biomedical Optics. 2008 May-Jun;13(3) doi: 10.1117/1.294036. [DOI] [PMC free article] [PubMed] [Google Scholar]
- 188.Pramanik M, Wang LV. Thermoacoustic and photoacoustic sensing of temperature. J Biomed Opt. 2009 Sep-Oct;14(5):054024. doi: 10.1117/1.3247155. [DOI] [PMC free article] [PubMed] [Google Scholar]
- 189.Ke H, Tai S, Wang LV. Photoacoustic thermography of tissue. J Biomed Opt. 2014 Feb;19(2):026003. doi: 10.1117/1.JBO.19.2.026003. [DOI] [PMC free article] [PubMed] [Google Scholar]
- 190.Daoudi K, van Es P, Manohar S, Steenbergen W. Two-dimensional spatiotemporal monitoring of temperature in photothermal therapy using hybrid photoacoustic-ultrasound transmission tomography. J Biomed Opt. 2013 Nov;18(11):116009. doi: 10.1117/1.JBO.18.11.116009. [DOI] [PubMed] [Google Scholar]
- 191.Chitnis PV, Brecht HP, Su R, Oraevsky AA. Feasibility of optoacoustic visualization of high-intensity focused ultrasound-induced thermal lesions in live tissue. Journal of Biomedical Optics. 2010 Mar-Apr;15(2) doi: 10.1117/1.3339977. [DOI] [PMC free article] [PubMed] [Google Scholar]
- 192.Alhamami M, Kolios MC, Tavakkoli J. Photoacoustic detection and optical spectroscopy of high-intensity focused ultrasound-induced thermal lesions in biologic tissue. Med Phys. 2014 May;41(5) doi: 10.1118/1.4871621. [DOI] [PubMed] [Google Scholar]
- 193.Lai PX, McLaughlan JR, Draudt AB, Murray TW, Cleveland RO, Roy RA. Monitoring and guidance of high intensity focused ultrasound exposures in real time using acousto-optic imaging: feasibility and demonstration ex vivo. Proc Spie. 2010:7564. [Google Scholar]
- 194.Islam N, Hale R, Taylor M, Wilson A. The possible use of combined electrical impedance and ultrasound velocity measurements for the non-invasive measurement of temperature during mild hyperthermia. Physiol Meas. 2013 Sep;34(9):1103–22. doi: 10.1088/0967-3334/34/9/1103. [DOI] [PubMed] [Google Scholar]
- 195.Chen BT, Shieh J, Huang CW, Chen WS, Chen SR, Chen CS. Ultrasound thermal mapping based on a hybrid method combining physical and statistical models. Ultrasound Med Biol. 2014 Jan;40(1):115–29. doi: 10.1016/j.ultrasmedbio.2013.09.011. [DOI] [PubMed] [Google Scholar]