

Abstract
Serotonin (5-HT) is a neurotransmitter critically involved in a broad range of brain functions and implicated in the pathophysiology of neuropsychiatric illnesses including major depression, anxiety and sleep disorders. Despite being widely distributed throughout the brain, there is limited knowledge on the contribution of 5-HT to intrinsic brain activity. The dorsal raphe (DR) and median raphe (MR) nuclei are the source of most serotonergic neurons projecting throughout the brain and thus provide a compelling target for a seed-based probe of resting-state activity related to 5-HT. Here we implemented a novel multimodal neuroimaging approach for investigating resting-state functional connectivity (FC) between DR and MR and cortical, subcortical and cerebellar target areas. Using [11C]DASB positron emission tomography (PET) images of the brain serotonin transporter (5-HTT) combined with structural MRI from 49 healthy volunteers, we delineated DR and MR and performed a seed-based resting-state FC analysis. The DR and MR seeds produced largely similar FC maps: significant positive FC with brain regions involved in cognitive and emotion processing including anterior cingulate, amygdala, insula, hippocampus, thalamus, basal ganglia and cerebellum. Significant negative FC was observed within pre- and postcentral gyri for the DR but not for the MR seed. We observed a significant association between DR and MR FC and regional 5-HTT binding. Our results provide evidence for a resting-state network related to DR and MR and comprising regions receiving serotonergic innervation and centrally involved in 5-HT related behaviors including emotion, cognition and reward processing. These findings provide a novel advance in estimating resting-state FC related to 5-HT signaling, which can benefit our understanding of its role in behavior and neuropsychiatric illnesses.
Keywords: serotonin, resting-state, functional connectivity, dorsal raphe, median raphe
1 Introduction
The serotonin (5-hydroxytryptamine, 5-HT) neurotransmitter system is a critical component in the healthy functioning of the human brain and is involved in many functions such as sleep-wake cycle (Portas et al., 2000), reward (Liu et al., 2014), appetite (Curzon, 1990), emotion (Meneses and Liy-Salmeron, 2012), motor function (Di Matteo et al., 2008) and cognition (Meneses, 1999). Disruptions in the serotonin system have been implicated in a wide spectrum of neuropsychiatric disorders, including major depression disorder (Paul-Savoie et al., 2011), anxiety (Sullivan et al., 2005), bipolar disorder (Mahmood and Silverstone, 2001), chronic stress (Jovanovic et al., 2011), and drug addiction (Müller and Homberg, 2014).
Serotonergic innervation of cerebral cortex, subcortical structures and cerebellum originate for the greater part from the dorsal (DR) and median (MR) raphe nuclei (Dorocic et al., 2014; Hornung, 2003; Jacobs and Azmitia, 1992; Vertes and Linley, 2008). Thus, effects of serotonin signaling on brain function and behavior critically depend on appropriate communication with these nuclei. Despite substantial focus and clear relevance to delineating neurobiological mechanisms associated with various neuropsychiatric illnesses, the effects of serotonin signaling on brain function are not fully understood. Recent studies have reported that serotonin signaling modulates resting-state networks (RSNs) including the commonly studied default mode network (DMN) (Hahn et al., 2012; McCabe and Mishor, 2011). However, these studies have focused on networks modulated by serotonergic input rather than more directly modeling serotonin-related connectivity based on raphe nuclei intrinsic connectivity. The evaluation of the functional connectivity (FC) with DR or MR at rest would provide yet unreported novel insight into how serotonin signaling shapes intrinsic brain connectivity.
The purpose of this study was to elucidate FC of the DR and MR in the healthy human brain at rest. We used high resolution imaging of the serotonin transporter (5-HTT) with [11C]DASB positron emission tomography (PET), an effective probe of 5-HTT binding in receptor-rich regions (Frankle and Slifstein, 2006), combined with anatomical landmarks from structural magnetic resonance imaging (MRI) to determine subject-specific DR and MR regions of interests (ROIs). These ROIs were then transferred to functional MRI (fMRI) space where we performed seed-based FC to identify areas showing significant resting-state FC with DR and MR. Finally we correlated regional DR and MR FC with regional 5-HTT binding to assess the association between the identified FC maps and serotonin signaling.
2 Methods
2.1 Participants
Data from 63 healthy women were collected at baseline as part of a broader randomized, placebo-controlled and double-blind intervention study. Subjects were scanned before (baseline) and after an intervention. In the current study, the baseline data was used for the main analysis and the placebo intervention data was included only for the test-retest evaluation. The placebo intervention consisted of a single subcutaneous injection of saline into the abdomen approximately 4 weeks prior to rescan. Additional details regarding the overall study design can be found elsewhere (Frokjaer et al., under review). Importantly, all fMRI and PET data were acquired at a fixed time relative to their menstrual cycle phase (follicular), as determined by ovarian ultrasound. The study was registered and approved by the local ethics committee under the protocol number H-2-2010-108. After complete description of the study, written informed consent was obtained from all participants.
Of the 63 participants, 14 were excluded due to excessive motion (detailed below in 2.5 fMRI analysis) during the rs-fMRI scans at baseline. Thus rs-fMRI data from 49 participants (age 24.2 ± 4.7) was available for our analyses. To evaluate the reproducibility of the FC results, we repeated the FC analysis on data from the 20 participants that received placebo (age 25.6 ± 6.2) but were without excessive motion at baseline and rescan, using the seeds defined on the baseline PET images. DR and MR delineation was also performed on baseline and rescan PET images for these 20 participants and the overlap was evaluated.
2.2 Data acquisition
2.2.1 Magnetic resonance imaging (MRI)
Participants completed a 10-minute rs-fMRI scan (280 volumes) acquired on a Siemens (Erlangen, Germany) 3T Verio MR scanner. During rs-fMRI scans, participants were instructed to close their eyes, but not to fall asleep. The participants were asked after the scan whether they fell asleep during the scan; all participants reported not falling asleep. Scans were acquired using a T2*-weighted gradient echo-planar imaging (EPI) sequence sensitive to blood-oxygen level dependent (BOLD) signal (TR=2.15 s, TE=26 ms, flip-angle=78°, in-plane matrix 64x64, number of slices=42, voxel size=3x3x3 mm, GRAPPA acceleration factor 2, no gap, interleaved slice order). Pulse and respiratory data were sampled at 50 Hz using the Siemens' Physiological Monitoring Unit.
A high-resolution 3D T1-weighted structural image was acquired using a sagittal, magnetization prepared rapid gradient echo (MP-RAGE) sequence (TE/TR/TI=2.32/1900/900 ms, flip angle=9°, in-plane matrix 256x256, number of slices=224, voxel size=0.9x0.9x0.9 mm, GRAPPA acceleration factor 2, no gap, acquisition time = 8 min 30 sec). A high-resolution 3D T2-weighted image was acquired using a sagittal, Turbo Spin Echo (TSE) scan of the whole head (TE/TR= 409/3200 ms, flip angle=120º, in-plane matrix 256x256, number of slices=176, voxel size=1x1x1 mm, GRAPPA acceleration factor 2, acquisition time = 4 min 43 sec).
2.2.2 [11C] DASB positron emission tomography (PET) imaging
[11C]DASB PET list-mode data were acquired with a Siemens ECAT HRRT scanner operating in 3D-acquisition mode, with an approximate in-plane resolution of 2 mm. Scan duration was 90 minutes and started immediately after bolus injection of 585 ± 34 MBq [11C]DASB. Thirty-six dynamic PET frames (6x10 sec, 3x20 sec, 6x30 sec, 5x60 sec, 5x120 sec, 8x300 sec, 3x600 sec) were reconstructed using a 3D-OSEM-PSF algorithm (Comtat et al., 2008; Hong et al., 2007; Sureau et al., 2008). Realignment of PET frames was performed using AIR 5.2.5 (Woods et al., 1992) to account for within-scan motion.
5-HTT binding was quantified as [11C]DASB nondisplaceable binding potential (BPND) values determined with the Multilinear Reference Tissue Model 2 (Ichise et al., 2003) as previously described (Frokjaer et al., 2014). The kinetic modeling was performed using Freesurfer (Greve et al., 2013) with cerebellum gray matter segmentation as reference region and a combined thalamus, caudate, putamen and pallidum region as the high binding region for determining k2’. Surface and volume [11C]DASB BPND maps were smoothed by 10 and 6 mm full width half maximum (FWHM) Gaussian 2D and 3D filters, respectively.
2.3 Anatomical MRI Analysis
Structural images was analyzed in FreeSurfer (FS, surfer.nmr.mgh.harvard.edu, version 5.3) (Dale et al., 1999; Fischl and Dale, 2000; Fischl et al., 1999a, 1999b; Greve and Fischl, 2009; Ségonne et al., 2007, 2004). The T2-weighted structural images were used to refine the delineation of the pial surfaces. This process creates mesh models of the cortical surfaces and labels cortical and subcortical ROIs customized to each subject. Some of these ROIs were used to help create search spaces for the DR and MR. The cortical surfaces were aligned with a cortical surface atlas using nonlinear surface-based registration (Fischl et al., 1999a). This atlas is the surface-based equivalent to Talairach or MNI space and serves as a space in which voxel-wise group analysis can be performed on the surface. The anatomical volume was also registered to the MNI305 atlas which serves as the group analysis space for volume-based analysis of subcortical structures.
2.4 Delineation of DR and MR
Histological studies performed by Baker and colleagues (1991a, 1991b, 1990) have provided in-depth knowledge of the morphology and location of the DR and the MR in the ex vivo human brain. However, to perform seed-based FC, accurate in vivo segmentation of DR and MR are needed (Kalbitzer and Svarer, 2009). This presents a challenge (Kranz and Hahn, 2012), as the raphe nuclei are composed of sparse neurons surrounded by white matter and they have no well-defined boundaries visible in MRI (Baker et al., 1996, 1991a, 1990).
We have adopted a method similar to (Schain et al., 2013) in which liberal search volumes were defined on the structural MRI and then refined using the PET image. The DR lies on the midline of the brainstem and extends from the oculomotor nucleus to the middle of the pons (Baker et al., 1990). It can be subdivided at the level of the isthmus into two groups, a midbrain (B7) group and a pontine (B6) group (Dahlström and Fuxe, 1964) which meet near the inferior opening of the cerebral aqueduct (CA). The B7 group is adjacent to the CA. The B6 group is only about 0.5 mm in radius, well below current scanner resolution for fMRI. For this reason, we focused on the B7 group as the seed region for our analysis. The search volume for the DR was defined from the inferior to the superior limit of the CA and from the anterior boundary of the CA to approximately 6mm (5 voxels) anterior to that boundary. Lateral boundaries definitions were not needed for the refinement procedure.
The MR also lies on the midline of the brainstem and extends from the caudal pole of the DR to, approximately, the decussation of the superior cerebellar peduncle (Baker et al., 1991a). Based on this description, the search volume for the MR was defined from the inferior boundary of the CA down, and from the anterior limit of the 4th ventricle to (6 mm) 5 voxels anterior to that limit. Neither inferior nor lateral limits were needed for the refinement procedure.
The DR and MR search spaces were refined using a mean [11C]DASB image created by integrating the number of counts over time of the PET frames. The mean PET image was smoothed using a 3-voxel median filter to reduce spatial noise while preserving border (edge) integrity (Chin and Yeh, 1983) between the raphe and ventricular space. For delineation of the DR and MR, we used the mean uptake instead of the BPND because the kinetic modeling is noisy and requires spatial smoothing, which could introduce spatial uncertainty due to the proximity of low count regions such as the CA and 4th ventricle. The mean uptake image of a subject was registered to the gradient distortion (GD) corrected structural MRI using boundary-based registration (BBR) which has been shown to be a highly robust and accurate cross-modal registration technique (Greve and Fischl, 2009). GD correction was performed as described in Jovicich et al. (2006). This allowed for anatomical landmarks be transferred onto the PET image and to subsequently transfer back the seed region onto the structural MRI.
The refinement procedure was iterative. The first voxel of the ROI was defined by the highest PET value within the search volume. Subsequent voxels were added iteratively by selecting the voxel with the highest value within the neighborhood of the already-defined ROI until a target total volume was reached. The total volume of serotonergic neurons in the DR has been estimated to be 71.3±4.5 mm3 (Baker et al., 1990). However, Schain et al. (2013) suggested to use a volume estimate of 150 mm3, as the DR is composed of both grey and white matter. Based on the fact that the DR, excluding the caudal subnucleus, is about 57 mm3, we used a target volume of 115 mm3. The target volume used for the MR was 64 mm3, as suggested by Kranz & Hahn (2012). This procedure was applied to enforce local convergence; more lenient clustering methods, such as taking the maximum voxels within the search volume, led to structurally inhomogeneous ROIs, inconsistent with the morphology of the DR and MR. Once the iterative process completed, the seed was transferred onto the GD corrected structural MRI and an inverse gradient unwarping (i.e., reintroduction of gradient non-linearities) was applied to the ROIs to match gradient non-linearities present in the BOLD fMRI images.
2.5 fMRI analysis
The resting-state fMRI volumes were motion corrected using AFNI’s 3dVolReg (Cox and Hyde, 1997; Cox, 1996). Physiological noise was removed in a two-step procedure. First the raw time series was corrected for physiological noise using PESTICA v2 (Beall and Lowe, 2007; Beall, 2010) in conjunction with the respective cardiac and respiratory recordings. The second step, described more below, involved including nuisance regressors in the time series analysis. Spatial distortion caused by inhomogeneity of the B0 magnetic field was removed (Jezzard and Balaban, 1995). The DR, MR and aCompCor time series were then extracted from these data, prior to further processing (e.g. spatial filtering). Extracting the time series prior to spatial smoothing assures that signal outside of the target region does not corrupt the waveform.
The fMRI analysis was performed in the FreeSurfer Functional Analysis Stream (FSFAST, surfer.nmr.mgh.harvard.edu/fswiki/FsFast). The fMRI was registered to the structural MRI using BBR. In FSFAST, the time series analysis is separated into cortical and subcortical streams. In the cortical stream, the fMRI time series was sampled onto the left and right cortical surfaces and smoothed (Hagler Jr. et al., 2006) with a 10mm FWHM Gaussian filter. Smoothing on the surface reduces the blurring of white matter, cerebrospinal fluid, and subcortical gray matter with cortical gray matter as well as blurring across adjacent gyri. The surface time series data were then sampled into the group space of surface atlas. The subcortical structures were sampled into MNI305 space and volume smoothed with a 6mm FWHM Gaussian filter.
A general linear model (GLM) used to fit the time series data consisted of the DR or MR time series as well as several nuisance regressors. A high-pass filter (cutoff 0.01 Hz) was implemented by including polynomial regressors up to order 17. Noise of non-neuronal origin was estimated using aCompCor (Behzadi et al., 2007). As suggested by Chai et al. (2012), a mask was constructed combining white matter and ventricular and sulcal cerebrospinal fluid as defined for each subject from the FreeSurfer anatomical analysis; the mask was eroded by 1 anatomical voxel. The first 5 principal components of the BOLD time series from this mask were used as nuisance regressors. The six motion estimates were also used as nuisance regressors. The Euclidean norm of the first difference of the motion estimates, ||d||2, was computed (Jo et al., 2013). Frames containing excessive motion, based on the criterion ||d||2>0.2, were censored. A given frame at time t was censored by adding to the GLM a regressor where all values were 0 except at time t where the value was 1. For a given censored frame at time t, additional censoring regressors were also created for the previous frame (t-1) and the two subsequent frames (t+1) and (t+2). A subject’s data was excluded if more than 10% (28 frames) of the resting-state data were censored. The DR and MR were analyzed using different GLMs.
Group analysis was performed using a voxel-wise two-tailed t-test to determine the areas where the group means of the DR or MR regression coefficient was significantly different than zero. Correction for multiple comparisons was performed using a cluster-wise correction (Friston et al., 1994; Hagler Jr. et al., 2006). Clusters were defined using a voxel-wise threshold of p<0.001. Clusters with cluster-wise p<0.05 were deemed significant.
2.6 Association between FC and 5-HTT binding
The association between FC and 5-HTT binding was evaluated using a linear regression analysis. For every subject, we computed the mean [11C]DASB BPND and mean FC for the 42 cortical and subcortical brain regions defined by FreeSurfer as containing gray matter (left and right hemispheres were averaged together) and we computed the within-subject slope for [11C]DASB BPND against FC. We then performed a two-tailed t-test to determine whether the distribution of slopes across subjects was different than 0.
3 Results
3.1 DR and MR seeds
An example of DR and MR segmentation is shown in Figure 1. The average centroid of the DR was (0, −31 −9) in MNI305 space; that of the MR was (0,−35,−21). Although the volume of the seeds defined on the PET images was constant, the reintroduction of GD slightly affected the final volume of the seeds from subject to subject; the volume (mean ± std) was 118±11mm3 for DR and 65±8mm3 for MR. For the same reason, the number of functional voxels was 18±3 for DR and 11±2 for MR. The median correlation between the DR and MR raw time-series was 0.26 (range −0.24 − 0.62).
Figure 1.

(A) Structural MRI image. The raphe nuclei are not identifiable. (B) [11C]DASB PET image superimposed on the corresponding structural image, highlighting the 5-HTT system. The raphe nuclei are visible within brainstem as regions of higher binding. (C)Delineation of the DR and MR nuclei based on [11C]DASB PET. (D) DR and MR identified from the [11C]DASB PET image transferred as seeds onto the structural image.
3.2 FC of the DR and MR and its association with 5-HTT binding
The group-level FC maps revealed that the DR seed was functionally connected with multiple cortical and subcortical regions (Figure 2; Table 1). For the cortical surface, we observed significant bilateral positive FC within the parahippocampal gyrus, insula and rostral anterior cingulate (rACC). Clusters showing significant negative FC were observed bilaterally within somatosensory areas including paracentral lobule and the pre- and postcentral gyrus and minor negative clusters were observed in superior parietal lobule and superior frontal gyrus. For subcortical regions, we observed a large cluster centered on the seed in brainstem showing statistically significant positive FC. This cluster extended outside brainstem to include regions of the basal ganglia (putamen, caudate, pallidum, accumbens), limbic structures (hippocampus and amygdala), thalamus, cerebellum and ventral diencephalon.
Figure 2.

Group-level FC map for the DR seed, inflated cortical surface and in volume. The map displays clusters of statistically significant FC, corrected for multiple comparisons. Color scales reflect -log10(p) values. Negative p-values (blue) are used to denote regions exhibiting negative FC. The six axial slices correspond to Z = −20, −15, −10, −5, 0 and 5 (left to right). Right is right in axial images.
Table 1.
Significant clusters functionally connected with the DR at rest.
| Region | Cluster p-value | Size (mm2) | MNI | ||
|---|---|---|---|---|---|
| X | Y | Z | |||
| Positive FC | |||||
| Left Cortical Hemisphere | |||||
| Parahippocampal gyrus | 0.0001 | 1581 | −18 | −39 | −6 |
| Insula | 0.0001 | 1040 | −34 | −16 | −6 |
| Rostral anterior cingulate gyrus | 0.0001 | 805 | −6 | 37 | 8 |
| Right Cortical Hemisphere | |||||
| Parahippocampal gyrus | 0.0001 | 1737 | 19 | −35 | −9 |
| Medial orbitofrontal gyrus | 0.0001 | 1073 | 14 | 43 | −3 |
| Insula | 0.0001 | 1043 | 38 | −4 | −12 |
| Superior temporal gyrus | 0.0003 | 486 | 48 | −12 | −18 |
| Negative FC | |||||
| Left Cortical Hemisphere | |||||
| Postcentral gyrus | 0.0001 | 1337 | −39 | −33 | 47 |
| Precentral gyrus | 0.0112 | 295 | −34 | −22 | 58 |
| Superior frontal gyrus | 0.0121 | 291 | −7 | −7 | 51 |
| Right Cortical Hemisphere | |||||
| Superior parietal gyrus | 0.0001 | 2181 | 32 | −44 | 48 |
| Precentral gyrus | 0.0037 | 359 | 57 | 7 | 29 |
| Paracentral gyrus | 0.0122 | 289 | 12 | −19 | 47 |
| Region | Cluster p-value | Size v | MNI | ||
|---|---|---|---|---|---|
| X | Y | Z | |||
| Subcortical | |||||
| Brainstem JJan | <0.0001 | 197264 | −29 | −11 | 27 |
Group-level FC results for MR were largely similar to DR results (Figure 3; Table 2). On the cortical surface, we observed significant bilateral positive FC within the parahippocampal gyrus, insula and rACC. Subcortically, we observed a cluster centered on the seed and extending outside brainstem and including putamen, caudate, pallidum, hippocampus and amygdala, thalamus, cerebellum, ventral diencephalon and accumbens area.
Figure 3.

Group-level FC map for the MR seed, inflated cortical surface and in volume. The map displays clusters of statistically significant FC, corrected for multiple comparisons. Color scales reflect −log10(p) values. No statistically significant negative FC was observed. The six axial slices correspond to Z = −20, −15, −10, −5, 0 and 5 (left to right). Right is right in axial images.
Table 2.
Significant clusters functionally connected with the MR at rest.
| Region | Cluster p-value | Size (mm2) | MNI | ||
|---|---|---|---|---|---|
| X | Y | Z | |||
| Left Cortical Hemisphere | |||||
| Rostral anterior cingulate gyrus | 0.0001 | 2393 | −6 | 41 | −1 |
| Parahippocampal gyrus | 0.0001 | 1811 | −28 | −36 | −16 |
| Insula | 0.0001 | 765 | −30 | 13 | −13 |
| Precuneus | 0.0042 | 361 | −7 | −68 | 30 |
| Lateral orbitofrontal cortex | 0.0140 | 278 | −35 | 33 | −10 |
| Right Cortical Hemisphere | |||||
| Parahippocampal gyrus | 0.0001 | 2585 | 24 | −29 | −20 |
| Rostral anterior cingulate gyrus | 0.0001 | 1255 | 7 | 39 | −1 |
| Insula | 0.0001 | 1104 | 36 | 8 | −12 |
| Middle temporal gyrus | 0.0001 | 674 | 62 | −23 | −18 |
| Region | Cluster p-value | Size (mm3) | MNI | ||
|---|---|---|---|---|---|
| X | Y | Z | |||
| Subcortical | |||||
| Brainstem | <0.0001 | 228744 | −35 | −21 | 29 |
A prominent difference between the DR and MR FC maps was significant negative FC for the DR but not the MR. FC for both seeds had some overlap but also covered distinct and separate areas (Figure 4). A subject-wise paired t-test between DR and MR FC results showed a significant difference (voxel threshold p=0.001 and cluster threshold p=0.05) only within the postcentral and superior frontal gyri and brainstem; as the seed was located in brainstem the latter difference will not be addressed further.
Figure 4.

Overlap of significant negative or positive FC of DR and MR. Blue corresponds to DR only, green MR only and red is the overlap between DR and MR. Most clusters overlap to some extent, except for the pre- and postcentral gyrus for DR. The six axial slices correspond to Z = −20, −15, −10, −5, 0 and 5 (left to right), right is right in axial images.
Since serotonergic neurons (and axons) are abundant in 5-HTT and it has been shown that co-localization between 5-HT and 5-HTT positive fibers is close to 100% (Nielsen et al., 2006) we evaluated if DR or MR FC was correlated with 5-HTT binding at a regional level. For both seeds we observed a significant positive association between [11C]DASB BPND and FC (p <0.0001) (Figure 5).
Figure 5.
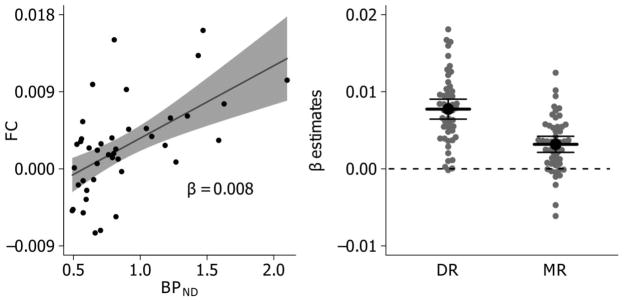
(A) Example of single-subject association between [11C]DASB BPND vs. FC with DR across 42 brain regions (see section 2.6 for details). β represents the slope estimate and shading along line represents 95% confidence interval (CI) on slope estimate. (B) Gray points reflect single subject slope estimates for each respective seed and black dots and lines reflects mean and 95% CI across subjects. The DR and MR slope estimates are mostly positive, indicating a positive association between 5-HTT binding and raphe FC in the vast majority of individuals.
3.3 Test-retest evaluation of the FC maps and raphe delineation
Test-retest differences were evaluated by comparing baseline and rescan data for 20 participants who received a placebo and whose rs-fMRI data did not contain excessive motion on both baseline and rescan. First, new DR and MR seeds were generated on the baseline structural MRI with the rescan PET images. The median overlap was 31% (range 15%–42%) for DR and 37% (range 24%–53%) for MR and the median volume difference was 13 mm3 (range 3 – 27 mm3) for DR and 11 mm3 (range 1 – 30 mm3) for MR; see Supplementary Figure 1 for an example of DR and MR delineation at baseline and rescan. Next, new FC maps were generated for both the baseline and rescan fMRI using the baseline seed definitions (Supplementary Figure 2–3). The clusters looked similar but more spatially constrained and with a lower statistical significance due to the reduced sample size (only 20 subjects versus 49). The group-level results of the paired difference between the FC maps at baseline and rescan showed no statistically significant clusters. Finally, new FC maps were generated from the rescan fMRI using the rescan seed definitions (Supplementary Figure 2–3). Again, the maps looked similar to when the baseline seeds were used and no statistically significant difference was observed between the two maps.
4 Discussion
Here we sought to investigate serotonin-related FC using a multimodal neuroimaging approach for delineation of the DR and MR within a cohort of 49 healthy women. We identified brain regions significantly functionally connected with both nuclei and observed a statistically significant association between raphe FC and 5-HTT binding suggesting a compelling serotonergic component to the intrinsic brain activity related to the raphe nuclei.
We observed significant and distributed FC between both raphe seeds and medial prefrontal cortex (mPFC) and anterior cingulate cortex (ACC). Structural evidence supports the presence of direct reciprocal projections between mPFC and raphe (Behzadi et al., 1990; Peyron et al., 1998; Vertes and Linley, 2008; Vertes, 1991) and direct stimulation of mPFC has been shown to modulate raphe 5-HT neuron activity (Hajós et al., 1998). Electrophysiological evidence from rodents indicates that mPFC-raphe feedback is modulated via serotonin 1A, 2A and 4 receptor signaling (Celada et al., 2001; Lucas et al., 2005; Riad et al., 1999; Sharp et al., 2007) and that stimulation of mPFC axons in the DR induces a rapid antidepressant-like behavioral effect (Warden et al., 2012). Furthermore, two human neuroimaging studies from our lab have also demonstrated an association between mPFC 5-HTT binding and cortisol awakening response, a putative marker of stress responsiveness (Frokjaer et al., 2014, 2013). From a clinical perspective, the prominent raphe-mPFC FC that we observed is also particularly interesting considering converging evidence that mPFC dysfunction is linked to a myriad of neuropsychiatric illnesses including depression and may affect treatment response (Mayberg et al., 2005; Pizzagalli, 2011). Although rs-fMRI does not allow us to disentangle directionality (i.e., raphe to mPFC signaling or vice versa), our findings of significant connectivity between these regions supports this as an informative approach for delineating serotonin-related raphe-mPFC circuit function. Future studies employing this approach would benefit our understanding of its relevance in predicting prefrontal-mediated behaviors or neuropsychiatric illnesses.
A prominent feature of our results is the large overlapping subcortical clusters of positive FC common to both raphe seeds (see Figure 4). The observation of a singular subcortical cluster is somewhat uninformative about region-specific FC. Thus, we evaluated FC maps at more conservative voxel-level thresholds of p<10−3, 10−5 and 10−7. Even at these thresholds, subclusters did not emerge. We think it is unlikely that this one large cluster is simply an artifact reflecting the combination of 6mm spatial smoothing and the raphe seed correlating with itself. Although the cluster peak is located in the raphe seed, other activated structures are far away. For example, thalamus is approximately 25mm away and basal ganglia and hippocampus are more than 30mm away. These distances are more than 10 standard deviations of the 6mm FWHM kernel away from the raphe seed, so FC is unlikely to be simple spill-over from raphe. Our observation that regional FC and 5-HTT are positively correlated and that many of these subcortical regions have high 5-HTT binding suggests that the presence of a single large subcortical cluster may reflect, in part, serotonergic effects on FC. Further evaluation of raphe connectivity with recently described methods that may limit smoothing effects may prove effective in delineating discrete clusters (Beissner et al., 2014). However, similar subcortical RSNs have previously been identified in a number of studies and have been referred to as a limbic or basal ganglia RSN (Damoiseaux and Beckmann, 2008; Janes et al., 2012; Kim et al., 2013; Martino and Scheres, 2008; Moussa et al., 2012; Robinson et al., 2009, 2008; Schöpf and Kasess, 2010; Smith et al., 2009). However, their functional relevance was in many cases not considered. Our results suggest that this subcortical RSN is related to intrinsic raphe activity and may be associated with the 5-HT system. Although some studies reporting similar FC maps using seed-based analysis (Kong et al., 2010; Martino and Scheres, 2008), most studies used ICA methods, which decompose the rs-fMRI signal into a predefined number of components. However, many independent components are required when using ICA methods to isolate the subcortical RSN (e.g. Janes et al. (2012) used 35 components), which can segregate salient networks such as the DMN into multiple components. Particular care is needed when using ICA to identify subcortical RSNs and in the context of studying serotonergic features, such as a relation with mPFC, a hypothesis-driven approach such as our seed-based method might be advantageous to a purely data-driven method like ICA.
Converging evidence supports an association between structural and functional connectivity at rest within the human brain (Hermundstad et al., 2013; Heuvel and Mandl, 2009). Although efferent and afferent raphe projections have been studied extensively, the bulk of this work was performed in animal models and caution needs to be taken when interpreting human data in light of these studies. Nonetheless, the observed raphe FC maps appears to be generally consistent with the overall known DR and MR projections, although discrepancies can be found (see Vertes and Linley (2008) for an extensive review of the raphe projections). It is interesting to note that although DR and MR have efferent projections to distinct brain areas (Vertes and Linley, 2007; Vertes, 2004), they mostly share afferent projections from common brain areas and there is extensive innervation between the nuclei (Vertes and Linley, 2008). These features could explain the striking similarity between the two FC maps. However, one of the most noticeable differences between the FC maps is the presence of significant negative FC within postcentral and superior frontal gyri for the DR but not for MR. Interestingly, DR has been shown to modulate a nociceptive pathway including somatosensory cortex (Prieto-Gómez et al., 1989; Reyes-Vazquez et al., 1989; Wang and Nakai, 1994), which may underlie the observed FC with this region. Alternatively, our seed may capture signal from the neighboring periacqueductal gray, a region also involved in nociception (Kong et al., 2010; Linnman et al., 2012). The spatial resolution of our functional images makes it difficult to spatially disentangle these regions. Thus, future higher-resolution studies (e.g., at 7T) would help resolve this overlap. Nonetheless, given the association we have identified between raphe FC and 5-HTT binding and the striking similarity between MR, distinct from periacqueductal gray, and DR FC maps, our method may provide a novel method for probing the association between nociception and the 5-HT system.
5 Limitations and technical concerns
We attempted to effectively account for inherent challenges when estimating raphe FC, however our study is not without limitations. Our target regions and the resulting ROIs are very small, which makes them susceptible to motion and being in brainstem makes them sensitive to physiological noise (Brooks and Faull, 2013). Although these issues are a concern, we have taken steps to minimize these effects including strict exclusion criteria based on motion estimates and implementation of current tools for correction of physiological noise. However, it is plausible that physiological noise not well captured by these methods represents a potential confound. Furthermore, our test-retest evaluation showed no significant group-level differences. Recent work using ICA has shown that it might be possible to identify brainstem nuclei using conventional fMRI, which might provide an alternative method to our approach (Beissner et al., 2014), however the physiological validity of this technique still needs to be proved. A recent study has demonstrated that subjects may drift between wakefulness and sleep during rs-fMRI (Tagliazucchi and Laufs, 2014). As the 5-HT system is linked to wakefulness (Portas et al., 2000; Shima et al., 1986) this is a potentially important source of variation. Although subjects indicated that they did not sleep during the resting-state scan session, robust monitoring of the awake state could be secured in future studies using MRI-compatible EEG. Given that our dataset comprised only women, future studies in males would inform whether our observed FC maps are sex-specific. Finally, although we feel that the nature of the placebo intervention is unlikely to have perturbed serotonin signaling or rs-fMRI connectivity, we cannot rule this out as a potential source of additional variability affecting the test-retest of our data.
DR and MR notably also include non-serotonergic neurons, which may limit the extent to which these maps capture features specific for 5-HT signaling. Approximately half of the neurons within DR and MR are serotonergic (Jacobs and Azmitia, 1992; Steinbusch et al., 1980; Wiklund et al., 1981) and the 5-HT and non-5-HT containing neurons have distinct electrophysiological properties (Beck and Pan, 2004; Hornung, 2003; Kirby et al., 2003; Michelsen et al., 2007), thereby limiting the extent to which these maps may reflect effects of 5-HT, specifically. Future studies directly manipulating 5-HT (e.g., using a pharmacological challenge such as tryptophan depletion or 5-HTT inhibition) could be an effective probe for evaluating aspects of the serotonergic contribution to raphe FC.
6 Conclusion
We have demonstrated a biologically driven method for accurate delineation of the DR and MR ROIs in neuroimaging studies. We then performed a seed-based analysis and identified FC related to these nuclei. The FC map were very similar for both seeds; positive FC was found with cortical regions such as rACC, insula, parahippocampal gyrus and subcortical regions such as basal ganglia, thalamus, hippocampus, amygdala and cerebellum. We found a positive association between raphe FC and 5-HTT binding supporting a serotonergic contribution to the observed resting-state signal. Our results suggest that raphe FC is related to the previously identified subcortical RSN. Further investigation of this network might prove similarly useful for studying 5-HT related brain disorders.
Supplementary Material
Highlights.
We investigated serotonin-related resting-state functional connectivity (FC).
We present a novel multi-modal method for delineating the dorsal and median raphe.
Functional connectivity of these nuclei at rest was evaluated.
Brain regions functionally connected to the raphe nuclei were identified.
Raphe FC was positively associated with serotonin transporter binding.
Acknowledgments
We wish to thank Dorthe Givard, Peter Jensen, Anna Pors Nielsen, Maria Heede, Kenda Christensen, Susanne Henningsson and Sussi Larsen for superb technical assistance. The study was funded by The Danish Council for Independent Research, The Lundbeck Foundation (Cimbi), and The Capital Region of Denmark, Foundation for Health Research. Support for this research was also provided in part by the National Institutes of Health grants 1R21EB018964-01 and 1R01NS083534-01A1.
Footnotes
Conflict of Interest
GMK has received honoraria as Field Editor of the International Journal of Neuropsychopharmacology and as scientific advisor for H. Lundbeck A/S. VGF has received honorarium as speaker for H. Lundbeck A/S. All other authors declare that they have no conflicts of interest.
Publisher's Disclaimer: This is a PDF file of an unedited manuscript that has been accepted for publication. As a service to our customers we are providing this early version of the manuscript. The manuscript will undergo copyediting, typesetting, and review of the resulting proof before it is published in its final citable form. Please note that during the production process errors may be discovered which could affect the content, and all legal disclaimers that apply to the journal pertain.
References
- Baker K, Halliday G, Halasz P. Cytoarchitecture of serotonin- synthesizing neurons in the pontine tegmentum of the human brain. Synapse. 1991a;7:301–320. doi: 10.1002/syn.890070407. [DOI] [PubMed] [Google Scholar]
- Baker K, Halliday G, Hornung J. Distribution, morphology and number of monoamine-synthesizing and substance P-containing neurons in the human dorsal raphe nucleus. Neuroscience. 1991b;42:757–775. doi: 10.1016/0306-4522(91)90043-n. [DOI] [PubMed] [Google Scholar]
- Baker K, Halliday G, Kril J, Harper C. Chronic alcoholism in the absence of Wernicke-Korsakoff syndrome and cirrhosis does not result in the loss of serotonergic neurons from the median raphe nucleus. Metab Brain Dis. 1996;11:217–227. doi: 10.1007/BF02237959. [DOI] [PubMed] [Google Scholar]
- Baker K, Halliday G, Törk I. Cytoarchitecture of the human dorsal raphe nucleus. J Comp Neurol. 1990;161:147–161. doi: 10.1002/cne.903010202. [DOI] [PubMed] [Google Scholar]
- Beall E. Adaptive cyclic physiologic noise modeling and correction in functional MRI. J Neurosci Methods. 2010;187:216–228. doi: 10.1016/j.jneumeth.2010.01.013. [DOI] [PubMed] [Google Scholar]
- Beall E, Lowe M. Isolating physiologic noise sources with independently determined spatial measures. Neuroimage. 2007;37:1286–1300. doi: 10.1016/j.neuroimage.2007.07.004. [DOI] [PubMed] [Google Scholar]
- Beck S, Pan Y. Median and dorsal raphe neurons are not electrophysiologically identical. J Neurophysiol. 2004;91:994–1005. doi: 10.1152/jn.00744.2003. [DOI] [PMC free article] [PubMed] [Google Scholar]
- Behzadi G, Kalén P, Parvopassu F, Wiklund L. Afferents to the median raphe nucleus of the rat: retrograde cholera toxin and wheat germ conjugated horseradish peroxidase tracing, and selective D-[3H]aspartate labelling of possible excitatory amino acid inputs. Neuroscience. 1990;37:77–100. doi: 10.1016/0306-4522(90)90194-9. [DOI] [PubMed] [Google Scholar]
- Behzadi Y, Restom K, Liau J, Liu T. A component based noise correction method (CompCor) for BOLD and perfusion based fMRI. Neuroimage. 2007;37:90–101. doi: 10.1016/j.neuroimage.2007.04.042. [DOI] [PMC free article] [PubMed] [Google Scholar]
- Beissner F, Schumann A, Brunn F, Eisenträger D, Bär KJ. Advances in functional magnetic resonance imaging of the human brainstem. Neuroimage. 2014;86:91–98. doi: 10.1016/j.neuroimage.2013.07.081. [DOI] [PubMed] [Google Scholar]
- Brooks J, Faull O. Physiological noise in brainstem fMRI. Front Hum Neurosci. 2013:1–13. doi: 10.3389/fnhum.2013.00623. [DOI] [PMC free article] [PubMed] [Google Scholar]
- Celada P, Puig MV, Casanovas JM, Guillazo G, Artigas F. Control of dorsal raphe serotonergic neurons by the medial prefrontal cortex: Involvement of serotonin-1A, GABA(A), and glutamate receptors. J Neurosci. 2001;21:9917–9929. doi: 10.1523/JNEUROSCI.21-24-09917.2001. [DOI] [PMC free article] [PubMed] [Google Scholar]
- Chai X, Castañón A, Öngür D, Whitfield-Gabrieli S. Anticorrelations in resting state networks without global signal regression. Neuroimage. 2012;59:1420–1428. doi: 10.1016/j.neuroimage.2011.08.048. [DOI] [PMC free article] [PubMed] [Google Scholar]
- Chin R, Yeh C. Quantitative evaluation of some edge-preserving noise-smoothing techniques. Comput Vision, Graph Image Process. 1983;23:67–91. [Google Scholar]
- Comtat C, Sureau FC, Sibomana M, Hong IK, Sjoholm N, Trebossen R. Image based resolution modeling for the HRRT OSEM reconstructions software. 2008 IEEE Nuclear Science Symposium Conference Record; IEEE; 2008. pp. 4120–4123. [Google Scholar]
- Cox RW. AFNI: software for analysis and visualization of functional magnetic resonance neuroimages. Comput Biomed Res. 1996;29:162–173. doi: 10.1006/cbmr.1996.0014. [DOI] [PubMed] [Google Scholar]
- Cox RW, Hyde JS. Software tools for analysis and visualization of fMRI data. NMR Biomed. 1997;10:171–178. doi: 10.1002/(sici)1099-1492(199706/08)10:4/5<171::aid-nbm453>3.0.co;2-l. [DOI] [PubMed] [Google Scholar]
- Curzon G. Serotonin and appetite. Ann N Y Acad Sci. 1990;600:521–530. doi: 10.1111/j.1749-6632.1990.tb16907.x. [DOI] [PubMed] [Google Scholar]
- Dahlström A, Fuxe K. Evidence for the existence of monoamine-containing neurons in the central nervous system. I Demonstration of monoamines in the cell bodies of brain stem neurons. Acta Physiol Scand Suppl. 1964;232:1–55. [PubMed] [Google Scholar]
- Dale A, Fischl B, Sereno M. Cortical surface-based analysis: I. Segmentation and surface reconstruction. Neuroimage. 1999;194:179–194. doi: 10.1006/nimg.1998.0395. [DOI] [PubMed] [Google Scholar]
- Damoiseaux J, Beckmann C. Reduced resting-state brain activity in the —default network in normal aging. Cereb Cortex. 2008;18:1856–1864. doi: 10.1093/cercor/bhm207. [DOI] [PubMed] [Google Scholar]
- Di Matteo V, Pierucci M, Esposito E, Crescimanno G, Benigno A, Di Giovanni G. Serotonin modulation of the basal ganglia circuitry: therapeutic implication for Parkinson’s disease and other motor disorders. Prog Brain Res. 2008;172:423–463. doi: 10.1016/S0079-6123(08)00921-7. [DOI] [PubMed] [Google Scholar]
- Dorocic IP, Fürth D, Xuan Y, Johansson Y, Pozzi L, Silberberg G, Carlén M, Meletis K. A Whole-Brain Atlas of Inputs to Serotonergic Neurons of the Dorsal and Median Raphe Nuclei. Neuron. 2014;83:663–678. doi: 10.1016/j.neuron.2014.07.002. [DOI] [PubMed] [Google Scholar]
- Fischl B, Dale AM. Measuring the thickness of the human cerebral cortex from magnetic resonance images. Proc Natl Acad Sci U S A. 2000;97:11050–11055. doi: 10.1073/pnas.200033797. [DOI] [PMC free article] [PubMed] [Google Scholar]
- Fischl B, Sereno M, Tootell R, Dale A. High-resolution intersubject averaging and a coordinate system for the cortical surface. Hum Brain Mapp. 1999a;8:272–284. doi: 10.1002/(SICI)1097-0193(1999)8:4<272::AID-HBM10>3.0.CO;2-4. [DOI] [PMC free article] [PubMed] [Google Scholar]
- Fischl B, Sereno MI, Dale AM. Cortical surface-based analysis. II: Inflation, flattening, and a surface-based coordinate system. Neuroimage. 1999b;9:195–207. doi: 10.1006/nimg.1998.0396. [DOI] [PubMed] [Google Scholar]
- Frankle W, Slifstein M. Estimation of serotonin transporter parameters with 11C-DASB in healthy humans: reproducibility and comparison of methods. J Nucl Med. 2006:815–826. [PubMed] [Google Scholar]
- Friston KJ, Worsley KJ, Frackowiak RS, Mazziotta JC, Evans aC. Assessing the significance of focal activations using their spatial extent. Hum Brain Mapp. 1994;1:210–220. doi: 10.1002/hbm.460010306. [DOI] [PubMed] [Google Scholar]
- Frokjaer VG, Erritzoe D, Holst KK, Jensen PS, Rasmussen PM, Fisher PM, Baaré W, Madsen KS, Madsen J, Svarer C, Knudsen GM. Prefrontal serotonin transporter availability is positively associated with the cortisol awakening response. Eur Neuropsychopharmacol. 2013;23:285–294. doi: 10.1016/j.euroneuro.2012.05.013. [DOI] [PubMed] [Google Scholar]
- Frokjaer VG, Erritzoe D, Holst KK, Madsen KS, Fisher PM, Madsen J, Svarer C, Knudsen GM. In abstinent MDMA users the cortisol awakening response is off-set but associated with prefrontal serotonin transporter binding as in non-users. Int J Neuropsychopharmacol. 2014;17:1119–1128. doi: 10.1017/S1461145714000066. [DOI] [PubMed] [Google Scholar]
- Frokjaer VG, Pinborg A, Holst KK, Overgaard A, Henningsson S, Heede M, Larsen EC, Jensen PS, Agn M, Nielsen AP, Stenbæk DS, da Cunha-Bang S, Lehel S, Siebner HR, Mikkelsen JD, Svarer C, Knudsen GM. Role of serotonin transporter changes in depressive responses to sex-steroid hormone manipulation: A PET study. Under review. [DOI] [PubMed] [Google Scholar]
- Greve D, Fischl B. Accurate and robust brain image alignment using boundary-based registration. Neuroimage. 2009;48:63–72. doi: 10.1016/j.neuroimage.2009.06.060. [DOI] [PMC free article] [PubMed] [Google Scholar]
- Greve D, Svarer C, Fisher P, Feng L. Cortical surface-based analysis reduces bias and variance in kinetic modeling of brain PET data. Neuroimage. 2013;92C:225–236. doi: 10.1016/j.neuroimage.2013.12.021. [DOI] [PMC free article] [PubMed] [Google Scholar]
- Hagler D, Jr, Saygin A, Sereno M. Smoothing and cluster thresholding for cortical surface-based group analysis of fMRI data. Neuroimage. 2006;33:1093–1103. doi: 10.1016/j.neuroimage.2006.07.036. [DOI] [PMC free article] [PubMed] [Google Scholar]
- Hahn A, Wadsak W, Windischberger C, Baldinger P, Hoflich AS, Losak J, Nics L, Philippe C, Kranz GS, Kraus C, Mitterhauser M, Georgios K, Kasper S, Lanzenberger R. Differential modulation of the default mode network via serotonin-1A receptors. Proc Natl Acad Sci. 2012;109:2619–2624. doi: 10.1073/pnas.1117104109. [DOI] [PMC free article] [PubMed] [Google Scholar]
- Hajós M, Richards C, Székely A, Sharp T. An electrophysiological and neuroanatomical study of the medial prefrontal cortical projection to the midbrain raphe nuclei in the rat. Neuroscience. 1998;87:95–108. doi: 10.1016/s0306-4522(98)00157-2. [DOI] [PubMed] [Google Scholar]
- Hermundstad AM, Bassett DS, Brown KS, Aminoff EM, Clewett D, Freeman S, Frithsen A, Johnson A, Tipper CM, Miller MB, Grafton ST, Carlson JM. Structural foundations of resting-state and task-based functional connectivity in the human brain. Proc Natl Acad Sci U S A. 2013;110:6169–6174. doi: 10.1073/pnas.1219562110. [DOI] [PMC free article] [PubMed] [Google Scholar]
- van den Heuvel M, Mandl R. Functionally linked resting-state networks reflect the underlying structural connectivity architecture of the human brain. Hum Brain Mapp. 2009;3141:3127–3141. doi: 10.1002/hbm.20737. [DOI] [PMC free article] [PubMed] [Google Scholar]
- Hong IK, Chung ST, Kim HK, Kim YB, Son YD, Cho ZH. Ultra Fast Symmetry and SIMD-Based Projection-Backprojection (SSP) Algorithm for 3-D PET Image Reconstruction. IEEE Trans Med Imaging. 2007;26:789–803. doi: 10.1109/tmi.2007.892644. [DOI] [PubMed] [Google Scholar]
- Hornung J. The human raphe nuclei and the serotonergic system. J Chem Neuroanat. 2003;26:331–343. doi: 10.1016/j.jchemneu.2003.10.002. [DOI] [PubMed] [Google Scholar]
- Ichise M, Liow J, Lu J, Takano A. Reference Tissue Parametric Imaging Methods: Application to [11C] DASB Positron Emission Tomography Studies of the Serotonin Transporter in. J Cereb blood flow Metab. 2003;23:1096–1112. doi: 10.1097/01.WCB.0000085441.37552.CA. [DOI] [PubMed] [Google Scholar]
- Jacobs B, Azmitia E. Structure and function of the brain serotonin system. Physiol Rev. 1992;72:165–229. doi: 10.1152/physrev.1992.72.1.165. [DOI] [PubMed] [Google Scholar]
- Janes A, Nickerson L, de Blaise FB, Kaufman M. Prefrontal and limbic resting state brain network functional connectivity differs between nicotine-dependent smokers and non-smoking controls. Drug Alcohol Depend. 2012;125:252–259. doi: 10.1016/j.drugalcdep.2012.02.020. [DOI] [PMC free article] [PubMed] [Google Scholar]
- Jezzard P, Balaban R. Correction for geometric distortion in echo planar images from B0 field variations. Magn Reson Med. 1995;34:65–73. doi: 10.1002/mrm.1910340111. [DOI] [PubMed] [Google Scholar]
- Jo H, Gotts S, Reynolds R. Effective preprocessing procedures virtually eliminate distance-dependent motion artifacts in resting state FMRI. J Appl Math. 2013;2013 doi: 10.1155/2013/935154. [DOI] [PMC free article] [PubMed] [Google Scholar]
- Jovanovic H, Perski A, Berglund H, Savic I. Chronic stress is linked to 5-HT(1A) receptor changes and functional disintegration of the limbic networks. Neuroimage. 2011;55:1178–1188. doi: 10.1016/j.neuroimage.2010.12.060. [DOI] [PubMed] [Google Scholar]
- Jovicich J, Czanner S, Greve D, Haley E, van der Kouwe A, Gollub R, Kennedy D, Schmitt F, Brown G, Macfall J, Fischl B, Dale A. Reliability in multi-site structural MRI studies: effects of gradient non-linearity correction on phantom and human data. Neuroimage. 2006;30:436–443. doi: 10.1016/j.neuroimage.2005.09.046. [DOI] [PubMed] [Google Scholar]
- Kalbitzer J, Svarer C. A probabilistic approach to delineating functional brain regions. J Nucl Med Technol. 2009;37:91–95. doi: 10.2967/jnmt.108.054056. [DOI] [PubMed] [Google Scholar]
- Kim D, Park B, Park H. Functional connectivity-based identification of subdivisions of the basal ganglia and thalamus using multilevel independent component analysis of resting state fMRI. Hum Brain Mapp. 2013;34:1371–1385. doi: 10.1002/hbm.21517. [DOI] [PMC free article] [PubMed] [Google Scholar]
- Kirby L, Pernar L, Valentino R, Beck S. Distinguishing characteristics of serotonin and non-serotonin-containing cells in the dorsal raphe nucleus: electrophysiological and immunohistochemical. Neuroscience. 2003;116:669–683. doi: 10.1016/s0306-4522(02)00584-5. [DOI] [PMC free article] [PubMed] [Google Scholar]
- Kong J, Tu P, Zyloney C, Su T. Intrinsic functional connectivity of the periaqueductal gray, a resting fMRI study. Behav Brain Res. 2010;211:215–219. doi: 10.1016/j.bbr.2010.03.042. [DOI] [PMC free article] [PubMed] [Google Scholar]
- Kranz G, Hahn A. Challenges in the differentiation of midbrain raphe nuclei in neuroimaging research. Proc Natl Acad Sci. 2012;109:E2000. doi: 10.1073/pnas.1206247109. [DOI] [PMC free article] [PubMed] [Google Scholar]
- Linnman C, Moulton Ea, Barmettler G, Becerra L, Borsook D. Neuroimaging of the periaqueductal gray: state of the field. Neuroimage. 2012;60:505–522. doi: 10.1016/j.neuroimage.2011.11.095. [DOI] [PMC free article] [PubMed] [Google Scholar]
- Liu Z, Zhou J, Li Y, Hu F, Lu Y, Ma M, Feng Q, Zhang JE, Wang D, Zeng J, Bao J, Kim JY, Chen ZF, El Mestikawy S, Luo M. Dorsal raphe neurons signal reward through 5-HT and glutamate. Neuron. 2014;81:1360–1374. doi: 10.1016/j.neuron.2014.02.010. [DOI] [PMC free article] [PubMed] [Google Scholar]
- Lucas G, Compan V, Charnay Y, Neve RL, Nestler EJ, Bockaert J, Barrot M, Debonnel G. Frontocortical 5-HT4 receptors exert positive feedback on serotonergic activity: viral transfections, subacute and chronic treatments with 5-HT4 agonists. Biol Psychiatry. 2005;57:918–925. doi: 10.1016/j.biopsych.2004.12.023. [DOI] [PubMed] [Google Scholar]
- Mahmood T, Silverstone T. Serotonin and bipolar disorder. J Affect Disord. 2001 doi: 10.1016/s0165-0327(00)00226-3. [DOI] [PubMed] [Google Scholar]
- Di Martino A, Scheres A. Functional connectivity of human striatum: a resting state FMRI study. Cereb Cortex. 2008;18:2735–2747. doi: 10.1093/cercor/bhn041. [DOI] [PubMed] [Google Scholar]
- Mayberg HS, Lozano AM, Voon V, McNeely HE, Seminowicz D, Hamani C, Schwalb JM, Kennedy SH. Deep brain stimulation for treatment-resistant depression. Neuron. 2005;45:651–660. doi: 10.1016/j.neuron.2005.02.014. [DOI] [PubMed] [Google Scholar]
- McCabe C, Mishor Z. Antidepressant medications reduce subcortical–cortical resting-state functional connectivity in healthy volunteers. Neuroimage. 2011;57:1317–1323. doi: 10.1016/j.neuroimage.2011.05.051. [DOI] [PMC free article] [PubMed] [Google Scholar]
- Meneses A. 5-HT system and cognition. Neurosci Biobehav Rev. 1999;23:1111–1125. doi: 10.1016/s0149-7634(99)00067-6. [DOI] [PubMed] [Google Scholar]
- Meneses A, Liy-Salmeron G. Serotonin and emotion, learning and memory. Rev Neurosci. 2012;23:543–553. doi: 10.1515/revneuro-2012-0060. [DOI] [PubMed] [Google Scholar]
- Michelsen K, Schmitz C, Steinbusch H. The dorsal raphe nucleus—from silver stainings to a role in depression. Brain Res Rev. 2007;55:329–342. doi: 10.1016/j.brainresrev.2007.01.002. [DOI] [PubMed] [Google Scholar]
- Moussa M, Steen M, Laurienti P, Hayasaka S. Consistency of network modules in resting-state FMRI connectome data. PLoS One. 2012;7:e44428. doi: 10.1371/journal.pone.0044428. [DOI] [PMC free article] [PubMed] [Google Scholar]
- Müller CP, Homberg JR. The role of serotonin in drug use and addiction. Behav Brain Res. 2014:1–47. doi: 10.1016/j.bbr.2014.04.007. [DOI] [PubMed] [Google Scholar]
- Nielsen K, Brask D, Knudsen GM, Aznar S. Immunodetection of the serotonin transporter protein is a more valid marker for serotonergic fibers than serotonin. Synapse. 2006;59:270–6. doi: 10.1002/syn.20240. [DOI] [PubMed] [Google Scholar]
- Paul-Savoie E, Potvin S, Daigle K, Normand E, Corbin JF, Gagnon R, Marchand S. A deficit in peripheral serotonin levels in major depressive disorder but not in chronic widespread pain. Clin J Pain. 2011;27:529–534. doi: 10.1097/AJP.0b013e31820dfede. [DOI] [PubMed] [Google Scholar]
- Peyron C, Petit JM, Rampon C, Jouvet M, Luppi PH. Forebrain afferents to the rat dorsal raphe nucleus demonstrated by retrograde and anterograde tracing methods. Neuroscience. 1998;82:443–468. doi: 10.1016/s0306-4522(97)00268-6. [DOI] [PubMed] [Google Scholar]
- Pizzagalli Da. Frontocingulate dysfunction in depression: toward biomarkers of treatment response. Neuropsychopharmacology. 2011;36:183–206. doi: 10.1038/npp.2010.166. [DOI] [PMC free article] [PubMed] [Google Scholar]
- Portas CM, Bjorvatn B, Ursin R. Serotonin and the sleep/wake cycle : special emphasis on microdialysis studies. Prog Neurobiol. 2000;60:12–35. doi: 10.1016/s0301-0082(98)00097-5. [DOI] [PubMed] [Google Scholar]
- Prieto-Gómez B, Dafny N, Reyes-Vázquez C. Dorsal raphe stimulation, 5-HT and morphine microiontophoresis effects on noxious and nonnoxious identified neurons in the medial thalamus of the rat. Brain Res Bull. 1989;22:937–943. doi: 10.1016/0361-9230(89)90003-8. [DOI] [PubMed] [Google Scholar]
- Reyes-Vazquez C, Qiao JT, Dafny N. Nociceptive responses in nucleus parafascicularis thalami are modulated by dorsal raphe stimulation and microiontophoretic application of morphine and serotonin. Brain Res Bull. 1989;23:405–411. doi: 10.1016/0361-9230(89)90181-0. [DOI] [PubMed] [Google Scholar]
- Riad M, Wu C, Cornea-he V, Singh SK, Descarries L. Cellular and Subcellular Distribution of the Serotonin 5-HT2A Receptor in the Central Nervous System of Adult Rat. J Comp Neurol. 1999;409:187–209. doi: 10.1002/(sici)1096-9861(19990628)409:2<187::aid-cne2>3.0.co;2-p. [DOI] [PubMed] [Google Scholar]
- Robinson S, Basso G, Soldati N. A resting state network in the motor control circuit of the basal ganglia. BMC Neurosci. 2009;10:1–14. doi: 10.1186/1471-2202-10-137. [DOI] [PMC free article] [PubMed] [Google Scholar]
- Robinson S, Soldati N, Basso G. A resting state network in the basal ganglia. Proc. Int. Soc. Magn. Reseonance Med; Toronto. 2008. p. 746. [Google Scholar]
- Schain M, Tóth M, Cselényi Z. Improved mapping and quantification of serotonin transporter availability in the human brainstem with the HRRT. Eur J Med Mol Imaging. 2013;40:228–237. doi: 10.1007/s00259-012-2260-3. [DOI] [PubMed] [Google Scholar]
- Schöpf V, Kasess C. Fully exploratory network ICA (FENICA) on resting-state fMRI data. J Neurosci Methods. 2010;192:207–213. doi: 10.1016/j.jneumeth.2010.07.028. [DOI] [PubMed] [Google Scholar]
- Ségonne F, Dale AM, Busa E, Glessner M, Salat D, Hahn HK, Fischl B. A hybrid approach to the skull stripping problem in MRI. Neuroimage. 2004;22:1060–1075. doi: 10.1016/j.neuroimage.2004.03.032. [DOI] [PubMed] [Google Scholar]
- Ségonne F, Pacheco J, Fischl B. Geometrically accurate topology-correction of cortical surfaces using nonseparating loops. IEEE Trans Med Imaging. 2007;26:518–529. doi: 10.1109/TMI.2006.887364. [DOI] [PubMed] [Google Scholar]
- Sharp T, Boothman L, Raley J, Quérée P. Important messages in the —post : recent discoveries in 5-HT neurone feedback control. Trends Pharmacol Sci. 2007;28:629–636. doi: 10.1016/j.tips.2007.10.009. [DOI] [PubMed] [Google Scholar]
- Shima K, Nakahama H, Yamamoto M. Firing Properties of Two Types of Nucleus Raphe Dorsalis Neurons during the Sleep-Waking Cycle and Their Responses to Sensory Stimuli Recording procedures Fourteen adult cats were anesthetized with Nem- Data analysis was done for 3 behavioral states. 1986;399:317–326. doi: 10.1016/0006-8993(86)91522-2. [DOI] [PubMed] [Google Scholar]
- Smith SM, Fox PT, Miller KL, Glahn DC, Fox PM, Mackay CE, Filippini N, Watkins KE, Toro R, Laird AR, Beckmann CF. Correspondence of the brain’s functional architecture during activation and rest. Proc Natl Acad Sci U S A. 2009;106:13040–13045. doi: 10.1073/pnas.0905267106. [DOI] [PMC free article] [PubMed] [Google Scholar]
- Steinbusch HWM, Van der Kooy D, Verhofstad AAJ, Pellegrino A. Serotonergic and non-serotonergic projections from the nucleus raphe dorsalis to the caudate-putamen complex in the rat, studied by a combined immunofluorescence and fluorescent retrograde axonal labeling technique. Neurosci Lett. 1980;19:137–142. doi: 10.1016/0304-3940(80)90184-6. [DOI] [PubMed] [Google Scholar]
- Sullivan GM, Oquendo Ma, Simpson N, Van Heertum RL, Mann JJ, Parsey RV. Brain serotonin1A receptor binding in major depression is related to psychic and somatic anxiety. Biol Psychiatry. 2005;58:947–954. doi: 10.1016/j.biopsych.2005.05.006. [DOI] [PubMed] [Google Scholar]
- Sureau FC, Reader AJ, Comtat C, Leroy C, Ribeiro MJ, Buvat I, Trébossen R. Impact of image-space resolution modeling for studies with the high-resolution research tomograph. J Nucl Med. 2008;49:1000–1008. doi: 10.2967/jnumed.107.045351. [DOI] [PubMed] [Google Scholar]
- Tagliazucchi E, Laufs H. Decoding wakefulness levels from typical fMRI resting-state data reveals reliable drifts between wakefulness and sleep. Neuron. 2014;82:695–708. doi: 10.1016/j.neuron.2014.03.020. [DOI] [PubMed] [Google Scholar]
- Vertes R, Linley S. Comparison of projections of the dorsal and median raphe nuclei, with some functional considerations. Int Congr Ser. 2007;1304:98–120. [Google Scholar]
- Vertes R, Linley S. Efferent and afferent connections of the dorsal and median raphe nuclei in the rat. In: Monti JM, Pandi-Perumal SR, Jacobs BL, Nutt DJ, editors. Serotonin and Sleep: Molecular, Functional and Clinical Aspects. Birkhäuser; Verlag/Switzerland: 2008. pp. 69–102. [Google Scholar]
- Vertes RP. A PHA-L analysis of ascending projections of the dorsal raphe nucleus in the rat. J Comp Neurol. 1991;313:643–668. doi: 10.1002/cne.903130409. [DOI] [PubMed] [Google Scholar]
- Vertes RP. Differential projections of the infralimbic and prelimbic cortex in the rat. Synapse. 2004;51:32–58. doi: 10.1002/syn.10279. [DOI] [PubMed] [Google Scholar]
- Wang QP, Nakai Y. The dorsal raphe: an important nucleus in pain modulation. Brain Res Bull. 1994;34:575–585. doi: 10.1016/0361-9230(94)90143-0. [DOI] [PubMed] [Google Scholar]
- Warden MR, Selimbeyoglu A, Mirzabekov JJ, Lo M, Thompson KR, Kim SY, Adhikari A, Tye KM, Frank LM, Deisseroth K. A prefrontal cortex-brainstem neuronal projection that controls response to behavioural challenge. Nature. 2012;492:428–32. doi: 10.1038/nature11617. [DOI] [PMC free article] [PubMed] [Google Scholar]
- Wiklund L, Léager L, Persson M. Monoamine cell distribution in the cat brain stem. A fluorescence histochemical study with quantification of indolaminergic and locus coeruleus cell groups. J Comp Neurol. 1981;203:613–647. doi: 10.1002/cne.902030405. [DOI] [PubMed] [Google Scholar]
- Woods RP, Cherry SR, Mazziotta JC. Rapid automated algorithm for aligning and reslicing PET images. J Comput Assist Tomogr. 1992;16:620–633. doi: 10.1097/00004728-199207000-00024. [DOI] [PubMed] [Google Scholar]
Associated Data
This section collects any data citations, data availability statements, or supplementary materials included in this article.