

Abstract
Wool fiber diameter (WFD) is the most important economic trait of wool. However, the genes specifically controlling WFD remain elusive. In this study, the expression profiles of skin from two groups of Gansu Alpine merino sheep with different WFD (a super-fine wool group [FD = 18.0 ± 0.5 μm, n= 3] and a fine wool group [FD=23.0±0.5μm, n=3]) were analyzed using next-generation sequencing–based digital gene expression profiling. A total of 40 significant differentially expressed genes (DEGs) were detected, including 9 up-regulated genes and 31 down-regulated genes. Further expression profile analysis of natural antisense transcripts (NATs) showed that more than 30% of the genes presented in sheep skin expression profiles had NATs. A total of 7 NATs with significant differential expression were detected, and all were down-regulated. Among of 40 DEGs, 3 DEGs (AQP8, Bos d2, and SPRR) had significant NATs which were all significantly down-regulated in the super-fine wool group. In total of DEGs and NATs were summarized as 3 main GO categories and 38 subcategories. Among the molecular functions, cellular components and biological processes categories, binding, cell part and metabolic process were the most dominant subcategories, respectively. However, no significant enrichment of GO terms was found (corrected P-value >0.05). The pathways that were significantly enriched with significant DEGs and NATs were mainly the lipoic acid metabolism, bile secretion, salivary secretion and ribosome and phenylalanine metabolism pathways (P < 0.05). The results indicated that expression of NATs and gene transcripts were correlated, suggesting a role in gene regulation. The discovery of these DEGs and NATs could facilitate enhanced selection for super-fine wool sheep through gene-assisted selection or targeted gene manipulation in the future.
Introduction
Fine wool sheep, also called Merino, is a world famous sheep breed that is known to produce high-quality fine wool. Fine wool sheep are distributed primarily in Australia, China, New Zealand, South Africa, Uruguay, Argentina and other countries[1]. Wool fiber diameter(WFD) is the most important economic trait of merino sheep and determines 75% of the value of wool fibers. The WFD variation-induced profit accounted for 61% of the total profits of wool [2, 3]. Wool is formed from keratinocytes derived from a progenitor population at the base of the hair follicle(HF)[4]. The morphogenesis and growth of HF in sheep has been extensively studied since the 1950’s and the developmental processes at the cellular level are reasonably well understood [5–7]. Dermal papilla (DP) cells are a population of mesenchymal cells at the base of the HF[8], and provide signals that contribute to specifying the size, shape and pigmentation of the wool[9]. It is well known that WFD is significantly associated with size of DP and matrix in mammals [4, 6, 10–17], and is largely specified post-initiation, during the period of HFs growth and morphogenesis[18]. To illustrate the molecular mechanisms of controlling WFD, the expression profiles of different stage of fetal and adult sheep skin have also been generated by sequencing of expressed sequence tags (ESTs) and cDNA microarray [19, 20]. However, the size of DP and matrix in mammals is also markedly influenced by genetic[10, 11, 21], physiological[13], nutrition[22], hormones[12] during the anagen phase of the hair cycle. Up to now, there are no studies on the molecular mechanisms of controlling WFD during the anagen phase, and the genes specifically controlling WFD remain elusive [23].
Knowledge of the genes controlling development of DP and matrix come from studies of the morphogenesis and cycle of HF of mice and human[24–28], It involves a series of signaling between the matrix and the dermal papill, such as Wnt/beta-catenin, EDA/EDAR/NF-κB, Noggin/Lef-1, Ctgf/Ccn2, Shh, BMP-2/4/7, Dkk1/Dkk4 and EGF[4, 29]. The mutation, epigenetic modification and post-translational modification of any ligand or receptors in these pathways maybe affect WFD [30, 31]. Therefore, in addition to the current efforts on protein-encoding genes, the attention should also be paid to a novel regulatory factor, non-coding RNA (ncRNA), such as micro RNA, long non-coding RNA and natural antisense transcripts (NATs)[32]. Among these ncRNAs, NATs are not only large in quantity but also play important roles in gene expression regulation in organisms [33]. NATs refer to a class of non-coding RNAs that are produced inside organisms under natural conditions and are expressed in many species [34–36]. NATs play an important role in transcript regulation at the mRNA and/or protein levels and in regulating various physiological and pathological processes, such as organ formation, cell differentiation and disease [37, 38]. However, the roles of NATs in controlling WFD have not been described.
The next-generation sequencing (NGS)-based digital gene expression (DGE) profiling technologies developed in recent years constitute a revolutionary change in traditional transcriptome technology. Compared with ESTs and cDNA microarray, the strength of DGE profiling is that it is an "open system" and has better capability to discover and search for new information, providing a new way to identify novel genes and NATs that specifically control WFD [39]. However, the success or effectiveness of the search is largely dependent on the completeness and stitching quality of the genome sequences of the species studied [40]. It is exciting that the International Sheep Genomics Consortium (ISGC) has achieved initial success in assembling the reference sheep genome. The total length of the assembled genome, Sheep Genome v3.1, has reached 2.64 Gb, with only 6.9% gaps [41]. Needless to say, the release of a high-quality sheep genome reference sequence provides important resources for using NGS to study the skin transcriptome of sheep with different WFD and find genes and NATs that specifically control WFD [42, 43].
In this study, NGS-based DGE profiling was conducted to analyze the differentially expressed genes (DEGs) and NATs in the skin of Gansu Alpine fine wool sheep with different WFD. A total of 47 significant DEGs and NATs were detected, including 9 up-regulated genes, 31 down-regulated genes and 7 down-regulated NATs. These DEGs and NATs may be useful in further study on molecular markers of controlling WFD in fine wool sheep.
Results
Sequencing and assembly
NGS was performed on 6 individuals of the super fine wool group (sample nos.65505,65530,65540;n = 3) and the fine wool group (sample nos.5Y127,5Y212,5Y339;n = 3), and raw data greater than 5 Mb were obtained for all individuals (Table 1), submitted to the NCBI BioProject database, with the accession number PRJNA274817. There was a 3' adaptor sequence in the raw data, along with small amounts of low-quality sequences and various impurities. Impurity data were removed from the raw data, and clean tags greater than 4.7 Mb were obtained. The distinct tag number of each individual was greater than 0.11 Mb (Table 1).
Table 1. Summary of tag numbers based on the DGE data from Gansu Alpine fine wool sheep skin with different WFD.
| Sample ID | Raw Data | Clean Tag | ||
|---|---|---|---|---|
| Total number | Distinct Tag number | Total number | Distinct Tag number | |
| 5Y127 | 5259561 | 355014 | 4917435 | 119886 |
| 5Y212 | 5364832 | 350472 | 5033144 | 117880 |
| 5Y339 | 5145452 | 336695 | 4857460 | 120525 |
| 65505 | 5244848 | 314710 | 4930422 | 110879 |
| 65530 | 5485701 | 343795 | 5184375 | 117642 |
| 65540 | 5282704 | 373209 | 4941669 | 143800 |
The sheep genome reference sequence database includes 19,346 gene sequences, including 18,940 genes with "CATG" loci and accounting for 97.90% of the total number of genes. The total number of reference tags in the reference tag database is 173,207, including 169,843 unambiguous reference tags, accounting for 98.06% of the total number of tags. All clean tags were compared with reference genes and reference genomes, and the results indicated that 87.45%, 87.32%, 88.63%, 88.97%, 88.72% and 87.38% of the total numbers of clean tags of the 6 individuals from two groups (sample nos. 5Y127, 5Y212, 5Y339, 65505, 65530,and 65540, the same hereinafter), respectively, could be matched to the reference tags; of these, 49.05%, 50.26%, 51.86%, 52.41%, 51.48% and 50.37% of the clean tags could be uniquely located in the reference sequences (sense and antisense), and the ratios of distinct tag were 36.00%, 36.63%, 37.64%, 36.61%, 37.33% and 33.22% (Table 2), respectively; the numbers of unambiguous tag-mapped genes were 10,391, 10,209, 10,666, 10,434, 10,137, 10,298,10763 and 9,965, respectively. (Table 2) These uniquely located sequences indicated that the key genes that regulate the WFD may exist in genes expressed in the individuals with different WFD.
Table 2. Summary of unambiguous tag mapping to gene and unambiguous tag-mapped genes (sense & anti-sense).
| Sample ID | Unambiguous Tag Mapping to Gene | Unambiguous Tag-mapped Genes | ||||
|---|---|---|---|---|---|---|
| Total number | Total % of clean tag | Distinct Tag number | Distinct Tag % of clean tag | number | % of ref genes | |
| 5Y127 | 2412224 | 49.05% | 43158 | 36.00% | 10391 | 53.71% |
| 5Y212 | 2529818 | 50.26% | 43175 | 36.63% | 10209 | 52.77% |
| 5Y339 | 2519260 | 51.86% | 45369 | 37.64% | 10666 | 55.13% |
| 65505 | 2583990 | 52.41% | 40595 | 36.61% | 10434 | 53.93% |
| 65530 | 2668978 | 51.48% | 43910 | 37.33% | 10137 | 52.40% |
| 65540 | 2489004 | 50.37% | 47775 | 33.22% | 10298 | 53.23% |
There were a large number of possible unknown tags that are in the gene expression profile libraries of these six individuals. Accounting for 12.55% (617,198), 12.68% (638,292), 11.37% (552,279), 11.03% (543,900), 11.28% (585,017) and 12.62% (623,705) of the total number of clean tags were unannotated, respectively; the proportions of distinct tag number of unknown tag were 18.77% (22,503),18.79% (22,152),16.17% (19,493),18.02% (19,975),17.25% (20,292) and 20.43% (29,382), respectively. These results suggested that there were many unknown genes in sheep skin tissue that may also play important roles in the regulation of HF development and wool growth.
Analysis of the expression profiling of NATs
Sense-antisense regulation is an important method for controlling gene expression. If the clean tags can be matched to the antisense strand of the gene, then it suggests that there are also transcripts for the antisense strand of this gene and that this gene may be subjected to sense-antisense regulation [44]. In the present study, we found that in the gene expression profiling libraries of the 6 individuals of the two groups, the percentages of genes with antisense transcripts were, respectively, 5.83%, 6.01%, 5.91%, 5.84%, 6.00% and 6.20% of the total numbers of the genes in the library, including 247,816 (5.04%), 262,353 (5.21%), 249,595 (5.14%), 247,940 (5.03%), 266,926 (5.15%) and 265,599 (5.37%) tags that could be exactly matched, respectively (Table 3); the number of tag species accounted for, respectively, 13.31%, 13.31%, 13.46%, 13.20%, 13.65% and 11.94% of the total numbers of tag species in the expression profile libraries of the 6 individuals from the 2 groups, including 15,192 (12.67%), 14,966 (12.70%), 15,483 (12.85%), 13,957 (12.59%), 15,289 (13.00%) and 16,346 (11.37%) tag species that could be exactly matched, respectively(Table 3); there were 6472 (33.45%), 6398 (33.07%), 6585 (34.04%), 6227 (32.19%), 6346 (32.80%) and 6758 (34.93%) genes with NATs in the gene expression profiles of the 6 individuals of the 2 groups (Table 3). The sense-antisense transcript ratios of all 6 expression profile libraries exhibited similar trends. The ratios between the tag number, distinct tag number and tag-mapped genes of sense and antisense transcripts were 10:1, 2:1 and 5:3, respectively; the spearman r between the sense and antisense transcripts expression were 0.533 ~ 0.557.
Table 3. Summary of unambiguous tag mapping to anti-sense genes and unambiguous tag-mapped anti-sense genes.
| Sample ID | Unambiguous tag mapping to anti-sense genes | Unambiguous tag-mapped anti-sense genes | ||||
|---|---|---|---|---|---|---|
| Total number | Total % of clean tag | Distinct Tag number | Distinct Tag % of clean tag | number | % of ref genes | |
| 5Y127 | 247816 | 5.04% | 15192 | 12.67% | 6472 | 33.45% |
| 5Y212 | 262353 | 5.21% | 14966 | 12.70% | 6398 | 33.07% |
| 5Y339 | 249595 | 5.14% | 15483 | 12.85% | 6585 | 34.04% |
| 65505 | 247940 | 5.03% | 13957 | 12.59% | 6227 | 32.19% |
| 65530 | 266926 | 5.15% | 15289 | 13.00% | 6346 | 32.80% |
| 65540 | 265599 | 5.37% | 16346 | 11.37% | 6758 | 34.93% |
Detection of DEGs, NATs and validation
The clean tags of all six individuals were aligned with the reference tag database, allowing a maximum of one base mismatch. Unambiguous tags were annotated, and the number of raw clean tags that corresponded to the same gene was counted and then standardized to obtain the standardized expression level of each gene in the skin transcriptome of the 6 individuals. Noiseq software was used to select DEGs, NATs that exhibited different expression levels between S and F group. However, there were only 47 significant DEGs and NATs (log2Ratio (S/F)≥1, q-value≥0.8).9 genes were up-regulated, 31 genes and all 7 NATs were down-regulated (Table 4, Fig 1). Among the down-regulated genes, NT5C3L (Gene ID 101109197) showed the greatest expression difference (log2Ratio(S/F) = –10.59,q value = 0.89); among the up-regulated genes, CCNA2 (Gene ID 100144758) showed the greatest expression difference (log2Ratio(S/F) = 6.04, q value = 0.83). 38 significant expression genes had NATs, and only 2 had no found antisense transcripts: CCNA2 (Gene ID: 100144758) and prolactin-inducible protein homolog (Gene ID: LOC101114011).3 significant DEGs (AQP8, Gene ID: 101108013;Bos d2,Gene ID:101116281, and SPRR,Gene ID: 443313) had significant NATs. All 3 of these genes and their NATs were significantly down-regulated in the super-fine wool group (Table 4).10 DEGs, NATs were used to validate selected differentially expressed transcripts identified from DGE profiling by Real-time PCR. The results from the real-time PCR confirmed the expression pattern of DGEs and NATs at two different groups in Gansu Alpine fine wool sheep.
Table 4. Summary of DEGs and NATs between two groups.
| Kinds of Transcriptes | GeneID | log2Ratio(S/F) | Probability | Symbol |
|---|---|---|---|---|
| DEGs | 101109197 | -10.5912106 | 0.886583566 | NT5C3L |
| 101116281 | -7.40151954 | 0.969520529 | LOC101116281 | |
| 101120858 | -4.57602606 | 0.868500902 | LOC101120858 | |
| 443313 | -4.45466762 | 0.848327046 | Small proline-rich | |
| 101109718 | -4.16402747 | 0.835055492 | CA4 | |
| 101108013 | -4.13509115 | 0.838991854 | AQP8 | |
| 101118004 | -3.99924015 | 0.86634137 | LOC101118004 | |
| 101115395 | -3.90149163 | 0.829820677 | PGLYRP1 | |
| 101114011 | -3.8813167 | 0.855789733 | LOC101114011 | |
| 101107368 | -3.8266707 | 0.827278443 | SLC25A35 | |
| 101104026 | -3.72227757 | 0.855311355 | S100A8 | |
| 101115563 | -3.4495271 | 0.829328632 | ABCC11 | |
| 101109387 | -3.38125687 | 0.87068777 | GLYATL2 | |
| 101106121 | -3.3527916 | 0.870715106 | LOC101106121 | |
| 101115336 | -3.29504885 | 0.839237877 | DNASE1L2 | |
| 101116409 | -3.16407151 | 0.86568531 | LOC101116409 | |
| 101113168 | -3.1562348 | 0.826690722 | LOC101113168 | |
| 100137068 | -2.97890634 | 0.857115521 | LOC100137068 | |
| 101116799 | -2.80442661 | 0.859794434 | LOC101116799 | |
| NM_001009395.1 | -2.67922661 | 0.847588978 | - | |
| 101102714 | -2.61084761 | 0.822795364 | LOC101102714 | |
| 101102540 | -2.3882578 | 0.861489257 | RPL39 | |
| 101102697 | -2.14152458 | 0.81083593 | DNAJC12 | |
| 101108654 | -2.10679611 | 0.847930676 | LOC101108654 | |
| 101116537 | -1.89220493 | 0.803933629 | LOC101116537 | |
| 101121216 | -1.86897593 | 0.842094473 | LOC101121216 | |
| 101112716 | -1.85095925 | 0.834194413 | KRT7 | |
| 101121307 | -1.5666126 | 0.800489312 | ACSM3 | |
| 101111121 | -1.46170294 | 0.809141108 | CD82 | |
| 101114256 | -1.40678444 | 0.802238806 | ACTG2 | |
| 101109430 | -1.32738037 | 0.80115904 | KRT1 | |
| 101105583 | 1.377957974 | 0.802293478 | GSDMA | |
| 101110063 | 1.491887466 | 0.816426111 | HSPA2 | |
| 100135694 | 1.587840025 | 0.830968782 | RPS27A | |
| 443218 | 1.679295263 | 0.826485703 | FOS | |
| 101113964 | 1.819875496 | 0.838185446 | PDCD6IP | |
| 101119862 | 2.058276167 | 0.826212345 | LIPK | |
| 101120443 | 2.31282643 | 0.827415122 | LOC101120443 | |
| 101105188 | 4.991770667 | 0.839825597 | DAP | |
| 100144758 | 6.03994716 | 0.834235416 | CCNA2 | |
| NATs | 101116281 | -9.15903036 | 0.941608145 | Bos d2 |
| 443313 | -7.587465008 | 0.819808271 | SPRR | |
| 101108013 | -7.807354922 | 0.844108795 | AQP8 | |
| 101120353 | -5.685396543 | 0.88975588 | major allergen I polypeptide chain 2-like | |
| 101120550 | -6.896227669 | 0.975067811 | SMC1A | |
| 101113086 | -9.556506055 | 0.957344034 | primary amine oxidase | |
| 101113693 | -8.661778098 | 0.914297923 | ABP |
Fig 1. The numbers of DEGs between two groups.

Between two groups, there were 9 upregulated genes and 31 downregulated genes and 7 NATs.
Gene ontology (GO), Kyoto Encyclopedia of Genes and Genomes (KEGG) and other databases were used for the functional analysis and signaling pathway annotations of these DGEs and NATs. Among all of the significant DEGs and NATs, 44 genes were annotated, and 3 genes located in the genome could not be annotated effectively. In total of 47 DEGs and NATs were summarized as three main GO categories and 38 subcategories (Fig 2). Among the molecular functions category, the top three were involved in binding and catalytic activity. Regarding cellular components, cell part, cell, organelle, membrane, organelle parts were the dominant groups. Within biological processes category, metabolic process and cellular process were the most dominant group. However, no significant enrichment of GO terms was found (corrected P-value >0.05). The pathways that were significantly enriched with significant DEGs and NATs were mainly the lipoic acid metabolism, bile secretion, salivary secretion and ribosome and phenylalanine metabolism pathways (P < 0.05).
Fig 2. GO functional analysis of DEGs and NATs.
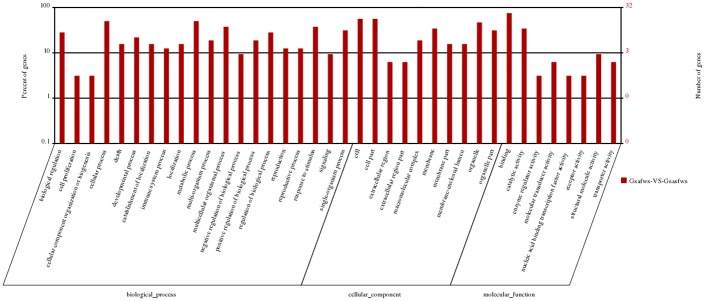
The results were summarized in three main categories: biological process, cellular component and molecular function. Among these groups, the terms binding, cell part and metabolic process were dominant in each of the three main categories, respectively.
Discussion
Wool is produced via synthetic processes by HFs, which are embedded in the skin of sheep [45]. There are two types of HFs, named primary HF and secondary HF, which are different in appearance and function. Secondary HFs of the fine wool sheep are the main hair follicle and are critical determinants of mean fiber diameter and other wool characteristics. WFD is highly correlated with the size of DP of HF [17], whose origin can be traced to the dermal condensate, one of the earliest features of the developing HF[19]. The charactering of the molecular controls of HF initiation, morphogenesis, branching and growth can facilitate enhanced selection for new sheep breeds with lower WFD [20]. In order to understand the molecular mechanisms of controlling WFD, Adelson et al. (2004) constructed three cDNA libraries from fetal and adult sheep skin, obtained 2,345 noredundant EST sequences and identified 61 ESTs expressed in the adult HF, which constituted a high priority candidate gene subset for further work aimed at identifying genes useful as selection markers or as targets for genetic engineering[19]. Norris et al. (2005) found 50 up- and 82 down-regulated genes with increased fetal and inguinal expression relative to adult by compared skin gene expression profiles between fetal day 82, day 105, day 120 and adult HF anagen stage using a combined ovine–bovine skin cDNA microarray[20]. However, comparing to sequencing of expressed sequence tags (ESTs) and cDNA microarray, DGE profiling has many unique advantages [46, 47]. It is highly accurate and has a very low detection limit, giving it a very wide range of applications[48],such as detection of new transcripts [49],functional research of non-coding RNA [50, 51]. In this study, six DGE profiling were conducted to analyze the DEGs and NATs in the skin of Gansu Alpine fine wool sheep with different WFD at the same age, gender, and nutrition level during the anagen. More than 4.7 Mb of clean tags were obtained for each sheep, with more than 0.11 Mb of distinct tags. A total of 47 significant DEGs and NATs were detected, including 9 up-regulated genes, 31 down-regulated genes and 7 down-regulated NATs.
The HF comprises several concentric epithelial structures[29]. Wool fiber is enveloped by two epithelial sheaths, known as the inner root sheath (IRS) and the outer root sheath (ORS). At the distal end of the HF, IRS cells undergo apoptosis and liberate the wool fiber [29, 52]. ORS cells contain proliferating cells derived from stem cells in the bulge that feed into the matrix compartment of the bulb[53]. The matrix is a proliferative zone located at the proximal end of the HF surrounding the DP [52]. During the anagen phase, the DP cells are thought to direct the matrix cells to proliferate and differentiate into the multiple cell types that form the wool fiber and its channel, the IRS [9]. During postnatal life, hair follicles show patterns of cyclic activity with periods of active growth and hair production (anagen), apoptosis-driven involution (catagen), and relative resting (telogen) [53–55]. However, Merino HFs are predominantly in anagen throughout growth, different to many animals such as the mouse, rabbit, and guinea-pig [30]. It is also well known that WFD is significantly associated with sizes of DP and matrix in mammals [4, 6, 10–17],which are markedly influenced by genetic[10, 11, 21], physiological[13],nutrition[22], hormones[12] during the anagen phase of the hair cycle. However, the genes specifically controlling the size of DP and matrix remain elusive. In the present study, the up-regulated genes in the super fine wool group included 5 genes associated with the cell cycle and apoptosis: GSDMA3 [56], HSPA2 [57], RPS27A [58], PDCD6IP [59], DAP[60], CCNA2 [61] and FOS[62]; the down-regulated genes included 7 genes associated with promoting follicle cell proliferation and differentiation: KRT1 [63, 64], KRT7 [65, 66], HSD11B1 [67, 68], S100A8 [41, 69, 70], NT5C3 L[71] and DNAJC12 [72]. These genes may through promoting HF cell apoptosis, inhibiting follicle cell proliferation and differentiation, thereby reduce the WFD.
White adiposities, dermal fibroblasts, smooth muscle and endothelial cells of the vasculature, neurons and resident immune cells also surround the HFs in the skin. Recent studies show that the growth of wool fiber is not only affected by the proliferation and differentiation of follicular cells but is also affected by other cells around the follicle [73, 74]. The layer of intradermal adipocytes expands as the HF enters its anagen stage and then thins during telogen [75, 76]. FATP4-/-, Dgat1-/-, or Dgat2-/- Early B cell factor 1 (Ebf1-/-) mice have decreased intradermal adipose tissue due to defects in lipid accumulation in mature adipocytes [77–79]. Interestingly, these mice also display abnormalities in skin structure and function, such as hair loss and epidermal hyperplasia. In the present study, in the super fine wool group, it was also determined that the genes related to fat synthesis (ABCC11[80], GLYATL2 [81], and ACSM3 [82]) were significantly down-regulated and that LIPK, which is involved in lipolysis, was significantly up-regulated [83].
Genes with NATs are very common in animal and plant genomes, accounting for 7% to 9% of transcripts in plants and 5% to 30% of transcripts in animals, except for nematodes [84]. The present study indicated that more than 30% of the genes had NATs, which is consistent with the findings of the above mentioned studies. In the present study, correlation analysis was conducted on the sense and antisense transcripts in the DGEs of skin, and the results showed that the correlation coefficients between the sense and antisense transcripts were between 0.533 and 0.557, indicating that the WFD maybe were regulated by both sense and antisense transcripts. NATs regulate sense transcripts through positive or negative feedback by forming a sense-antisense bidirectional structure [85]. In this study, 3 out of 40 significantly differentially expressed genes had significantly different NATs: AQP8, Bos d2, and SPRR (type II small proline-rich protein). AQP8 belongs to the aquaporin subfamily of the AQP family [86]; it is located mainly in a variety of tissues and on the surfaces of acinar cells in various glands and plays important roles in gland secretion and the transportation of water, urea, ammonia and hydrogen peroxide [87–90]. Bos d 2 belongs to the lipocalin family of proteins[91]. In the skin sections, Bos d2 was found in the secretory cells of apocrine sweat glands and the basement membranes of the epithelium and HF[92]. It is assumed that Bos d2 is a pheromone carrier.[92]. The SPRR proteins comprise a subclass of specific cornified envelope precursors encoded by a multigene family clustered within the epidermal differentiation complex region [93]. Two SPRR1, seven SPRR2, one SPRR3 and one SPRR4 genes are located within a 300-kb area of the EDC[94, 95] and are expressed in the epidermis, HFs and capillaries [96, 97]. Several studies have suggested that the SPRRs are related to increased epithelial proliferation and to malignant processes[98]. Other than functioning as structural proteins, SPRRs also regulate gene expression levels, inhibit cell proliferation and promote differentiation [99]. The present study also found that AQP8, Bos d2, SPRR and their antisense transcripts were significantly down-regulated in the super fine wool group, suggesting that AQP8, Bos d2 and SPRR and their antisense transcripts were regulated by positive feedback. However, the mechanism by which AQP8, Bos d2 and SPRR regulate the WFD needs to be further studied.
Materials and Methods
Sheep skin sampling
Gansu Alpine fine wool sheep were bred in the Huang Cheng District of Gansu Province, China, by cross breeding Mongolian or Tibetan sheep with Xinjiang Fine Wool sheep and then with some fine wool sheep breeds from the Union of Soviet Socialist Republics, such as Caucasian sheep and Salsk sheep. The breed was approved by the Gansu provincial government in 1980. Gansu Alpine fine wool sheep were obtained from a sheep stud farm located in Zhangye city, Gansu Province. All experimental and surgical procedures were approved by the Institutional Animal Care and Use Committee, Lanzhou Institute of Husbandry and Pharmaceutical Sciences, Peoples Republic of China. Six unrelated 3 years old ewes at different WFD, and also as different DP size were selected and divided into super fine wool group (S)(WFD = 18.0±0.5μm; Diameter of secondary DP size = 3.2±0.2μm) and fine wool group (F)(WFD = 23.0±0.5μm; Diameter of secondary DP size = 4.1±0.2μm) (Fig 3). A piece of midside skin (2 mm in diameter) was collected via punch skin biopsy under local anesthesia using 1% procaine hydrochloride immediately placed in liquid nitrogen and stored at -80°C for subsequent analysis.
Fig 3. The size of secondary DP cells between two groups.
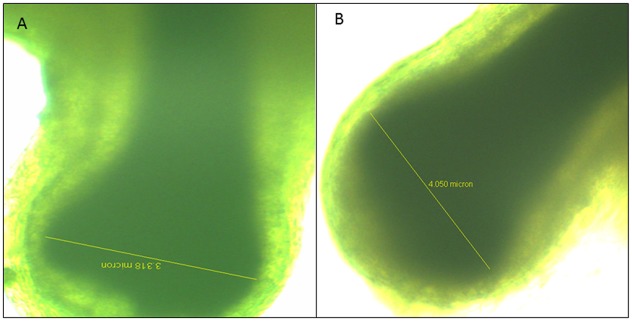
The diameter of super fine wool sheep secondary DP cells = 3.2±0.2μm (A), the diameter of fine wool sheep secondary DP cells = 4.1±0.2μm (B).
Total RNA extraction, library construction and deep sequencing
Total RNA was isolated from the tissues using the RNeasy Maxi Kit (Qiagen, Hilden, GER) according to the manufacturer instructions. RNA quality was verified using a 2100 Bioanalyzer RNA Nanochip (Agilent, Santa Clara, CA, USA), and the RNA Integrity Number (RIN) value was >8.5. Then, the RNA was quantified using the Nano Drop ND-2000 Spectrophotometer (Nano-Drop, Wilmington, DE, USA). Sequence tags were prepared using the Illumina Digital Gene Expression Tag Profiling Kit, according to the manufacturer’s protocol. Sequencing libraries were prepared from 1μg of total RNA using reagents from the NlaIII Digital Gene Expression Tag Profiling kit (Illumina Inc., San Diego, CA, USA). mRNA was captured on magnetic oligo(dT) beads and reverse transcribed into double-stranded cDNA (SuperScript II, Invitrogen, Carlsbad, CA, USA). The cDNA was cleaved using the restriction enzyme NlaIII. An adapter sequence containing the recognition sequence for the restriction enzyme MmeI was ligated to the NlaIII cleavage sites. The adapter-ligated cDNA was digested with MmeI to release the cDNA from the magnetic bead, while leaving 17 bp of sequence in the fragment. The fragments were dephosphorylated and purified by phenol–chloroform. A second adapter was ligated at the MmeI cleavage sites. Adapter-ligated cDNA fragments were amplified by PCR, and after 15 cycles of linear PCR amplification, 95 bp fragments were purified by 6% TBE PAGE gel electrophoresis, denatured and the single-chain molecules were fixed onto the Illumina Sequencing Chip. A single-molecule cluster sequencing template was created through in situ amplification. Nucleotides labeled with different colors were used to perform sequencing by the sequencing by synthesis method; each tunnel can generate millions of raw reads with a sequencing length of 35 bp.
Determination of gene expression levels and detection of DEGs and NATs
Sequencing-received raw image data were transformed by base culling into sequence data, which was called raw data. Raw sequences were transformed into clean tags after removed all low quality tags such as short tags (< 21 nt), empty reads, and singletons (tags that occurred only once). Clean tags were classified according to their copy number (as a percentage of the total number of clean tags) and the saturation of the library was analyzed. All clean tags were mapped to sheep reference sequences(version:Oarv3.1) by SOAP2(version:2.21) with default parameters, and allowing one mismatches. To monitor mapping events on both strands, both sense and complementary antisense sequences were included [100].
A preprocessed database of all possible 17 base-long sequences of Oarv3.1 located next to the NlaIII restriction site was created as the reference tags, and only one mismatch was allowed. Following the common practice, only clean reads that can be uniquely mapped back to the reference tags were considered ("-r 0" option), and those mapped more than one location were discarded. Remainder clean tags were designed as unambiguous clean tags. When multiple types of remainder clean tags were aligned to the different positions of the same gene, the gene expression levels were represented by the summation of all. The number of unambiguous clean tags for each gene was calculated and then normalized to TPM (number of transcripts per million clean tags) = clean tag number corresponding to each gene number of total clean labels in the sample × 1,000,000 [101, 102].
All TPM of 3 samples each group were integrated, and NOISeq (version: 2.8.0) [103]with default parameters, which is a novel nonparametric approach for the identification of DEGs and NATs, was used to detect the differentially expressed transcripts between super fine wool group (S) and fine wool group (F). To measure expression level changes between two groups, NOISeq takes into consideration two statistics: M(the log2-ratio of the two conditions) and D(the absolute value of the difference between conditions). The probability thresholds were P ≥ 0.8 and the TMM value in the lower expressed sample was ≥1. The higher the probability, the greater the change in expression between two groups. Using a probability threshold of 0.8 means that the gene is 4 times more likely to be differentially expressed than non-differentially expressed[104].
Strand-specific real-time quantitative RT-PCR
To confirm the differentially expressed sense and antisense transcripts between super fine wool group and fine wool group, ten genes were randomly selected to verify their expression levels of gene and NATs transcripts in skin by strand-specific qRT-PCR according to the protocol described in Haddad et al. (2007)[105]. Primers for real-time PCR were designed with Primer Express 3.0 (Applied Biosystems) (Table 5). GAPDH was used as a reference control. Real time PCR was performed using SYBR Green master mix (TianGen) on the CFX96 Real-Time System (BioRAD, USA). The reaction was performed using the following conditions: denaturation at 95°C for 3 min, followed by 40 cycles of amplification (95°C for 30s, 60°C for 30s, and 72°C for 30s). Relative expression was calculated using the delta-delta-Ct method.
Table 5. Relevant information of gene and primer sequences for strand-specific RT-PCR.
| Genes name | Primer sequences (5′→3′) | GenBank accession No | Produce size (bp) |
|---|---|---|---|
| Bos d2 | ACAGTAGTGGCACAGAGAGC | XM_004021893.1 | 136 |
| TTGTGGTCTTCTCGCCATCA | |||
| SPRR | CAAAAATGCCCTCCTGTGCC | NM_001009773.1 | 91 |
| CCTGACCAGATAAAAGCTGATGC | |||
| AQP8 | TCATCCTGACGACACTGCTG | XM_004020851.1 | 146 |
| ATTCATGCACGCTCCAGACA | |||
| KRT1 | CCCTGGATGTGGAGATTGCC | XM_004006320.1 | 119 |
| ACTGATGCTGGTGTGACTGG | |||
| KRT7 | ACATCAAGCTGGCTCTGGAC | XM_004006333.1 | 108 |
| CCACAGAGATGTTCACGGCT | |||
| S100A8 | GCTGACGGATCTGGAGAGTG | XM_004002523.1 | 163 |
| GAACCAAGTGTCCGCATCCT | |||
| GAPDH | GCTGAGTACGTGGTGGAGTC | NM_001190390.1 | 136 |
| GGTTCACGCCCATCACAAAC | |||
| AQP8-NAT | CCTTGGGAAATCCTTGCAGC | 137 | |
| GAAAAGCCCGTTGCAGACTC | |||
| Bos d2-NAT | TTGGCGGAAGTATGTCGCAG | 112 | |
| CAGCTCAGCCAGAATCGTCA | |||
| SPRR-NAT | CCATGACCCGCTTTGAAGA | 132 | |
| CAATGCCAGCAGAAGTGCC |
GO and KEGG enrichment analysis of differentially expressed transcripts
Gene ontology (GO), an international standardized gene functional classification system, offers a dynamic-updated controlled vocabulary and strictly defined concept to comprehensively describe the properties of genes and their products in any organism[106]. Kyoto Encyclopedia of Genes and Genomes (KEGG) database is a database resource for understanding functions and utilities of the biological system, such as the cell, the organism and the ecosystem from molecular information, especially for large-scale molecular datasets generated by genome sequencing and other high throughput experimental technologies (http://www.genome.jp/kegg/) [107]. all DEGs and NATs were mapped to GO-terms in GO database, looking for significantly enriched GO terms in DEGs comparing to the genome background GOseq R package(version:1.18.0)[108],while significantly enriched metabolic pathways or signal transduction pathways in DEGs and NATs were identified via pathway enrichment analysis using KEGG, public pathway-related database, and comparing with the whole genome background by KOBAS(version: 2.0)[109].
In all tests, P-values were calculated using Benjamini-corrected modified Fisher’s exact test and ≤0.05 was taken as a threshold of significance. The calculating formula is:
Where N is the number of all genes with GO or KEGG annotation; n is the number of DEGs or NATs in N; M is the number of all genes that are annotated to the certain GO terms or specific pathways; m is the number of DEGs or NATs in M.
Supporting Information
(DOCX)
(DOCX)
Acknowledgments
This work was supported by the Central Level, Scientific Research Institutes for Basic R & D Special Fund Business (Grant no. 1610322015014); the Earmarked Fund for Modern China Wool & Cashmere Technology Research System (Grant no. nycytx-40-3); and the National Natural Science Foundation for Young Scholars of China (Grant no. 31402057).
Data Availability
All relevant data are within the paper and its Supporting Information files.
Funding Statement
This work was supported by the Central Level, Scientific Research Institutes for Basic R & D Special Fund Business (Grant no. 1610322015014); the Earmarked Fund for Modern China Wool & Cashmere Technology Research System (Grant no. nycytx-40-3); and the National Natural Science Foundation for Young Scholars of China (Grant no. 31402057). The funders had no role in study design, data collection and analysis, decision to publish, or preparation of the manuscript.
References
- 1. Galbraith H. Animal fibre: connecting science and production Foreword. Animal. 2010;4(9):1447–50. 10.1017/S1751731110000741 WOS:000281263500001. [DOI] [Google Scholar]
- 2. Liu H, Zhou Z-Y, Malcolm B. China’s Wool Import Demand: Implications for Australia. Australasian Agribusiness Review. 2011;2011(1442–6951):19. [Google Scholar]
- 3. Iman NY, Johnson CL, Russell WC, Stobart RH. Estimation of genetic parameters for wool fiber diameter measures. Journal of animal science. 1992;70(4):1110–5. . [DOI] [PubMed] [Google Scholar]
- 4. Chi W, Wu E, Morgan BA. Dermal papilla cell number specifies hair size, shape and cycling and its reduction causes follicular decline. Development. 2013;140(8):1676–83. 10.1242/dev.090662 [DOI] [PMC free article] [PubMed] [Google Scholar]
- 5. Hardy MH, Lyne AG. The pre-natal development of wool follicles in Merino sheep. Australian Journal of Biological Sciences. 1956;9(9):423–41. [Google Scholar]
- 6. Moore GP, Jackson N, Isaacs K, Brown G. Pattern and morphogenesis in skin. Journal of theoretical biology. 1998;191(1):87–94. 10.1006/jtbi.1997.0567 . [DOI] [PubMed] [Google Scholar]
- 7. Carter HB, Hardy MH. Studies in the biology of the skin and fleece of sheep. Commonwealth of Australia Council for Scientific and Industrial Research. 1947;215(215). [Google Scholar]
- 8. Driskell RR, Clavel C, Rendl M, Watt FM. Hair follicle dermal papilla cells at a glance. Journal of cell science. 2011;124(Pt 8):1179–82. 10.1242/jcs.082446 [DOI] [PMC free article] [PubMed] [Google Scholar]
- 9. Enshell-Seijffers D, Lindon C, Kashiwagi M, Morgan BA. beta-catenin activity in the dermal papilla regulates morphogenesis and regeneration of hair. Developmental cell. 2010;18(4):633–42. 10.1016/j.devcel.2010.01.016 [DOI] [PMC free article] [PubMed] [Google Scholar]
- 10. Moore GP, Jackson N, Lax J. Evidence of a unique developmental mechanism specifying both wool follicle density and fibre size in sheep selected for single skin and fleece characters. Genetical research. 1989;53(1):57–62. . [DOI] [PubMed] [Google Scholar]
- 11. Yano K, Brown LF, Detmar M. Control of hair growth and follicle size by VEGF-mediated angiogenesis. The Journal of clinical investigation. 2001;107(4):409–17. 10.1172/JCI11317 [DOI] [PMC free article] [PubMed] [Google Scholar]
- 12. Elliott K, Stephenson TJ, Messenger AG. Differences in hair follicle dermal papilla volume are due to extracellular matrix volume and cell number: implications for the control of hair follicle size and androgen responses. The Journal of investigative dermatology. 1999;113(6):873–7. 10.1046/j.1523-1747.1999.00797.x . [DOI] [PubMed] [Google Scholar]
- 13. Otberg N, Richter H, Schaefer H, Blume-Peytavi U, Sterry W, Lademann J. Variations of hair follicle size and distribution in different body sites. The Journal of investigative dermatology. 2004;122(1):14–9. 10.1046/j.0022-202X.2003.22110.x . [DOI] [PubMed] [Google Scholar]
- 14. Scobie. DR, Young. SR, editors. the relationship between wool follicle density and fibre diameter is curvilinear Proceedings of the New Zealand Society of Animal Production; 2000: New Zealand Society of Animal Production. [Google Scholar]
- 15. Adelson DL, Hollis DE, Brown GH. Wool fibre diameter and follicle density are not specified simultaneously during wool follicle initiation. Australian Journal of Agricultural Research. 2002;53(9):1003–9. [Google Scholar]
- 16. Alcaraz MV, Villena A, Perez de Vargas I. Quantitative study of the human hair follicle in normal scalp and androgenetic alopecia. Journal of cutaneous pathology. 1993;20(4):344–9. . [DOI] [PubMed] [Google Scholar]
- 17. Ibrahim L, Wright EA. A quantitative study of hair growth using mouse and rat vibrissal follicles. I. Dermal papilla volume determines hair volume. Journal of embryology and experimental morphology. 1982;72:209–24. . [PubMed] [Google Scholar]
- 18. Adelson DL, Hollis DE, Brown GH. Wool fibre diameter and follicle density are not specified simultaneously during wool follicle initiation. Aust J Agr Res. 2002;53(9):1003–9. 10.1071/Ar01200 WOS:000178095800002. [DOI] [Google Scholar]
- 19. Adelson DL, Cam GR, DeSilva U, Franklin IR. Gene expression in sheep skin and wool (hair). Genomics. 2004;83(1):95–105. . [DOI] [PubMed] [Google Scholar]
- 20. Norris BJ, Bower NI, Smith WJM, Cam GR, Reverter A. Gene expression profiling of ovine skin and wool follicle development using a combined ovine-bovine skin cDNA microarray. Aust J Exp Agr. 2005;45(7–8):867–77. 10.1071/Ea05050 WOS:000231472300017. [DOI] [Google Scholar]
- 21. Lei M, Guo H, Qiu W, Lai X, Yang T, Widelitz RB, et al. Modulating hair follicle size with Wnt10b/DKK1 during hair regeneration. Experimental dermatology. 2014;23(6):407–13. 10.1111/exd.12416 . [DOI] [PMC free article] [PubMed] [Google Scholar]
- 22. Seiberg M, Liu JC, Babiarz L, Sharlow E, Shapiro S. Soymilk reduces hair growth and hair follicle dimensions. Experimental dermatology. 2001;10(6):405–13. . [DOI] [PubMed] [Google Scholar]
- 23. Jager M, Ott CE, Grunhagen J, Hecht J, Schell H, Mundlos S, et al. Composite transcriptome assembly of RNA-seq data in a sheep model for delayed bone healing. Bmc Genomics. 2011;12:158 10.1186/1471-2164-12-158 [DOI] [PMC free article] [PubMed] [Google Scholar]
- 24. Botchkarev VA, Paus R. Molecular biology of hair morphogenesis: development and cycling. Journal of experimental zoology Part B, Molecular and developmental evolution. 2003;298(1):164–80. 10.1002/jez.b.33 . [DOI] [PubMed] [Google Scholar]
- 25. Schmidt-Ullrich R, Paus R. Molecular principles of hair follicle induction and morphogenesis. BioEssays: news and reviews in molecular, cellular and developmental biology. 2005;27(3):247–61. 10.1002/bies.20184 . [DOI] [PubMed] [Google Scholar]
- 26. Bostjancic E, Glavac D. Importance of microRNAs in skin morphogenesis and diseases. Acta dermatovenerologica Alpina, Panonica, et Adriatica. 2008;17(3):95–102. . [PubMed] [Google Scholar]
- 27. Wang X, Tredget EE, Wu Y. Dynamic signals for hair follicle development and regeneration. Stem cells and development. 2012;21(1):7–18. 10.1089/scd.2011.0230 . [DOI] [PubMed] [Google Scholar]
- 28. Cadau S, Rosignoli C, Rhetore S, Voegel J, Parenteau-Bareil R, Berthod F. Early stages of hair follicle development: a step by step microarray identity. European journal of dermatology: EJD. 2013. 10.1684/ejd.2013.1972 . [DOI] [PubMed] [Google Scholar]
- 29. Millar SE. Molecular mechanisms regulating hair follicle development. J Invest Dermatol. 2002;118(2):216–25. 10.1046/j.0022-202x.2001.01670.x . [DOI] [PubMed] [Google Scholar]
- 30. Rogers GE. Biology of the wool follicle: an excursion into a unique tissue interaction system waiting to be re-discovered. Experimental dermatology. 2006;15(12):931–49. WOS:000241766500001. [DOI] [PubMed] [Google Scholar]
- 31. Purvis IW, Franklin IR. Major genes and QTL influencing wool production and quality: a review. Genetics, selection, evolution: GSE. 2005;37 Suppl 1:S97–107. 10.1051/gse:2004028 [DOI] [PMC free article] [PubMed] [Google Scholar]
- 32. Carthew RW, Sontheimer EJ. Origins and Mechanisms of miRNAs and siRNAs. Cell. 2009;136(4):642–55. 10.1016/j.cell.2009.01.035 WOS:000263688200016. [DOI] [PMC free article] [PubMed] [Google Scholar]
- 33. Carmichael GG. Antisense starts making more sense. Nat Biotechnol. 2003;21(4):371–2. 10.1038/Nbt0403-371 WOS:000182082400015. [DOI] [PubMed] [Google Scholar]
- 34. Katayama S, Tomaru Y, Kasukawa T, Waki K, Nakanishi M, Nakamura M, et al. Antisense transcription in the mammalian transcriptome. Science. 2005;309(5740):1564–6. 10.1126/science.1112009 WOS:000231715000050. [DOI] [PubMed] [Google Scholar]
- 35. Carninci P, Kasukawa T, Katayama S, Gough J, Frith MC, Maeda N, et al. The transcriptional landscape of the mammalian genome. Science. 2005;309(5740):1559–63. 10.1126/science.1112014 WOS:000231715000049. [DOI] [PubMed] [Google Scholar]
- 36. Clark MB, Amaral PP, Schlesinger FJ, Dinger ME, Taft RJ, Rinn JL, et al. The Reality of Pervasive Transcription. Plos Biol. 2011;9(7). ARTN e1000625 10.1371/journal.pbio.1000625 WOS:000293219800001. [DOI] [PMC free article] [PubMed] [Google Scholar]
- 37. Faghihi MA, Modarresi F, Khalil AM, Wood DE, Sahagan BG, Morgan TE, et al. Expression of a noncoding RNA is elevated in Alzheimer's disease and drives rapid feed-forward regulation of beta-secretase. Nat Med. 2008;14(7):723–30. 10.1038/Nm1784 WOS:000257452700019. [DOI] [PMC free article] [PubMed] [Google Scholar]
- 38. Gupta RA, Shah N, Wang KC, Kim J, Horlings HM, Wong DJ, et al. Long non-coding RNA HOTAIR reprograms chromatin state to promote cancer metastasis. Nature. 2010;464(7291):1071–U148. 10.1038/Nature08975 WOS:000276635000045. [DOI] [PMC free article] [PubMed] [Google Scholar]
- 39. Pariset L, Chillemi G, Bongiorni S, Spica VR, Valentini A. Microarrays and high-throughput transcriptomic analysis in species with incomplete availability of genomic sequences. New Biotechnol. 2009;25(5):272–9. WOS:000267621800003. 10.1016/j.nbt.2009.03.013 [DOI] [PubMed] [Google Scholar]
- 40. Shendure J. The beginning of the end for microarrays? Nat Methods. 2008;5(7):585–7. WOS:000257166700006. 10.1038/nmeth0708-585 [DOI] [PubMed] [Google Scholar]
- 41. Jiang Y, Xie M, Chen W, Talbot R, Maddox JF, Faraut T, et al. The sheep genome illuminates biology of the rumen and lipid metabolism. Science. 2014;344(6188):1168–73. 10.1126/science.1252806 [DOI] [PMC free article] [PubMed] [Google Scholar]
- 42. Martin JA, Wang Z. Next-generation transcriptome assembly. Nat Rev Genet. 2011;12(10):671–82. WOS:000294944500008. 10.1038/nrg3068 [DOI] [PubMed] [Google Scholar]
- 43. Pritchard CC, Cheng HH, Tewari M. MicroRNA profiling: approaches and considerations. Nat Rev Genet. 2012;13(5):358–69. 10.1038/nrg3198 . [DOI] [PMC free article] [PubMed] [Google Scholar]
- 44. Katayama S, Tomaru Y, Kasukawa T, Waki K, Nakanishi M, Nakamura M, et al. Antisense transcription in the mammalian transcriptome. Science. 2005;309(5740):1564–6. 10.1126/science.1112009 . [DOI] [PubMed] [Google Scholar]
- 45. Galbraith H. Fundamental hair follicle biology and fine fibre production in animals. Animal: an international journal of animal bioscience. 2010;4(9):1490–509. 10.1017/S175173111000025X . [DOI] [PubMed] [Google Scholar]
- 46. Nagalakshmi U, Wang Z, Waern K, Shou C, Raha D, Gerstein M, et al. The transcriptional landscape of the yeast genome defined by RNA sequencing. Science. 2008;320(5881):1344–9. WOS:000256441100046. 10.1126/science.1158441 [DOI] [PMC free article] [PubMed] [Google Scholar]
- 47. Cloonan N, Forrest ARR, Kolle G, Gardiner BBA, Faulkner GJ, Brown MK, et al. Stem cell transcriptome profiling via massive-scale mRNA sequencing. Nat Methods. 2008;5(7):613–9. 10.1038/Nmeth.1223 WOS:000257166700014. [DOI] [PubMed] [Google Scholar]
- 48. Wang Z, Gerstein M, Snyder M. RNA-Seq: a revolutionary tool for transcriptomics. Nat Rev Genet. 2009;10(1):57–63. WOS:000261866500012. 10.1038/nrg2484 [DOI] [PMC free article] [PubMed] [Google Scholar]
- 49. Denoeud F, Aury JM, Da Silva C, Noel B, Rogier O, Delledonne M, et al. Annotating genomes with massive-scale RNA sequencing. Genome biology. 2008;9(12). WOS:000263074100014. [DOI] [PMC free article] [PubMed] [Google Scholar]
- 50. Wang ET, Sandberg R, Luo SJ, Khrebtukova I, Zhang L, Mayr C, et al. Alternative isoform regulation in human tissue transcriptomes. Nature. 2008;456(7221):470–6. WOS:000261170500031. 10.1038/nature07509 [DOI] [PMC free article] [PubMed] [Google Scholar]
- 51. Maher CA, Kumar-Sinha C, Cao XH, Kalyana-Sundaram S, Han B, Jing XJ, et al. Transcriptome sequencing to detect gene fusions in cancer. Nature. 2009;458(7234):97–U9. WOS:000263836000040. 10.1038/nature07638 [DOI] [PMC free article] [PubMed] [Google Scholar]
- 52. Legue E, Nicolas JF. Hair follicle renewal: organization of stem cells in the matrix and the role of stereotyped lineages and behaviors. Development. 2005;132(18):4143–54. 10.1242/Dev.01975 WOS:000232579600012. [DOI] [PubMed] [Google Scholar]
- 53. Sennett R, Rendl M. Mesenchymal-epithelial interactions during hair follicle morphogenesis and cycling. Seminars in cell & developmental biology. 2012;23(8):917–27. 10.1016/j.semcdb.2012.08.011 [DOI] [PMC free article] [PubMed] [Google Scholar]
- 54. Purvis IW, Jeffery N. Genetics of fibre production in sheep and goats. Small Ruminant Res. 2007;70(1):42–7. WOS:000246550200005. [Google Scholar]
- 55. Botchkarev VA, Paus R. Molecular biology of hair morphogenesis: Development and cycling. J Exp Zool Part B. 2003;298B(1):164–80. WOS:000185162700011. [DOI] [PubMed] [Google Scholar]
- 56. Lei M, Bai X, Yang T, Lai X, Qiu W, Yang L, et al. Gsdma3 is a new factor needed for TNF-alpha-mediated apoptosis signal pathway in mouse skin keratinocytes. Histochemistry and cell biology. 2012;138(3):385–96. 10.1007/s00418-012-0960-1 . [DOI] [PubMed] [Google Scholar]
- 57. Filipczak PT, Piglowski W, Glowala-Kosinska M, Krawczyk Z, Scieglinska D. HSPA2 overexpression protects V79 fibroblasts against bortezomib-induced apoptosis. Biochemistry and cell biology = Biochimie et biologie cellulaire. 2012;90(2):224–31. 10.1139/o11-083 . [DOI] [PubMed] [Google Scholar]
- 58. Wang H, Yu J, Zhang L, Xiong Y, Chen S, Xing H, et al. RPS27a promotes proliferation, regulates cell cycle progression and inhibits apoptosis of leukemia cells. Biochem Biophys Res Commun. 2014;446(4):1204–10. 10.1016/j.bbrc.2014.03.086 . [DOI] [PubMed] [Google Scholar]
- 59. Strappazzon F, Torch S, Chatellard-Causse C, Petiot A, Thibert C, Blot B, et al. Alix is involved in caspase 9 activation during calcium-induced apoptosis. Biochem Bioph Res Co. 2010;397(1):64–9. 10.1016/j.bbrc.2010.05.062 WOS:000279292800012. [DOI] [PubMed] [Google Scholar]
- 60. Levy-Strumpf N, Kimchi A. Death associated proteins (DAPs): from gene identification to the analysis of their apoptotic and tumor suppressive functions. Oncogene. 1998;17(25):3331–40. WOS:000078048200014. [DOI] [PubMed] [Google Scholar]
- 61. Das E, Jana NR, Bhattacharyya NP. MicroRNA-124 targets CCNA2 and regulates cell cycle in STHdh(Q111)/Hdh(Q111) cells. Biochem Bioph Res Co. 2013;437(2):217–24. 10.1016/j.bbrc.2013.06.041 WOS:000323018100006. [DOI] [PubMed] [Google Scholar]
- 62. Reiner G, Heinricy L, Brenig B, Geldermann H, Dzapo V. Cloning, structural organization, and chromosomal assignment of the porcine c-fos proto-oncogene, FOS. Cytogenetics and cell genetics. 2000;89(1–2):59–61. 15565. . [DOI] [PubMed] [Google Scholar]
- 63. Fonseca DJ, Rojas RF, Vergara JI, Rios X, Uribe C, Chavez L, et al. A severe familial phenotype of Ichthyosis Curth-Macklin caused by a novel mutation in the KRT1 gene. Brit J Dermatol. 2013;168(2):456–8. 10.1111/j.1365-2133.2012.11181.x WOS:000314470600047. [DOI] [PubMed] [Google Scholar]
- 64. Glotzer DJ, Zelzer E, Olsen BR. Impaired skin and hair follicle development in Runx2 deficient mice. Developmental biology. 2008;315(2):459–73. 10.1016/j.ydbio.2008.01.005 [DOI] [PMC free article] [PubMed] [Google Scholar]
- 65. Sandilands A, Smith FJ, Lunny DP, Campbell LE, Davidson KM, MacCallum SF, et al. Generation and characterisation of keratin 7 (K7) knockout mice. PloS one. 2013;8(5):e64404 10.1371/journal.pone.0064404 [DOI] [PMC free article] [PubMed] [Google Scholar]
- 66. Smith FJ, Porter RM, Corden LD, Lunny DP, Lane EB, McLean WH. Cloning of human, murine, and marsupial keratin 7 and a survey of K7 expression in the mouse. Biochem Biophys Res Commun. 2002;297(4):818–27. . [DOI] [PubMed] [Google Scholar]
- 67. Tiganescu A, Walker EA, Hardy RS, Mayes AE, Stewart PM. Localization, Age- and Site-Dependent Expression, and Regulation of 11 beta-Hydroxysteroid Dehydrogenase Type 1 in Skin. J Invest Dermatol. 2011;131(1):30–6. 10.1038/Jid.2010.257 WOS:000285290300010. [DOI] [PubMed] [Google Scholar]
- 68. Yang K, Smith CL, Dales D, Hammond GL, Challis JR. Cloning of an ovine 11 beta-hydroxysteroid dehydrogenase complementary deoxyribonucleic acid: tissue and temporal distribution of its messenger ribonucleic acid during fetal and neonatal development. Endocrinology. 1992;131(5):2120–6. 10.1210/endo.131.5.1425412 . [DOI] [PubMed] [Google Scholar]
- 69. Korndorfer IP, Brueckner F, Skerra A. The crystal structure of the human (S100A8/S100A9)(2) heterotetramer, calprotectin, illustrates how conformational changes of interacting alpha-helices can determine specific association of two EF-hand proteins. J Mol Biol. 2007;370(5):887–98. 10.1016/j.jmb.2007.04.065 WOS:000247904500008. [DOI] [PubMed] [Google Scholar]
- 70. Nacken W, Roth J, Sorg C, Kerkhoff C. S100A9/S100A8: Myeloid representatives of the S100 protein family as prominent players in innate immunity. Microsc Res Techniq. 2003;60(6):569–80. 10.1002/Jemt.10299 WOS:000181885200005. [DOI] [PubMed] [Google Scholar]
- 71. Shen Z, Fahey JV, Bodwell JE, Rodriguez-Garcia M, Rossoll RM, Crist SG, et al. Estradiol Regulation of Nucleotidases in Female Reproductive Tract Epithelial Cells and Fibroblasts. PloS one. 2013;8(7). ARTN e69854 10.1371/journal.pone.0069854 WOS:000322433300071. [DOI] [PMC free article] [PubMed] [Google Scholar]
- 72. De Bessa SA, Salaorni S, Patrao DFC, Neto MM, Brentani MM, Nagai MA. JDP1 (DNAJC12/Hsp40) expression in breast cancer and its association with estrogen receptor status. Int J Mol Med. 2006;17(2):363–7. WOS:000234760900025. [PubMed] [Google Scholar]
- 73. Plikus MV, Baker RE, Chen CC, Fare C, de la Cruz D, Andl T, et al. Self-Organizing and Stochastic Behaviors During the Regeneration of Hair Stem Cells. Science. 2011;332(6029):586–9. 10.1126/science.1201647 WOS:000289991100048. [DOI] [PMC free article] [PubMed] [Google Scholar]
- 74. Botchkarev VA, Yaar M, Peters EMJ, Raychaudhuri SP, Botchkareva NV, Marconi A, et al. Neurotrophins in skin biology and pathology. J Invest Dermatol. 2006;126(8):1719–27. 10.1038/sj.jid.5700270 WOS:000241359100008. [DOI] [PubMed] [Google Scholar]
- 75. Chase HB, Montagna W, Malone JD. Changes in the skin in relation to the hair growth cycle. The Anatomical record. 1953;116(1):75–81. . [DOI] [PubMed] [Google Scholar]
- 76. Hausman GJ, Martin RJ. The development of adipocytes located around hair follicles in the fetal pig. Journal of animal science. 1982;54(6):1286–96. . [DOI] [PubMed] [Google Scholar]
- 77. Herrmann T, van der Hoeven F, Grone HJ, Stewart AF, Langbein L, Kaiser I, et al. Mice with targeted disruption of the fatty acid transport protein 4 (Fatp 4, Slc27a4) gene show features of lethal restrictive dermopathy. The Journal of cell biology. 2003;161(6):1105–15. 10.1083/jcb.200207080 [DOI] [PMC free article] [PubMed] [Google Scholar]
- 78. Chen HC, Smith SJ, Tow B, Elias PM, Farese RV Jr. Leptin modulates the effects of acyl CoA:diacylglycerol acyltransferase deficiency on murine fur and sebaceous glands. The Journal of clinical investigation. 2002;109(2):175–81. 10.1172/JCI13880 [DOI] [PMC free article] [PubMed] [Google Scholar]
- 79. Stone SJ, Myers HM, Watkins SM, Brown BE, Feingold KR, Elias PM, et al. Lipopenia and skin barrier abnormalities in DGAT2-deficient mice. J Biol Chem. 2004;279(12):11767–76. 10.1074/jbc.M311000200 . [DOI] [PubMed] [Google Scholar]
- 80. Yoshiura K, Kinoshita A, Ishida T, Ninokata A, Ishikawa T, Kaname T, et al. A SNP in the ABCC11 gene is the determinant of human earwax type. Nat Genet. 2006;38(3):324–30. 10.1038/Ng1733 WOS:000235589600014. [DOI] [PubMed] [Google Scholar]
- 81. Waluk DP, Schultz N, Hunt MC. Identification of glycine N-acyltransferase-like 2 (GLYATL2) as a transferase that produces N-acyl glycines in humans. Faseb J. 2010;24(8):2795–803. 10.1096/Fj.09-148551 WOS:000285005400020. [DOI] [PubMed] [Google Scholar]
- 82. Hagedorn C, Telgmann R, Brand E, Nicaud V, Schoenfelder J, Hasenkamp S, et al. SAH gene variants are associated with obesity-related hypertension in caucasians-the PEGASE study-. Eur Heart J. 2007;28:249–50. WOS:000208702201231. [DOI] [PubMed] [Google Scholar]
- 83. Holmes RS, Cox LA, VandeBerg JL. Comparative studies of mammalian acid lipases: Evidence for a new gene family in mouse and rat (Lipo). Comp Biochem Phys D. 2010;5(3):217–26. 10.1016/j.cbd.2010.05.004 WOS:000281314400005. [DOI] [PMC free article] [PubMed] [Google Scholar]
- 84. Lapidot M, Pilpel Y. Genome-wide natural antisense transcription: coupling its regulation to its different regulatory mechanisms. Embo Rep. 2006;7(12):1216–22. 10.1038/sj.embor.7400857 WOS:000242795500009. [DOI] [PMC free article] [PubMed] [Google Scholar]
- 85. Wahlestedt C. Natural antisense and noncoding RNA transcripts as potential drug targets. Drug Discov Today. 2006;11(11–12):503–8. 10.1016/j.drudis.2006.04.013 WOS:000238523500006. [DOI] [PubMed] [Google Scholar]
- 86. Ishibashi K, Kuwahara M, Kageyama Y, Tohsaka A, Marumo F, Sasaki S. Cloning and functional expression of a second new aquaporin abundantly expressed in testis. Biochem Bioph Res Co. 1997;237(3):714–8. 10.1006/bbrc.1997.7219 WOS:A1997XV79600045. [DOI] [PubMed] [Google Scholar]
- 87. Ma TH, Yang BX, Verkman AS. Cloning of a novel water and urea-permeable aquaporin from mouse expressed strongly in colon, placenta, liver, and heart. Biochem Bioph Res Co. 1997;240(2):324–8. 10.1006/bbrc.1997.7664 WOS:A1997YG93500013. [DOI] [PubMed] [Google Scholar]
- 88. Holm LM, Jahn TP, Moller ALB, Schjoerring JK, Ferri D, Klaerke DA, et al. NH3 and NH4+ permeability in aquaporin-expressing Xenopus oocytes. Pflug Arch Eur J Phy. 2005;450(6):415–28. 10.1007/s00424-005-1399-1 WOS:000232339900007. [DOI] [PubMed] [Google Scholar]
- 89. Calamita G, Moreno M, Ferri D, Silvestri E, Roberti P, Schiavo L, et al. Triiodothyronine modulates the expression of aquaporin-8 in rat liver mitochondria. J Endocrinol. 2007;192(1):111–20. 10.1677/Joe-06-0058 WOS:000244958100012. [DOI] [PubMed] [Google Scholar]
- 90. Bienert GP, Moller ALB, Kristiansen KA, Schulz A, Moller IM, Schjoerring JK, et al. Specific aquaporins facilitate the diffusion of hydrogen peroxide across membranes. J Biol Chem. 2007;282(2):1183–92. 10.1074/jbc.M603761200 WOS:000243295200044. [DOI] [PubMed] [Google Scholar]
- 91. Mantyjarvi R, Parkkinen S, Rytkonen M, Pentikainen J, Pelkonen J, Rautiainen J, et al. Complementary DNA cloning of the predominant allergen of bovine dander: A new member in the lipocalin family. J Allergy Clin Immun. 1996;97(6):1297–303. 10.1016/S0091-6749(96)70198-7 WOS:A1996VD60700018. [DOI] [PubMed] [Google Scholar]
- 92. Rautiainen J, Rytkonen M, Syrjanen K, Pentikainen J, Zeiler T, Virtanen T, et al. Tissue localization of bovine dander allergen Bos d 2. J Allergy Clin Immun. 1998;101(3):349–53. WOS:000072593900012. [DOI] [PubMed] [Google Scholar]
- 93. Gibbs S, Fijneman R, Wiegant J, van Kessel AG, van De Putte P, Backendorf C. Molecular characterization and evolution of the SPRR family of keratinocyte differentiation markers encoding small proline-rich proteins. Genomics. 1993;16(3):630–7. 10.1006/geno.1993.1240 . [DOI] [PubMed] [Google Scholar]
- 94. Ishida-Yamamoto A, Kartasova T, Matsuo S, Kuroki T, Iizuka H. Involucrin and SPRR are synthesized sequentially in differentiating cultured epidermal cells. J Invest Dermatol. 1997;108(1):12–6. . [DOI] [PubMed] [Google Scholar]
- 95. Candi E, Melino G, Mei G, Tarcsa E, Chung SI, Marekov LN, et al. Biochemical, structural, and transglutaminase substrate properties of human loricrin, the major epidermal cornified cell envelope protein. J Biol Chem. 1995;270(44):26382–90. . [DOI] [PubMed] [Google Scholar]
- 96. Wang L, Baldwin RL 6th, Jesse BW. Identification of two cDNA clones encoding small proline-rich proteins expressed in sheep ruminal epithelium. The Biochemical journal. 1996;317 (Pt 1):225–33. [DOI] [PMC free article] [PubMed] [Google Scholar]
- 97. Akiyama M, Smith LT, Yoneda K, Holbrook KA, Shimizu H. Transglutaminase and major cornified cell envelope precursor proteins, loricrin, small proline-rich proteins 1 and 2, and involucrin are coordinately expressed in the sites defined to form hair canal in developing human hair follicle. Exp Dermatol. 1999;8(4):313–4. . [PubMed] [Google Scholar]
- 98. Carregaro F, Stefanini AC, Henrique T, Tajara EH. Study of small proline-rich proteins (SPRRs) in health and disease: a review of the literature. Archives of dermatological research. 2013;305(10):857–66. 10.1007/s00403-013-1415-9 . [DOI] [PubMed] [Google Scholar]
- 99. Zimmermann N, Doepker MP, Witte DP, Stringer KF, Fulkerson PC, Pope SM, et al. Expression and regulation of small proline-rich protein 2 in allergic inflammation. American journal of respiratory cell and molecular biology. 2005;32(5):428–35. 10.1165/rcmb.2004-0269OC . [DOI] [PubMed] [Google Scholar]
- 100. Wang QQ, Liu F, Chen XS, Ma XJ, Zeng HQ, Yang ZM. Transcriptome profiling of early developing cotton fiber by deep-sequencing reveals significantly differential expression of genes in a fuzzless/lintless mutant. Genomics. 2010;96(6):369–76. 10.1016/j.ygeno.2010.08.009 . [DOI] [PubMed] [Google Scholar]
- 101. t Hoen PAC, Ariyurek Y, Thygesen HH, Vreugdenhil E, Vossen RHAM, de Menezes RX, et al. Deep sequencing-based expression analysis shows major advances in robustness, resolution and inter-lab portability over five microarray platforms. Nucleic acids research. 2008;36(21). WOS:000261299700030. [DOI] [PMC free article] [PubMed] [Google Scholar]
- 102. Morrissy AS, Morin RD, Delaney A, Zeng T, McDonald H, Jones S, et al. Next-generation tag sequencing for cancer gene expression profiling. Genome research. 2009;19(10):1825–35. WOS:000270389700015. 10.1101/gr.094482.109 [DOI] [PMC free article] [PubMed] [Google Scholar]
- 103. Tarazona S, Garcia-Alcalde F, Dopazo J, Ferrer A, Conesa A. Differential expression in RNA-seq: A matter of depth. Genome research. 2011;21(12):2213–23. WOS:000297918600020. 10.1101/gr.124321.111 [DOI] [PMC free article] [PubMed] [Google Scholar]
- 104. Xing K, Zhu F, Zhai LW, Liu HJ, Wang ZJ, Hou ZC, et al. The liver transcriptome of two full-sibling Songliao black pigs with extreme differences in backfat thickness. Journal of animal science and biotechnology. 2014;5 Artn 32 10.1186/2049-1891-5-32 WOS:000339281900001. [DOI] [PMC free article] [PubMed] [Google Scholar]
- 105. Haddad F, Qin AQX, Giger JM, Guo HY, Baldwin KM. Potential pitfalls in the accuracy of analysis of natural sense-antisense RNA pairs by reverse transcription-PCR. Bmc Biotechnol. 2007;7 Artn 21 10.1186/1472-6750-7-21 WOS:000246709200001. [DOI] [PMC free article] [PubMed] [Google Scholar]
- 106. Ashburner M, Ball CA, Blake JA, Botstein D, Butler H, Cherry JM, et al. Gene ontology: tool for the unification of biology. The Gene Ontology Consortium. Nat Genet. 2000;25(1):25–9. 10.1038/75556 [DOI] [PMC free article] [PubMed] [Google Scholar]
- 107. Kanehisa M, Araki M, Goto S, Hattori M, Hirakawa M, Itoh M, et al. KEGG for linking genomes to life and the environment. Nucleic acids research. 2008;36:D480–D4. 10.1093/Nar/Gkm882 WOS:000252545400086. [DOI] [PMC free article] [PubMed] [Google Scholar]
- 108. Young MD, Wakefield MJ, Smyth GK, Oshlack A. Gene ontology analysis for RNA-seq: accounting for selection bias. Genome biology. 2010;11(2):R14 10.1186/gb-2010-11-2-r14 [DOI] [PMC free article] [PubMed] [Google Scholar]
- 109. Mao XZ, Cai T, Olyarchuk JG, Wei LP. Automated genome annotation and pathway identification using the KEGG Orthology (KO) as a controlled vocabulary. Bioinformatics. 2005;21(19):3787–93. 10.1093/bioinformatics/bti430 WOS:000232596100013. [DOI] [PubMed] [Google Scholar]
Associated Data
This section collects any data citations, data availability statements, or supplementary materials included in this article.
Supplementary Materials
(DOCX)
(DOCX)
Data Availability Statement
All relevant data are within the paper and its Supporting Information files.